Why Oil Production May Disappoint
E&P companies routinely drill wells but hold off completing them until a later date. Completion includes creating a cement outer wall for the well to avoid leaks, and firing holes in the exterior in preparation for injection of fracking fluid under pressure. Typically wells can be drilled in sequence, as the drilling equipment is moved to the next site, but are completed in batches once a fracking crew is available. Drilled but Uncompleted wells (“DUCs”) are a form of production inventory, in that they represent future output once completed.
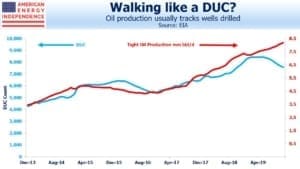
The Energy Information Administration collects data on DUCs, and it usually tracks production pretty closely. There’s an underlying assumption that a DUC will eventually be completed, but sometimes a drilled well is a dud, or completing it never becomes economically viable. Some believe that the EIA’s measure of DUCs is substantially overstated. This matters to future production, because fewer wells to be completed means less output, until more wells are drilled.
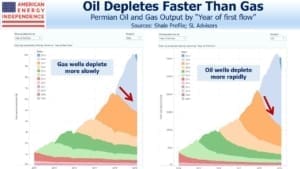
A characteristic of shale oil wells is that they deplete faster than natural gas. As crude production has increased in the U.S., this means that an ever greater number of new wells need to be drilled in order to compensate for depletion from an ever increasing number of current wells. Because this can’t happen indefinitely, production growth has to slow from it past torrid pace. We explored this in Drilling Down on Shale Depletion Rates.
The time from drilling to completion varies and doesn’t ultimately affect output, according to a study last year from the EIA (see Time between drilling and first production has little effect on oil well production). But it’s also true that the longer a well remains a DUC, the less likely it is to ever be productive.
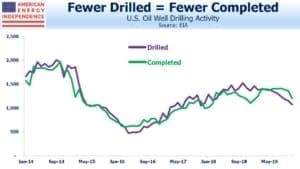
Currently, we’re completing around 1,200 wells per month. The EIA study referenced above estimated 3-4 months on average between drilling and completion – this was based only on North Dakota, so subsequent inferences rely on that single region to represent the country. But assuming the 3-4 months applies more broadly, that implies 3,600 to 4,800 DUCs in rolling inventory.
In recent months, DUCs have fallen noticeably although tight oil production has continued to grow. At around 7,500, DUCs are only modestly above our assumed rolling inventory. Because production has begun to diverge from DUCs, it suggests either drilling activity must pick up sharply to restore DUCs to output, or output itself will fall.
This doesn’t allow for any overestimate of DUCs by the EIA. Criticism from industry executives include comments such as, “My sense is the EIA DUC number implies more production capacity than actually exists and leads to downward revisions of supply estimates, which we have seen in the last six months.” Another added, “The EIA has no clue on their estimated number of DUCs, in my opinion.” Sadly, the executives are unnamed in last September’s piece from S&P Global Platts (see US producers criticize EIA estimates of DUCs, clouding production outlook).
Others seem to agree though. Raymond James estimates that the EIA is overstating DUCs by 2,000 wells. Spears & Associates believe the EIA may be overestimating DUCs by 3,000. In the last six months of 2019, completed wells exceeded drilled by 140 per month on average. If Raymond James and Spears & Associates are right about the EIA’s overstatement, then we’re already out of true DUC inventory.
The EIA is forecasting 13.3 Million Barrels per Day (MMB/D) of U.S. crude oil production this year, up from 12.2 MMB/D. The falling DUCs and possible overcounting create downside risk to this forecast, and upside potential for oil prices.
Important Disclosures
The information provided is for informational purposes only and investors should determine for themselves whether a particular service, security or product is suitable for their investment needs. The information contained herein is not complete, may not be current, is subject to change, and is subject to, and qualified in its entirety by, the more complete disclosures, risk factors and other terms that are contained in the disclosure, prospectus, and offering. Certain information herein has been obtained from third party sources and, although believed to be reliable, has not been independently verified and its accuracy or completeness cannot be guaranteed. No representation is made with respect to the accuracy, completeness or timeliness of this information. Nothing provided on this site constitutes tax advice. Individuals should seek the advice of their own tax advisor for specific information regarding tax consequences of investments. Investments in securities entail risk and are not suitable for all investors. This site is not a recommendation nor an offer to sell (or solicitation of an offer to buy) securities in the United States or in any other jurisdiction.
References to indexes and benchmarks are hypothetical illustrations of aggregate returns and do not reflect the performance of any actual investment. Investors cannot invest in an index and do not reflect the deduction of the advisor’s fees or other trading expenses. There can be no assurance that current investments will be profitable. Actual realized returns will depend on, among other factors, the value of assets and market conditions at the time of disposition, any related transaction costs, and the timing of the purchase. Indexes and benchmarks may not directly correlate or only partially relate to portfolios managed by SL Advisors as they have different underlying investments and may use different strategies or have different objectives than portfolios managed by SL Advisors (e.g. The Alerian index is a group MLP securities in the oil and gas industries. Portfolios may not include the same investments that are included in the Alerian Index. The S & P Index does not directly relate to investment strategies managed by SL Advisers.)
This site may contain forward-looking statements relating to the objectives, opportunities, and the future performance of the U.S. market generally. Forward-looking statements may be identified by the use of such words as; “believe,” “expect,” “anticipate,” “should,” “planned,” “estimated,” “potential” and other similar terms. Examples of forward-looking statements include, but are not limited to, estimates with respect to financial condition, results of operations, and success or lack of success of any particular investment strategy. All are subject to various factors, including, but not limited to general and local economic conditions, changing levels of competition within certain industries and markets, changes in interest rates, changes in legislation or regulation, and other economic, competitive, governmental, regulatory and technological factors affecting a portfolio’s operations that could cause actual results to differ materially from projected results. Such statements are forward-looking in nature and involves a number of known and unknown risks, uncertainties and other factors, and accordingly, actual results may differ materially from those reflected or contemplated in such forward-looking statements. Prospective investors are cautioned not to place undue reliance on any forward-looking statements or examples. None of SL Advisors LLC or any of its affiliates or principals nor any other individual or entity assumes any obligation to update any forward-looking statements as a result of new information, subsequent events or any other circumstances. All statements made herein speak only as of the date that they were made. r
Certain hyperlinks or referenced websites on the Site, if any, are for your convenience and forward you to third parties’ websites, which generally are recognized by their top level domain name. Any descriptions of, references to, or links to other products, publications or services does not constitute an endorsement, authorization, sponsorship by or affiliation with SL Advisors LLC with respect to any linked site or its sponsor, unless expressly stated by SL Advisors LLC. Any such information, products or sites have not necessarily been reviewed by SL Advisors LLC and are provided or maintained by third parties over whom SL Advisors LLC exercise no control. SL Advisors LLC expressly disclaim any responsibility for the content, the accuracy of the information, and/or quality of products or services provided by or advertised on these third-party sites.
All investment strategies have the potential for profit or loss. Different types of investments involve varying degrees of risk, and there can be no assurance that any specific investment will be suitable or profitable for a client’s investment portfolio.
Past performance of the American Energy Independence Index is not indicative of future returns.


What is the reason that a well is less likely to be productive the longer it remains a DUC? Is that a technical phenomenon? How does the industry react to it?
Although waiting longer to complete a DUC doesn’t seem to affect a well’s productivity, circumstances can change such that a DUC that was originally planned for completion never is. If a DUC remains that way for 2-3 years, it seems less and less likely it will ever produce anything.
You seem to be assuming a steady state of DUCs vs. production. I’m not sure that is correct. My sense is the ratio of DUCs to production climbed recently, particularly in the Permian, as E&P firms initially responded to lack of offtake by drilling but not completing wells.