Which Pipeline Companies Are Best At Capital Allocation?

/
An axiom of capitalism is that a business must earn a Return On Invested Capital (ROIC) in excess of its Weighted Average Cost of Capital (WACC). It’s just as true for a lemonade stand as for a conglomerate.
I should note here that fifteen years ago our younger daughter (then about nine years old) set up a lemonade stand at the end of our backyard on the 12th tee at our golf club. Due to the generosity of the golfers passing by she earned an excessively high ROIC. This should have invited competition, but she sensibly took early retirement, concluding that capitalism wasn’t that complicated.
Wells Fargo recently updated their estimates of ROIC for midstream energy infrastructure companies. Results varied widely. They define this as capital invested versus change in EBITDA over rolling five-year periods. It’s not a perfect measure – for example, it excludes the management of existing assets. And a project that was funded at the end of the five years will generate future EBITDA not captured in the calculation.
Nonetheless, over time it offers a decent measure of how effectively management teams are making capital allocation decisions.
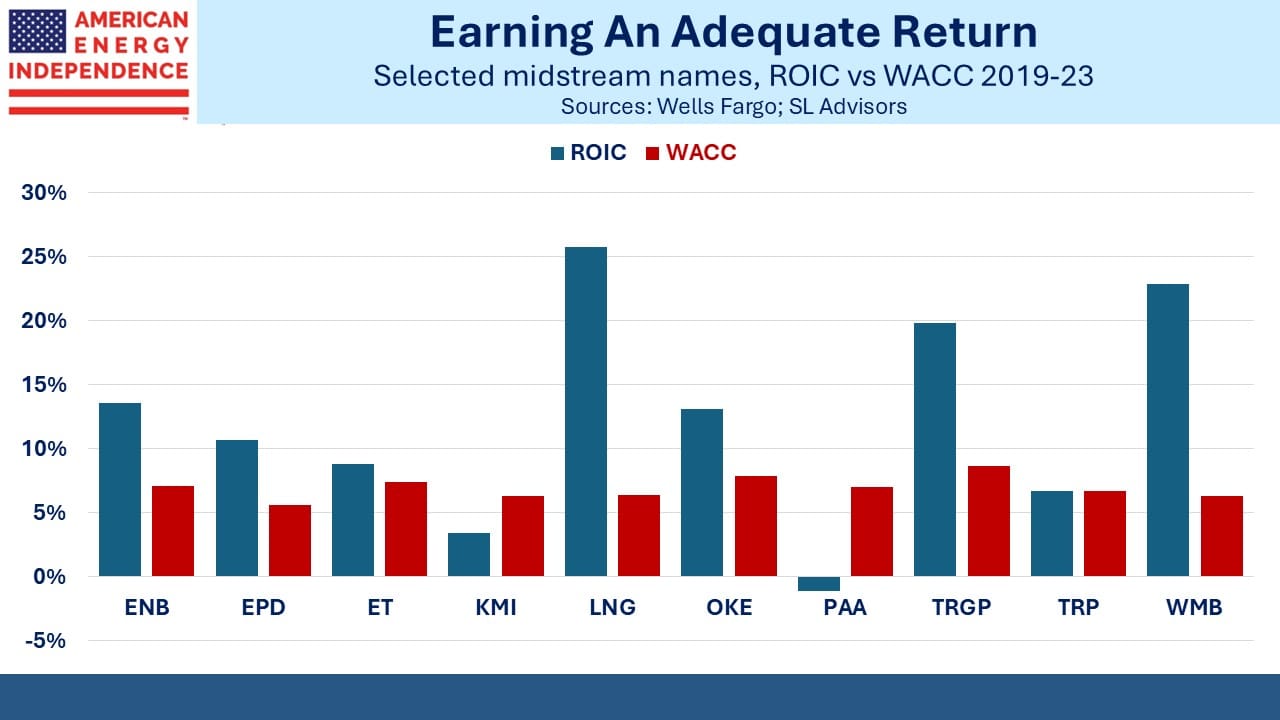
The first chart compares returns with cost of capital, or ROIC against WACC. Less risky businesses in theory enjoy a lower WACC, allowing them to profitably invest in lower return projects. The bigger the gap between ROIC and WACC, the happier the investors are. Cheniere (LNG) stands out as earning their owners a substantial return. Williams Companies (WMB) and Targa Resources (TRGP) are also very good.
At the other end, Kinder Morgan’s (KMI) capital allocation earned an inadequate return. The calculation for Plains All American (PAA) shows that their projects generated negative EBITDA, although this was more accurately the result of lower fees on Permian oil pipeline tariffs when they negotiated new rates.
Five years may be too short a time to judge. But Wells Fargo shows that skill in capital allocation seems to be persistent, in that for KMI and PAA, the results don’t look much better over the past decade either. When these companies talk excitedly about the growth projects they’re planning to finance, the non-fawning analyst might enquire whether their track record justifies such enthusiasm.
Of course, a business can perform well because of great returns from assets it already owns. The weak capital allocators in recent years are being supported by better decisions made long ago by their predecessors on the management team.
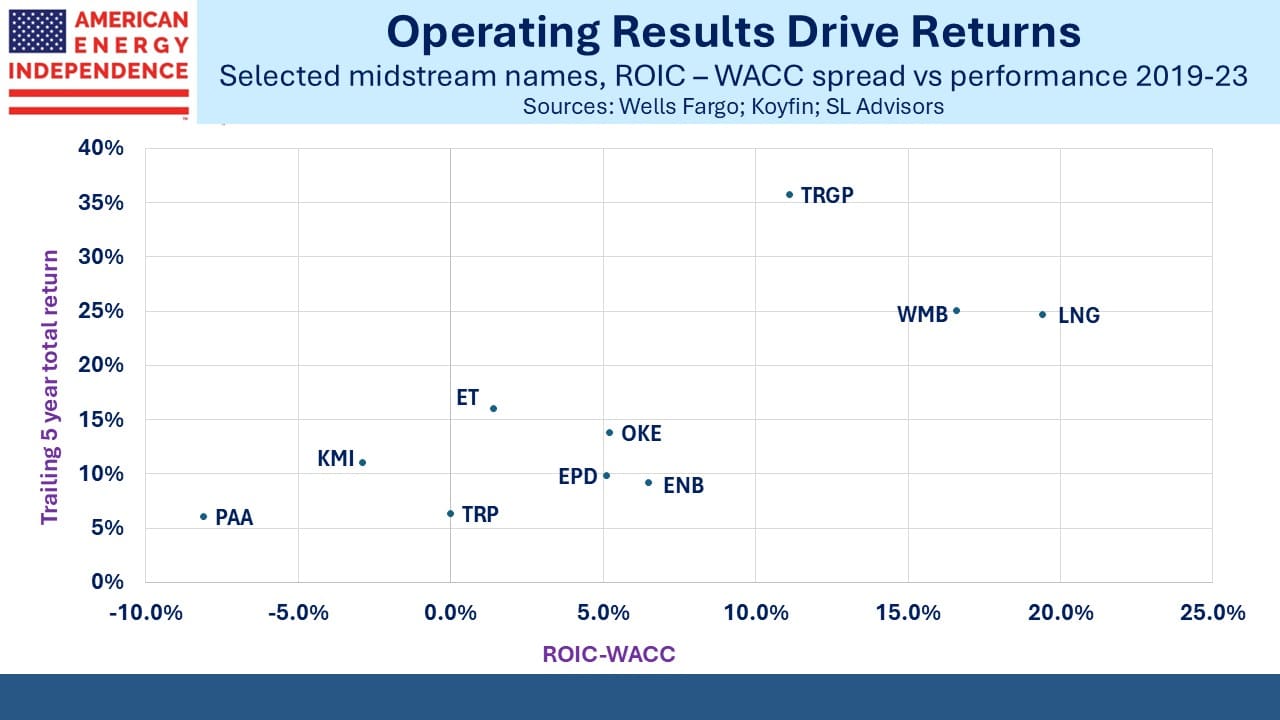
One would expect that proficiency in capital allocation drives longer term returns, and the second chart shows that’s generally true.
Targa Resources (TRGP) is the standout here. Five years ago TRGP was often criticized for its capex plans at a time when most companies were cutting spending after several years of poor returns. We were among the critics (see When Will MLPs Recover?).
In November 2019 we wrote, “Former CEO Joe Bob Perkins flippantly talked about new projects as ‘capital blessings’. Investors won’t miss his self-serving arrogance.”
It turns out that those decisions were on balance good ones. However, the same math showed that over the prior decade 2009-19, TRGP’s ROIC on capex ranged between 3% and 6%, so our skepticism was well founded. They showed that results can improve, although it’s uncommon.
One of TRGP’s best decisions was in 2018 when they took a majority stake in the Grand Prix NGL pipeline. By bringing NGLs from the Permian in West Texas to their Mont Belvieu processing facility and Galena Park export terminal in Texas they became more vertically integrated. In January 2023 they took complete control of Grand Prix by acquiring Blackstone’s remaining 25% interest.
Cheniere has both the best spread of ROIC vs its WACC as well as the highest overall ROIC. Completing projects on time and under budget helped. Cheniere also profited from the jump in global natural gas prices following Russia’s 2022 invasion of Ukraine.
Cheniere is benefiting from substantial capex in prior years. Their export terminals require comparatively little spending on upkeep. Their maintenance capex as a % of EBITDA is consistently at the low end of their peer group, which feeds through into a higher ROIC.
TC Energy was hurt by cost overruns on their Coastal Gas Link pipeline in Canada and spending on the proposed Keystone XL crude pipeline, which President Biden canceled in January 2021 shortly after taking office.
Looking ahead, Wells Fargo generally expects history to repeat, Differentiating among companies based on their capital allocation is one of the most important variables to consider in constructing a portfolio. We expect the industry to continue delivering good results on this metric.
We have two have funds that seek to profit from this environment:

Important Disclosures
The information provided is for informational purposes only and investors should determine for themselves whether a particular service, security or product is suitable for their investment needs. The information contained herein is not complete, may not be current, is subject to change, and is subject to, and qualified in its entirety by, the more complete disclosures, risk factors and other terms that are contained in the disclosure, prospectus, and offering. Certain information herein has been obtained from third party sources and, although believed to be reliable, has not been independently verified and its accuracy or completeness cannot be guaranteed. No representation is made with respect to the accuracy, completeness or timeliness of this information. Nothing provided on this site constitutes tax advice. Individuals should seek the advice of their own tax advisor for specific information regarding tax consequences of investments. Investments in securities entail risk and are not suitable for all investors. This site is not a recommendation nor an offer to sell (or solicitation of an offer to buy) securities in the United States or in any other jurisdiction.
References to indexes and benchmarks are hypothetical illustrations of aggregate returns and do not reflect the performance of any actual investment. Investors cannot invest in an index and do not reflect the deduction of the advisor’s fees or other trading expenses. There can be no assurance that current investments will be profitable. Actual realized returns will depend on, among other factors, the value of assets and market conditions at the time of disposition, any related transaction costs, and the timing of the purchase. Indexes and benchmarks may not directly correlate or only partially relate to portfolios managed by SL Advisors as they have different underlying investments and may use different strategies or have different objectives than portfolios managed by SL Advisors (e.g. The Alerian index is a group MLP securities in the oil and gas industries. Portfolios may not include the same investments that are included in the Alerian Index. The S & P Index does not directly relate to investment strategies managed by SL Advisers.)
This site may contain forward-looking statements relating to the objectives, opportunities, and the future performance of the U.S. market generally. Forward-looking statements may be identified by the use of such words as; “believe,” “expect,” “anticipate,” “should,” “planned,” “estimated,” “potential” and other similar terms. Examples of forward-looking statements include, but are not limited to, estimates with respect to financial condition, results of operations, and success or lack of success of any particular investment strategy. All are subject to various factors, including, but not limited to general and local economic conditions, changing levels of competition within certain industries and markets, changes in interest rates, changes in legislation or regulation, and other economic, competitive, governmental, regulatory and technological factors affecting a portfolio’s operations that could cause actual results to differ materially from projected results. Such statements are forward-looking in nature and involves a number of known and unknown risks, uncertainties and other factors, and accordingly, actual results may differ materially from those reflected or contemplated in such forward-looking statements. Prospective investors are cautioned not to place undue reliance on any forward-looking statements or examples. None of SL Advisors LLC or any of its affiliates or principals nor any other individual or entity assumes any obligation to update any forward-looking statements as a result of new information, subsequent events or any other circumstances. All statements made herein speak only as of the date that they were made. r
Certain hyperlinks or referenced websites on the Site, if any, are for your convenience and forward you to third parties’ websites, which generally are recognized by their top level domain name. Any descriptions of, references to, or links to other products, publications or services does not constitute an endorsement, authorization, sponsorship by or affiliation with SL Advisors LLC with respect to any linked site or its sponsor, unless expressly stated by SL Advisors LLC. Any such information, products or sites have not necessarily been reviewed by SL Advisors LLC and are provided or maintained by third parties over whom SL Advisors LLC exercise no control. SL Advisors LLC expressly disclaim any responsibility for the content, the accuracy of the information, and/or quality of products or services provided by or advertised on these third-party sites.
All investment strategies have the potential for profit or loss. Different types of investments involve varying degrees of risk, and there can be no assurance that any specific investment will be suitable or profitable for a client’s investment portfolio.
Past performance of the American Energy Independence Index is not indicative of future returns.


I was surprised to see in the second chart that ET has a better ROIC than EPD.
What are MPLX’s WACC and ROIC?