The Climate Benefits Of LNG

/
The pause in issuing new Liquefied Natural Gas (LNG) permits is among the least defensible energy policies of this Administration. It has been widely criticized. Jamie Dimon called it naive, and the International Energy Agency worries that it will impede the supply of natural gas on global markets.
The US Department of Energy (DOE), which grants LNG export permits, has published studies (2014 and 2019) which concluded that when buyers of LNG use it to switch away from coal for power generation, it reduces global Green House Gas emissions (GHGs). Coal use is widespread in developing countries and is increasing along with overall electricity demand.
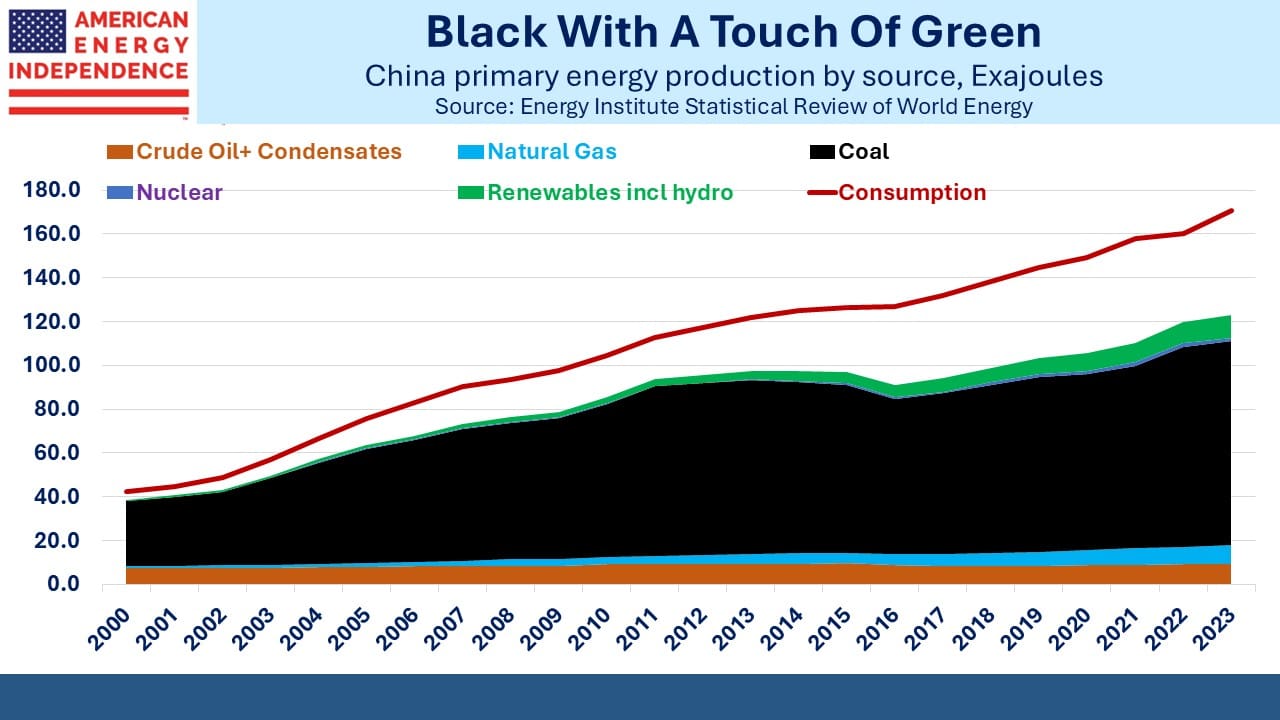
Non-OECD countries represented 85% of global coal consumption last year, up from 82% in 2022. China is 56% of the global total, where it is by far their biggest source of primary energy.
In the hunt for votes, the White House dropped careful analysis in favor of pandering to climate extremists and granting the permit pause they’d long sought. LNG exports allow us to support our friends and allies with cheap, reliable energy, so are in our national interest. But even if you’re a far left progressive with little care for such things, they also reduce global emissions.
Climate extremists focus on the wrong things, like banning new natural gas connections in New York. Their opposition to LNG exports harms the climate. The following math shows why:
The US Energy Information Administration (EIA) estimates that a coal-burning power plant generates 2.3 lbs of CO2 per Kilowatt Hour (KwH) of electricity, compared with 0.97 lbs for a natural gas power plant. Converting to metric, since GHGs are measured in Metric Tonnes (MTs), this is 1,044 grams for coal and 440 grams for natural gas.
Incidentally, in researching this I was interested to learn that virtually all the carbon atoms in natural gas (methane, CH4) attach themselves to oxygen when burned, creating CO2 in approximately the same volume as the methane that was used. CO2 is around 30% heavier than methane, both of which are denser than air*.
Returning to electricity – per KwH of power generation natural gas produces 604g less CO2. According to the EIA, it takes 7.42 cubic feet of gas to generate 1 KwH of power. So each cubic foot of gas reduces CO2 emissions by 81g (604/7.42) assuming it displaces coal in power generation.
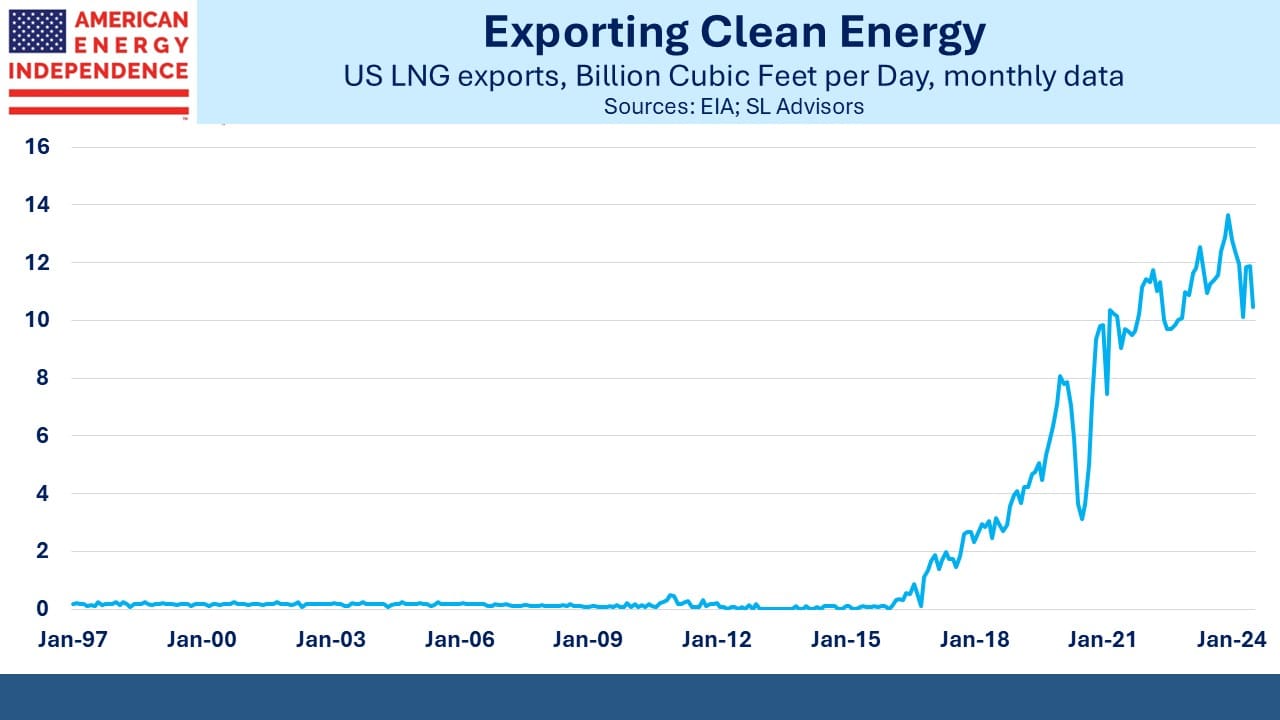
The US currently exports around 12 Billion Cubic Feet per Day (BCF/D) of LNG. Maintaining the assumption that this gas is being used instead of coal, 81g X 12 billion X 365 days means that our exports are reducing CO2 emissions by 356 million MTs annually.
Among non-OECD countries this is closest to the annual CO2 emissions of Vietnam (328 million MTs). Over the next five years our LNG exports will double, in spite of the LNG permit pause, because of LNG export terminals already approved and under construction. At that level the CO2 benefit will be almost equal to Indonesia’s emissions of 692 million MTs.
Most of the drop in US CO2 emissions over the past 15 years is because of coal-to-gas switching. US LNG exports offer the potential to spread that success to other countries. Climate extremists may argue that there’s no guarantee buyers of LNG will use it to reduce coal consumption. But it wouldn’t be hard to make this a condition of export approval.
Moreover, coal emits other local pollutants including nitrous oxides and sulfur dioxides which cause lung damage and lead to millions of premature deaths. So the benefits of natural gas are more than just the 58% reduction in CO2 emissions.
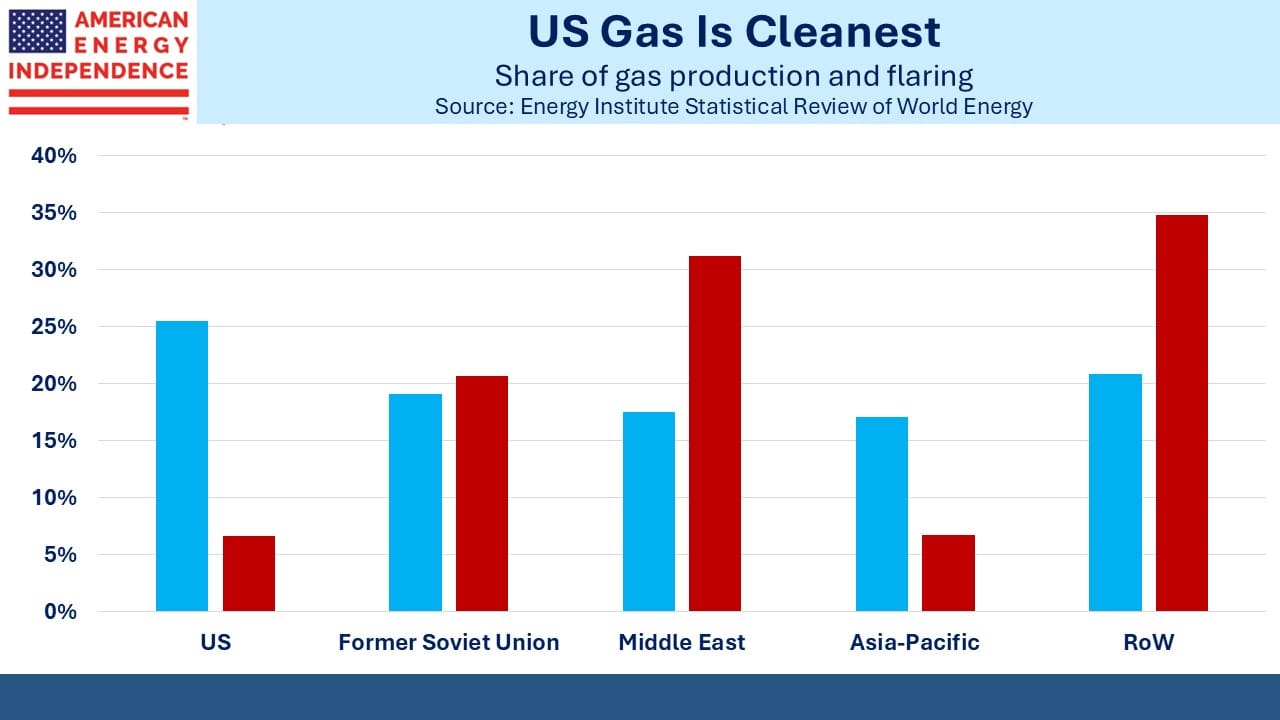
Some may point to methane leaks from gas production as weakening the case. But US standards are higher than elsewhere. We are the leader in having the lowest leaks per unit of production. The world benefits when countries buy from America rather than from another country with lower standards.
Climate extremists such as the Sierra Club and that wretched little girl Greta regularly push for policies that are impractical and will reduce living standards, most especially for people in developing countries. They have an outsized influence over the Democrats, which allows their poorly conceived ideas to sometimes escape into the light of day.
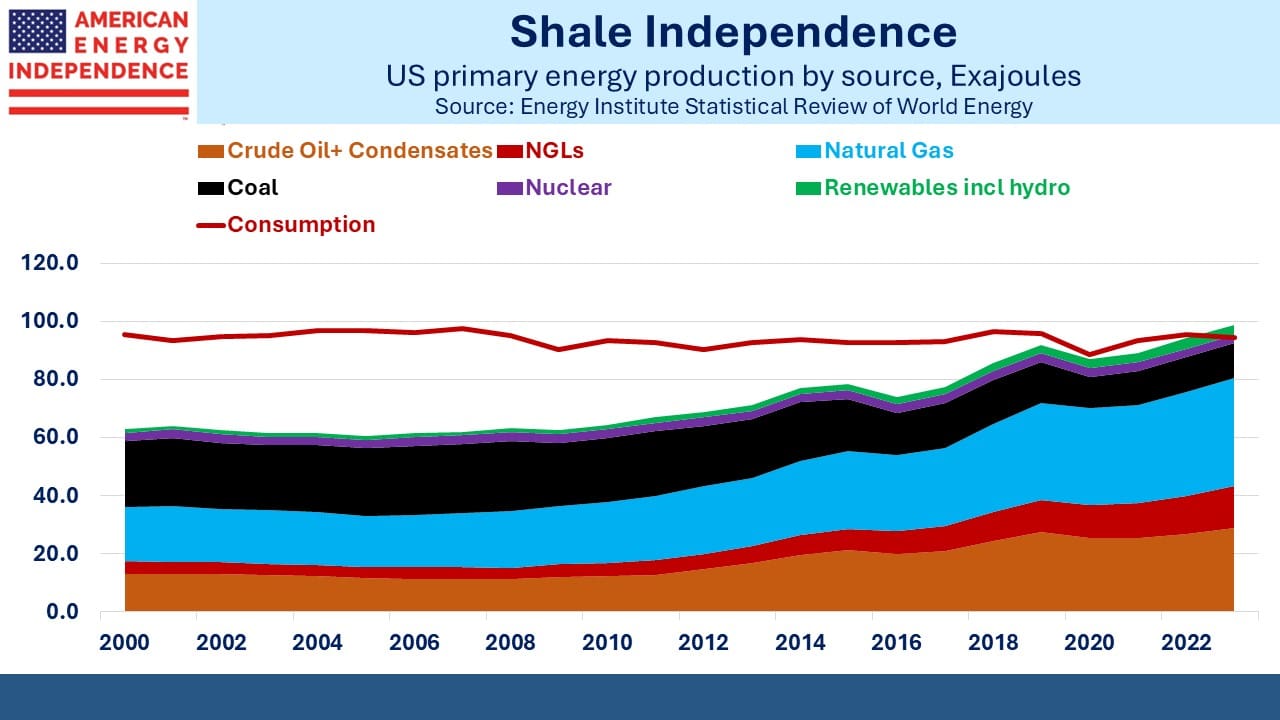
The US has already achieved substantial success in reducing emissions while renewables have remained an inconsequential part of our primary energy.
Texas is the country’s biggest user of windpower and Florida is 3rd in solar. Massachusetts imports LNG because it won’t allow new gas pipelines and California combines the highest electricity prices bar Hawaii with the least reliable grid.
Red states have more coherent energy policies than blue ones.
Betting on a shift to pragmatic energy policies has been the key to superior returns. We think that will continue to be the case. Long natural gas infrastructure and short renewables has worked for years.
If Kamala Harris loses next week, the influence of climate extremists will not be missed.
*A blog reader offered this detailed chemical analysis which is shown in full:
The mole balance equation for burning nat gas is pretty simple as there is only one carbon atom on both sides of the equation, which means (assuming complete combustion), each mol of CH4 generates 1 mol of CO2.
At standard temperature (0 degrees C) and pressure (sea level), all gases have 22.4 L of volume per mole, so the volumes of CH4 and CO2 should indeed be the same (assuming complete combustion).
I am pretty sure that H is 1 g/mol, C is 12 g/mol, O is 16 g/mol, and N is 28 g/mol, so:
Methane (CH4) is 16 g/mol
Carbon Dioxide (CO2) is 44 g/mol
Each g of Carbon will emit 44/12 = 3.67 g of Carbon Dioxide if fully combusted.
Air, which is roughly 80% N and 20% O is 29 g/mol
CO2 is roughly 50% heavier (denser) than air and natural gas is roughly 50% lighter than air, when all are at standard temperature and pressure.
I believe the CO2 is considerably less dense upon emission because of the heat produced by combustion, but CO2 is still technically denser than air and almost 3x the density of CH4.
I think the EIA publishes that the average US gas-fired power plant consumes 7,730 Btu of energy per kWh and US nat gas contains on average 1,040 Btu / ft^3.
That means it takes 7.4 ft^3 of nat gas to generate 1 kWh. There are 3.28 ft / m, so 7.4 ft^3 = 211 L of nat gas to generate 1 kWh of electricity.
I think that the EIA uses 60 degrees F or roughly 15 degrees C (288 degrees K) for its reporting, so you adjust the volume of one mole of gas by 288/273 x 22.4 = 23.6 L, so I think that the density of nat gas is reported by EIA is 16/23.6 = 0.68 g / L, which means it takes 8.9 moles of of CH4 with 143 g of mass to generate 1 kWh of electricity.
The 8.9 moles of nat gas should produce 8.9 moles of CO2 with density of 44 g/mol = 392 g CO2.
Pretty close to your number of 440 g.
The math is a bit trickier for coal, because coal typically has a mix of long chain carbon molecules and various impurities, but I think thermal coal, which is now mostly Chinese coal, has on average energy density of roughly 19 MJ / kg and contains about 52% carbon by mass.
The EIA reports that the average US coal-fired power plant consumes 10,500 Btu per kWh of electricity. At 948 Btu / MJ, that is 11 MJ or 11/19 = 0.58 kg of coal consumed per kWh.
At 52% carbon content, that would be 0.30 kg of carbon generating 0.30 x 44 / 12 = 1.10 kg of CO2.
Pretty close to your 1,044 g.
Note that natural gas energy density of 1,040 Btu per ft^3 translates into 57 MJ/ kg, which is 3x coal’s energy density of 19 MJ/kg.
1,040 Btu/ft^3 / 948 Btu/MJ = 1.1MJ/ft^3
1.1 MJ/ft^3 x (3.28 ft/m)^3 = 38.7 MJ/m^3
38.7 MJ/m^3 / 0.68 kg/m^3 = 57 MJ/kg
The two simple reasons why natural gas produces 65% less CO2 that coal:
1) Natural gas has 3x the energy density of coal (57 vs. 19 MJ/kg).
2) Natural gas burns 36% more efficiently than coal: 7,730 vs 10,500 Btu input energy per kWh (3,412 Btu) of electricity produced.
As an aside, some people are concerned that fugitive methane emissions might change this answer, but the data from the EIA and the Energy Institute shows that coal production and processing actually generates more fugitive methane emissions per unit of useful energy than natural gas production and processing.
According to the IEA, in 2023 natural gas production and processing generated 29 Mtpa of fugitive methane for 144 EJ of primary energy, which is 0.20 g CH4 per MJ of primary energy.
Coal production and processing generated 40 Mtpa of fugitive methane emissions for 164 EJ of primary energy , which is 0.24 g CH4 per MJ of primary energy, 20% more than natural gas.
Because coal requires 36% more primary energy that natural gas to generate a kWh of electricity, coal produces 0.74 g of fugitive methane emissions per kWh of coal-fired electricity.
That is 64% more than the 0.45 g of fugitive methane emissions from natural-gas fired electricity.
Using the IPCC’s recommended 100 year Global Warming Potential values of 29 for CH4 and 1 for CO2, the 0.74 g of CH4 from coal-fired electricity translates into 21.5 g CO2 equivalent and the 0.45 g of CH4 from gas-fired electricity translates into 13 g CO2 equivalent.
After factoring in fugitive methane emissions, coal-fired power emits 1.13 kg CO2e / kWh, which us 2.8x the 405 g of CO2e per kWh of gas-fired electricity.
After factoring in fugitive methane, gas-fired electricity has 64% less CO2 equivalent emissions then coal-fired electricity.
We have two have funds that seek to profit from this environment:

Important Disclosures
The information provided is for informational purposes only and investors should determine for themselves whether a particular service, security or product is suitable for their investment needs. The information contained herein is not complete, may not be current, is subject to change, and is subject to, and qualified in its entirety by, the more complete disclosures, risk factors and other terms that are contained in the disclosure, prospectus, and offering. Certain information herein has been obtained from third party sources and, although believed to be reliable, has not been independently verified and its accuracy or completeness cannot be guaranteed. No representation is made with respect to the accuracy, completeness or timeliness of this information. Nothing provided on this site constitutes tax advice. Individuals should seek the advice of their own tax advisor for specific information regarding tax consequences of investments. Investments in securities entail risk and are not suitable for all investors. This site is not a recommendation nor an offer to sell (or solicitation of an offer to buy) securities in the United States or in any other jurisdiction.
References to indexes and benchmarks are hypothetical illustrations of aggregate returns and do not reflect the performance of any actual investment. Investors cannot invest in an index and do not reflect the deduction of the advisor’s fees or other trading expenses. There can be no assurance that current investments will be profitable. Actual realized returns will depend on, among other factors, the value of assets and market conditions at the time of disposition, any related transaction costs, and the timing of the purchase. Indexes and benchmarks may not directly correlate or only partially relate to portfolios managed by SL Advisors as they have different underlying investments and may use different strategies or have different objectives than portfolios managed by SL Advisors (e.g. The Alerian index is a group MLP securities in the oil and gas industries. Portfolios may not include the same investments that are included in the Alerian Index. The S & P Index does not directly relate to investment strategies managed by SL Advisers.)
This site may contain forward-looking statements relating to the objectives, opportunities, and the future performance of the U.S. market generally. Forward-looking statements may be identified by the use of such words as; “believe,” “expect,” “anticipate,” “should,” “planned,” “estimated,” “potential” and other similar terms. Examples of forward-looking statements include, but are not limited to, estimates with respect to financial condition, results of operations, and success or lack of success of any particular investment strategy. All are subject to various factors, including, but not limited to general and local economic conditions, changing levels of competition within certain industries and markets, changes in interest rates, changes in legislation or regulation, and other economic, competitive, governmental, regulatory and technological factors affecting a portfolio’s operations that could cause actual results to differ materially from projected results. Such statements are forward-looking in nature and involves a number of known and unknown risks, uncertainties and other factors, and accordingly, actual results may differ materially from those reflected or contemplated in such forward-looking statements. Prospective investors are cautioned not to place undue reliance on any forward-looking statements or examples. None of SL Advisors LLC or any of its affiliates or principals nor any other individual or entity assumes any obligation to update any forward-looking statements as a result of new information, subsequent events or any other circumstances. All statements made herein speak only as of the date that they were made. r
Certain hyperlinks or referenced websites on the Site, if any, are for your convenience and forward you to third parties’ websites, which generally are recognized by their top level domain name. Any descriptions of, references to, or links to other products, publications or services does not constitute an endorsement, authorization, sponsorship by or affiliation with SL Advisors LLC with respect to any linked site or its sponsor, unless expressly stated by SL Advisors LLC. Any such information, products or sites have not necessarily been reviewed by SL Advisors LLC and are provided or maintained by third parties over whom SL Advisors LLC exercise no control. SL Advisors LLC expressly disclaim any responsibility for the content, the accuracy of the information, and/or quality of products or services provided by or advertised on these third-party sites.
All investment strategies have the potential for profit or loss. Different types of investments involve varying degrees of risk, and there can be no assurance that any specific investment will be suitable or profitable for a client’s investment portfolio.
Past performance of the American Energy Independence Index is not indicative of future returns.


Leave a Reply
Want to join the discussion?Feel free to contribute!