The Divergent Views About Energy Transfer
The contrast between the pricing of debt and equity issued by pipeline companies is probably the topic that most engages clients in our discussions. In a recent piece on the equity risk premium (see Stocks Are Still A Better Bet Than Bonds) we used the example of Enterprise Products Partners (EPD). Because EPD’s common units yield 3X its long term debt, an investor with the flexibility to move from one asset class to another could achieve a bond-like return by investing a small portion of her capital in the equity.
In short, it seems implausible for the market to be so enthusiastic about a company’s long term debt while at the same time pricing its equity as if prospects are dire. Nonetheless, this fairly describes the current state of the public markets for midstream energy infrastructure securities.
Bond yields are low everywhere, partly the result of inflexible investment mandates by a significant portion of the global investor base. We have touched on this issue before (see Blinded By The Bonds and Real Returns On Bonds Are Gone). The persistence of negative real yields on sovereign debt, and indeed negative nominal yields, such as German ten year government bonds at -0.50%, can hardly reflect a widespread fear of deflation. Fiscal discipline is no contest for fighting the pandemic, and the Federal Reserve has even modified its inflation targeting to allow an overshoot of 2%. The only logical conclusion is that a great many institutional investors own bonds not because they want to – but because they have to.
This situation has been years in the making. Rates fell to previously inconceivable levels during the 2009 financial crisis, and have remained there ever since.
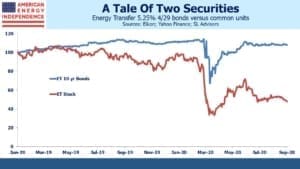
The comparison of Energy Transfer (ET) debt and equity over the past eighteen months offers a striking example of investors’ divergent views.
ET issued new ten year bonds in early January 2019, with a yield of 5.25%. The chart above shows the path followed by this debt and ET’s common units from that issue date. The two securities tracked one another for a few months before the bonds began to modestly outperform.
During the pandemic, debt and equity both fell sharply. The bonds fell less, reflecting their senior position in the capital structure. But the most striking feature of the chart is that the bonds have almost completely recovered and trade well above par, while the equity remains 50% lower than January 2019.
ET has a poor reputation for corporate governance, something we have noted (see Will Energy Transfer Act with Integrity?). Kelcy Warren’s bare-knuckle approach to business has made many enemies. But the company didn’t suddenly adopt its culture.
Legal challenges with the Dakota Access Pipeline (DAPL) are a potential headwind, but DAPL is around 3.5% of ET’s EBITDA so even a complete shutdown shouldn’t seriously impact the company (see Pipeline Opponents Help Free Cash Flow).
If the company’s prospects are as poor as implied by the weakness in its equity price, its debt has no business trading with a 4% yield. Conversely, if its balance sheet is as solid as this yield implies, the equity is mispriced.
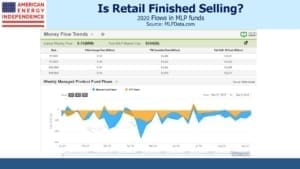
Just as bond investors seem to buy yield-less government bonds without regard to value, equity investors in this sector seem to sell with equal disregard for the outlook. MLP funds have labored under outflows virtually all year. In conversations with investors, the biggest source of frustration is that prices don’t reflect fundamentals, and are often under pressure. The consequent fund outflows are, for now, drawing more selling. Nobody worries about pipeline stocks being overpriced (a preposterous notion). They do ask when the stocks will go up.
The answer is, when the current cohort of frustrated sellers is done. It could be any day.
We are invested in all the components of the American Energy Independence Index via the ETF that seeks to track its performance.
Important Disclosures
The information provided is for informational purposes only and investors should determine for themselves whether a particular service, security or product is suitable for their investment needs. The information contained herein is not complete, may not be current, is subject to change, and is subject to, and qualified in its entirety by, the more complete disclosures, risk factors and other terms that are contained in the disclosure, prospectus, and offering. Certain information herein has been obtained from third party sources and, although believed to be reliable, has not been independently verified and its accuracy or completeness cannot be guaranteed. No representation is made with respect to the accuracy, completeness or timeliness of this information. Nothing provided on this site constitutes tax advice. Individuals should seek the advice of their own tax advisor for specific information regarding tax consequences of investments. Investments in securities entail risk and are not suitable for all investors. This site is not a recommendation nor an offer to sell (or solicitation of an offer to buy) securities in the United States or in any other jurisdiction.
References to indexes and benchmarks are hypothetical illustrations of aggregate returns and do not reflect the performance of any actual investment. Investors cannot invest in an index and do not reflect the deduction of the advisor’s fees or other trading expenses. There can be no assurance that current investments will be profitable. Actual realized returns will depend on, among other factors, the value of assets and market conditions at the time of disposition, any related transaction costs, and the timing of the purchase. Indexes and benchmarks may not directly correlate or only partially relate to portfolios managed by SL Advisors as they have different underlying investments and may use different strategies or have different objectives than portfolios managed by SL Advisors (e.g. The Alerian index is a group MLP securities in the oil and gas industries. Portfolios may not include the same investments that are included in the Alerian Index. The S & P Index does not directly relate to investment strategies managed by SL Advisers.)
This site may contain forward-looking statements relating to the objectives, opportunities, and the future performance of the U.S. market generally. Forward-looking statements may be identified by the use of such words as; “believe,” “expect,” “anticipate,” “should,” “planned,” “estimated,” “potential” and other similar terms. Examples of forward-looking statements include, but are not limited to, estimates with respect to financial condition, results of operations, and success or lack of success of any particular investment strategy. All are subject to various factors, including, but not limited to general and local economic conditions, changing levels of competition within certain industries and markets, changes in interest rates, changes in legislation or regulation, and other economic, competitive, governmental, regulatory and technological factors affecting a portfolio’s operations that could cause actual results to differ materially from projected results. Such statements are forward-looking in nature and involves a number of known and unknown risks, uncertainties and other factors, and accordingly, actual results may differ materially from those reflected or contemplated in such forward-looking statements. Prospective investors are cautioned not to place undue reliance on any forward-looking statements or examples. None of SL Advisors LLC or any of its affiliates or principals nor any other individual or entity assumes any obligation to update any forward-looking statements as a result of new information, subsequent events or any other circumstances. All statements made herein speak only as of the date that they were made. r
Certain hyperlinks or referenced websites on the Site, if any, are for your convenience and forward you to third parties’ websites, which generally are recognized by their top level domain name. Any descriptions of, references to, or links to other products, publications or services does not constitute an endorsement, authorization, sponsorship by or affiliation with SL Advisors LLC with respect to any linked site or its sponsor, unless expressly stated by SL Advisors LLC. Any such information, products or sites have not necessarily been reviewed by SL Advisors LLC and are provided or maintained by third parties over whom SL Advisors LLC exercise no control. SL Advisors LLC expressly disclaim any responsibility for the content, the accuracy of the information, and/or quality of products or services provided by or advertised on these third-party sites.
All investment strategies have the potential for profit or loss. Different types of investments involve varying degrees of risk, and there can be no assurance that any specific investment will be suitable or profitable for a client’s investment portfolio.
Past performance of the American Energy Independence Index is not indicative of future returns.


One possible reason for relentless selling is taxable investors are taking Biden at his word that he will eliminate step up basis. With the prospect of CG rates going up, maybe now is the time to sell zero basis interests.
Nobody has explained this to the algorithms which account for 75% or so of trading.