Real Returns On Bonds Are Gone
A recent short term strategy outlook from a large buyside firm walked through market expectations for Fed policy, S&P earnings, the election and drew conclusions about the likely direction of stocks over the next six months. Such analysis is endlessly fascinating even if trading profits are unreliable.
The essay touched on, but didn’t examine, what must be the biggest force driving markets – persistently low interest rates.
The real return on ten year treasury notes going back almost a century is 2%. Given 2% inflation, a neutral Fed should cause long term yields to drift up towards 4%. The Fed has been manipulating rates lower for most of the past decade since the 2008-9 financial crisis, but last year the bond buying ended and short term rates began moving higher. Yet ten year note yields peaked at 3.3% in November before descending to 2% recently.
Clearly, the historic relationship has changed. The balance between demand for and supply of safe, long term assets has shifted. Bond investors collectively have accepted lower future returns. There is plenty of interesting academic research to explain why. Real interest rates have been in decline for thirty years, as shown in this chart from the Federal Reserve Bank of Minneapolis. They now appear to be negative, as defined by the average short term rate over the past decade.
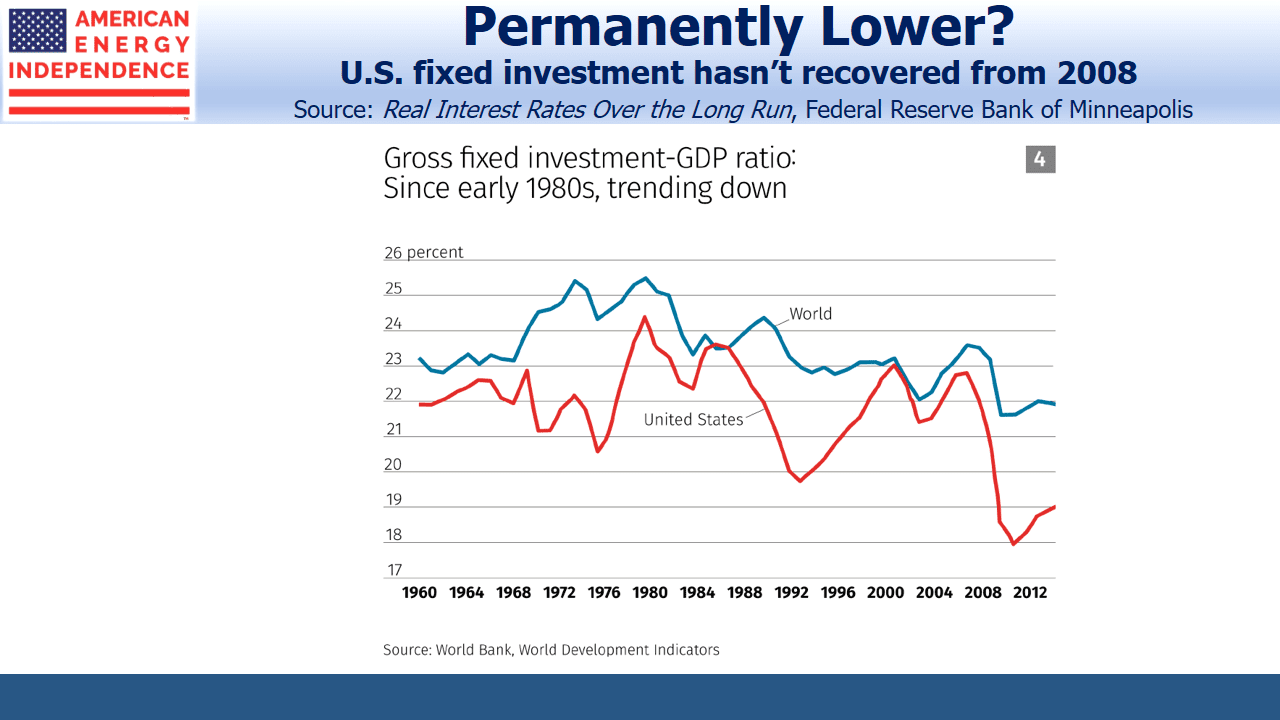
Although many commentators fret over what they perceive as unsustainably high stock prices, the plausible explanations for low interest rates largely reflect reduced risk tolerance by investors. While the decline in real rates has been steady, gross fixed investment fell sharply in the U.S. during the financial crisis and has barely recovered. This implies companies have remained cautious, dampening the issuance of long term corporate debt.
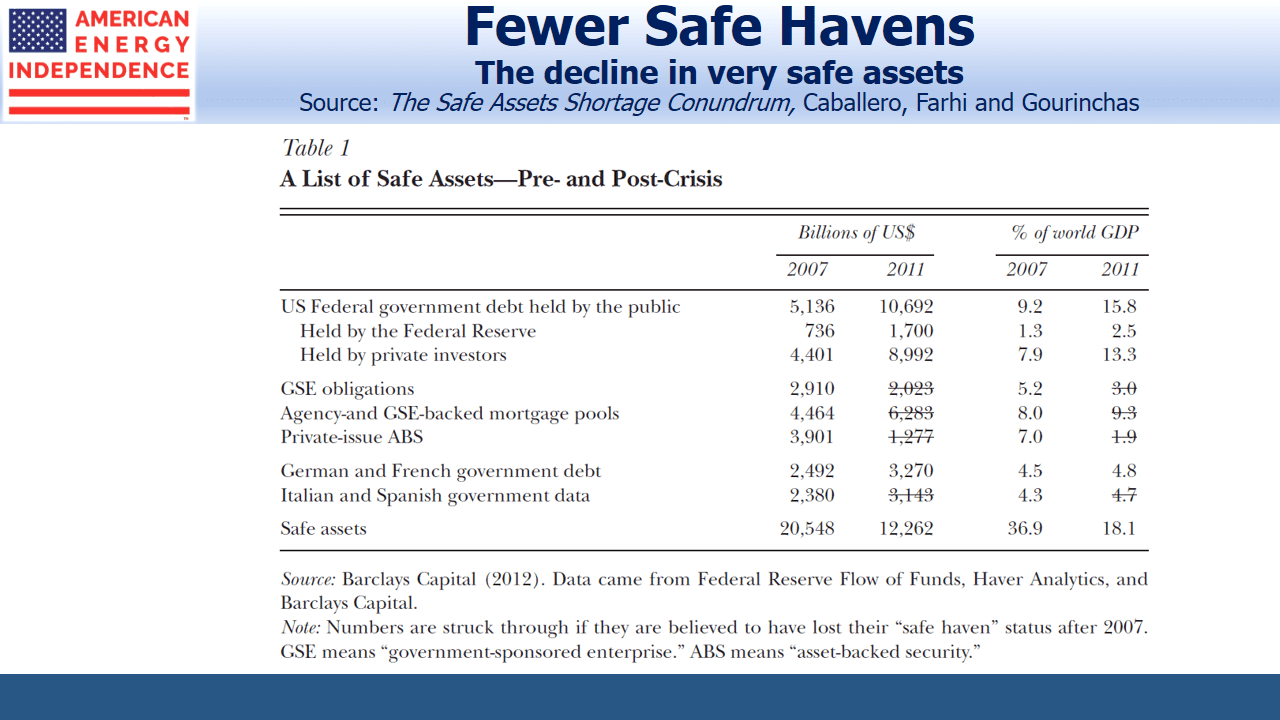
Another factor, highlighted in The Safe Asset Shortage (Caballero et al), notes that the financial crisis and subsequent Eurozone crisis led to a reassessment of which assets really were safe. Debt issued by FNMA and FHMC was assumed to be more risky following their conservatorship by the U.S. Unsatisfied demand for AAA debt instruments led Wall Street to produce Collateralized Debt Obligations (CDOs), which sought to pool riskier debt and repackage it into tranches of varying risk. But it turned out that the AAA tranche of a CDO retained some tail risk that sovereign debt did not. This perspective blames the 2008 crisis on unmet demand for safe assets.
Oddly, Caballero concludes that German and French sovereign debt similarly lost their allure. However, their yields are more than 2% lower than U.S. equivalents and solidly negative, which suggests ample holders willing to pay for what they perceive as highly safe investments.
Although memories of the financial crisis are receding, it seems to have permanently lowered risk tolerance. This, combined with a reduced supply of safe assets and perhaps the demographics of aging populations in wealthy countries have moved equilibrium long term rates lower. In recognition of this, the Fed has been adjusting their own long term equilibrium rate down in recent years.
A compelling solution is for a substantial increase in government funded infrastructure investment. This would take advantage of demand for long term debt and, assuming better infrastructure raised productivity, would not increase debt:GDP.
The shortage of safe assets is also reflected in the Equity Risk Premium (ERP), the difference between the earnings yield on the S&P500 and ten year treasury yields. It shows that stocks are cheap relative to bonds.
Since any investment is worth the net present value of its future cashflows, discounted at an appropriate interest rate, this has profound implications for stocks. Bond yields that are permanently lower suggest that stocks need to adjust substantially higher before fixed income can offer a competitive return.
The historically wide ERP underpins an investor’s choice to overweight equities. A return to its 50-year average of 0.6 (versus 3.6 today) isn’t imminent. But if next year it narrows halfway, to 2.1, and earnings grow by the 11% Factset bottom-up forecast, the S&P500 will be at around 4,400, nearly 50% higher than today.
U.S. energy infrastructure is an even better bet than the broader equity market. The shortage of high quality long term assets makes this sector especially attractive, as private equity funds seem to appreciate more readily than public markets.
Whatever the causes of permanently low interest rates, they strengthen the case for owning equities.
Join us on Thursday, July 11th at 1pm EST for a webinar. We’ll discuss the pipeline sector’s growing Free Cash Flow. To register, please click here.
SL Advisors is the sub-advisor to the Catalyst MLP & Infrastructure Fund. To learn more about the Fund, please click here.
SL Advisors is also the advisor to an ETF (USAIETF.com).
Important Disclosures
The information provided is for informational purposes only and investors should determine for themselves whether a particular service, security or product is suitable for their investment needs. The information contained herein is not complete, may not be current, is subject to change, and is subject to, and qualified in its entirety by, the more complete disclosures, risk factors and other terms that are contained in the disclosure, prospectus, and offering. Certain information herein has been obtained from third party sources and, although believed to be reliable, has not been independently verified and its accuracy or completeness cannot be guaranteed. No representation is made with respect to the accuracy, completeness or timeliness of this information. Nothing provided on this site constitutes tax advice. Individuals should seek the advice of their own tax advisor for specific information regarding tax consequences of investments. Investments in securities entail risk and are not suitable for all investors. This site is not a recommendation nor an offer to sell (or solicitation of an offer to buy) securities in the United States or in any other jurisdiction.
References to indexes and benchmarks are hypothetical illustrations of aggregate returns and do not reflect the performance of any actual investment. Investors cannot invest in an index and do not reflect the deduction of the advisor’s fees or other trading expenses. There can be no assurance that current investments will be profitable. Actual realized returns will depend on, among other factors, the value of assets and market conditions at the time of disposition, any related transaction costs, and the timing of the purchase. Indexes and benchmarks may not directly correlate or only partially relate to portfolios managed by SL Advisors as they have different underlying investments and may use different strategies or have different objectives than portfolios managed by SL Advisors (e.g. The Alerian index is a group MLP securities in the oil and gas industries. Portfolios may not include the same investments that are included in the Alerian Index. The S & P Index does not directly relate to investment strategies managed by SL Advisers.)
This site may contain forward-looking statements relating to the objectives, opportunities, and the future performance of the U.S. market generally. Forward-looking statements may be identified by the use of such words as; “believe,” “expect,” “anticipate,” “should,” “planned,” “estimated,” “potential” and other similar terms. Examples of forward-looking statements include, but are not limited to, estimates with respect to financial condition, results of operations, and success or lack of success of any particular investment strategy. All are subject to various factors, including, but not limited to general and local economic conditions, changing levels of competition within certain industries and markets, changes in interest rates, changes in legislation or regulation, and other economic, competitive, governmental, regulatory and technological factors affecting a portfolio’s operations that could cause actual results to differ materially from projected results. Such statements are forward-looking in nature and involves a number of known and unknown risks, uncertainties and other factors, and accordingly, actual results may differ materially from those reflected or contemplated in such forward-looking statements. Prospective investors are cautioned not to place undue reliance on any forward-looking statements or examples. None of SL Advisors LLC or any of its affiliates or principals nor any other individual or entity assumes any obligation to update any forward-looking statements as a result of new information, subsequent events or any other circumstances. All statements made herein speak only as of the date that they were made. r
Certain hyperlinks or referenced websites on the Site, if any, are for your convenience and forward you to third parties’ websites, which generally are recognized by their top level domain name. Any descriptions of, references to, or links to other products, publications or services does not constitute an endorsement, authorization, sponsorship by or affiliation with SL Advisors LLC with respect to any linked site or its sponsor, unless expressly stated by SL Advisors LLC. Any such information, products or sites have not necessarily been reviewed by SL Advisors LLC and are provided or maintained by third parties over whom SL Advisors LLC exercise no control. SL Advisors LLC expressly disclaim any responsibility for the content, the accuracy of the information, and/or quality of products or services provided by or advertised on these third-party sites.
All investment strategies have the potential for profit or loss. Different types of investments involve varying degrees of risk, and there can be no assurance that any specific investment will be suitable or profitable for a client’s investment portfolio.
Past performance of the American Energy Independence Index is not indicative of future returns.


Leave a Reply
Want to join the discussion?Feel free to contribute!