Pipelines Will Last Longer Than Equity Prices Imply
An enduring dichotomy in the valuation of midstream energy infrastructure companies has been the sharply different outlooks implied by debt versus equity pricing. Dividend yields of 6-7% suggest equity investors don’t regard their payouts as being sustainable indefinitely. Contrast that with investors in long term bonds, who accept yields of under 4% that can only be justified by a far more optimistic outlook about asset longevity. One camp presumably thinks the energy transition will leave pipeline companies with stranded assets, and the other believes the transition will not have harmed their prospects of principal repayment over the next three decades.
Equity investors probably don’t use years of remaining useful life as an input to valuing pipeline stocks. But their collective actions do imply such a judgment. In effect, the equity prices of pipeline companies imply that bond investors will lose their seniority in the capital structure before maturity. If Free Cash Flow to Equity (FCFE) will exhaust the company’s ability to pay its owners before long term bonds mature, those bond investors will wind up owning equity. How long will this take?
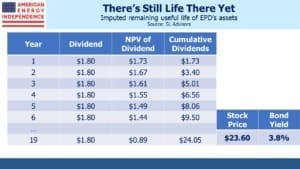
It turns out there’s a neat way to estimate this. The table below shows how this works for Enterprise Products Partners (EPD). It uses dividends because they’re easily identifiable, and therefore produces a more conservative (i.e. longer) useful life than using FCFE since companies are not paying out more than their FCFE in dividends nowadays.
Equity investors who have carefully considered buying EPD before ultimately rejecting it have concluded that the dividend will not last indefinitely. Therefore, they must regard the yield on EPD’s 30-year bonds as wholly inadequate for a fixed income investment, and that ultimately bond holders will own the equity when the existing common shareholders are wiped out. Since the bond yield is what the eventual owners need as compensation for this outcome, it can be used as the discount rate on future years’ FCFE. Adding up the successive years of FCFE until its value equals the price paid (i.e. today’s equity price) reveals when equity investors by implication expect those cashflows to stop.
For EPD equity investors, discounting the company’s $1.80 annual dividend back at the 3.8% yield on its 30-year debt means that today’s stock price reflects the NPV of 19 years’ worth of dividends. The company’s 7.6% dividend yield projects that today’s equity investors will be wiped out and replaced by bond holders, who will become the new owners of EPD, at that time.
This seems to us an unreasonably pessimistic view of the remaining useful life of the company’s assets. We’re also assuming no growth in dividends or giving credit to buybacks even though EPD has a buyback program in place which is returning additional value to equity investors. The implied useful life is even less than 19 years to the extent dividend growth and buybacks occur.
EPD bond investors fully expect to be repaid in full, and don’t anticipate owning the company. EPD’s stock price implies the opposite. It would be interesting to listen to a conversation between a well-informed non-buyer of EPD’s stock and one of their bond holders.
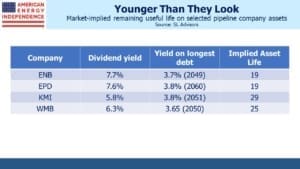
The math produces similar results for other big pipeline companies. Kinder Morgan’s (KMI) 29 year remaining asset life is longer than the others because its dividend is more generously covered. KMI slashed its dividend in 2015 and began cautiously increasing it in 2018. It has plenty of room to grow.
Environmental extremists would likely cheer the dour outlook reflected in pipeline stock prices. Last week the International Energy Agency (IEA) published a report laying out how the world could reach net zero energy-related emissions by 2050. It relies on some bold assumptions, such as no new investment in coal, oil or gas production starting now. It also incorporates significant behavioral changes including slower speed limits on highways, warmer settings on air conditioners and a 35% reduction in the percentage of households owning at least one car compared with current trends.
As usual the media covered the report’s release favorably. The Financial Times published three articles within 24 hours (Why the IEA is ‘calling time’ on the fossil fuel industry, Energy groups must stop new oil and gas projects to reach net zero by 2050, IEA says, and The IEA has delivered an overdue message). This is how pipeline equities are priced.
More representative of the view held by bond investors was Reuters, with Asia snubs IEA’s call to stop new fossil fuel investments. Although the energy transition will continue to impact everyone, the IEA’s report is more aspirational than plausible.
Even following this year’s rally, pipeline stocks reflect an expectation of stranded assets that bond investors, and many others reject. The sector is still cheap.
We are invested in all the components of the American Energy Independence Index via the ETF that seeks to track its performance.
We have three funds that seek to profit from this environment:
Important Disclosures
The information provided is for informational purposes only and investors should determine for themselves whether a particular service, security or product is suitable for their investment needs. The information contained herein is not complete, may not be current, is subject to change, and is subject to, and qualified in its entirety by, the more complete disclosures, risk factors and other terms that are contained in the disclosure, prospectus, and offering. Certain information herein has been obtained from third party sources and, although believed to be reliable, has not been independently verified and its accuracy or completeness cannot be guaranteed. No representation is made with respect to the accuracy, completeness or timeliness of this information. Nothing provided on this site constitutes tax advice. Individuals should seek the advice of their own tax advisor for specific information regarding tax consequences of investments. Investments in securities entail risk and are not suitable for all investors. This site is not a recommendation nor an offer to sell (or solicitation of an offer to buy) securities in the United States or in any other jurisdiction.
References to indexes and benchmarks are hypothetical illustrations of aggregate returns and do not reflect the performance of any actual investment. Investors cannot invest in an index and do not reflect the deduction of the advisor’s fees or other trading expenses. There can be no assurance that current investments will be profitable. Actual realized returns will depend on, among other factors, the value of assets and market conditions at the time of disposition, any related transaction costs, and the timing of the purchase. Indexes and benchmarks may not directly correlate or only partially relate to portfolios managed by SL Advisors as they have different underlying investments and may use different strategies or have different objectives than portfolios managed by SL Advisors (e.g. The Alerian index is a group MLP securities in the oil and gas industries. Portfolios may not include the same investments that are included in the Alerian Index. The S & P Index does not directly relate to investment strategies managed by SL Advisers.)
This site may contain forward-looking statements relating to the objectives, opportunities, and the future performance of the U.S. market generally. Forward-looking statements may be identified by the use of such words as; “believe,” “expect,” “anticipate,” “should,” “planned,” “estimated,” “potential” and other similar terms. Examples of forward-looking statements include, but are not limited to, estimates with respect to financial condition, results of operations, and success or lack of success of any particular investment strategy. All are subject to various factors, including, but not limited to general and local economic conditions, changing levels of competition within certain industries and markets, changes in interest rates, changes in legislation or regulation, and other economic, competitive, governmental, regulatory and technological factors affecting a portfolio’s operations that could cause actual results to differ materially from projected results. Such statements are forward-looking in nature and involves a number of known and unknown risks, uncertainties and other factors, and accordingly, actual results may differ materially from those reflected or contemplated in such forward-looking statements. Prospective investors are cautioned not to place undue reliance on any forward-looking statements or examples. None of SL Advisors LLC or any of its affiliates or principals nor any other individual or entity assumes any obligation to update any forward-looking statements as a result of new information, subsequent events or any other circumstances. All statements made herein speak only as of the date that they were made. r
Certain hyperlinks or referenced websites on the Site, if any, are for your convenience and forward you to third parties’ websites, which generally are recognized by their top level domain name. Any descriptions of, references to, or links to other products, publications or services does not constitute an endorsement, authorization, sponsorship by or affiliation with SL Advisors LLC with respect to any linked site or its sponsor, unless expressly stated by SL Advisors LLC. Any such information, products or sites have not necessarily been reviewed by SL Advisors LLC and are provided or maintained by third parties over whom SL Advisors LLC exercise no control. SL Advisors LLC expressly disclaim any responsibility for the content, the accuracy of the information, and/or quality of products or services provided by or advertised on these third-party sites.
All investment strategies have the potential for profit or loss. Different types of investments involve varying degrees of risk, and there can be no assurance that any specific investment will be suitable or profitable for a client’s investment portfolio.
Past performance of the American Energy Independence Index is not indicative of future returns.


I have two thoughts stimulated by the article:
1. There very well may be differing futures for different types of pipelines. Crude oil pipelines may not be in the same demand for the same length of time as natural gas pipelines or Y grade pipelines or NGL pipelines or LNG pipelines of LPG pipelines. Those differences may be material in the case–and to the detriment–of crude oil pipelines.
2. In the case of Enterprise Products Partners LP and other MLPs, please do not refer to partnership equity as stock or partnership payments as dividends. There is far more involved here than semantics. The tax consequences of each are very, very different, based on the nature of the entity. And in the case of partnership units the tax consequences annually may be very meaningful even if no distribution is made.
Seems rational for the market to price equity to offer the investor a div/distribution yield approximately 2x the same enterprise bond yield.
For most of 20th century, until 1990s, if I recall, this was norm. Equity was judged more volatile, less protected in the hierarchy of credit. Dividend paying equity should pay the investor 2x yield on the same company bond. All the time.
The market changed during last 2-3 decades. Participants progressively accepted (encouraged?) company equity (stock) to offer lower cash div/distribution. Maybe rising institutional holders did not need nor want current income compared to individual investors? Maybe preferential capital gain tax treatment over income tax encouraged lower equity yield? Redirecting company cash to stock buyback (capital gain rate) vs div/dist (ordinary income rate) fit, though energy pipelines historically issued new equity to grow.
Maybe the higher current yield on energy infrastructure equity vs same company bond is an example of a return to historically normal market pricing or equity vs debt after six years of energy market dislocation. Maybe it’s all the other market sectors continuing to mis-price equity, offering paltry div yield vs higher bond yield of same company (though sometimes even more paltry bond yield, lol).