Pipelines Grow Into Lower Risk

/
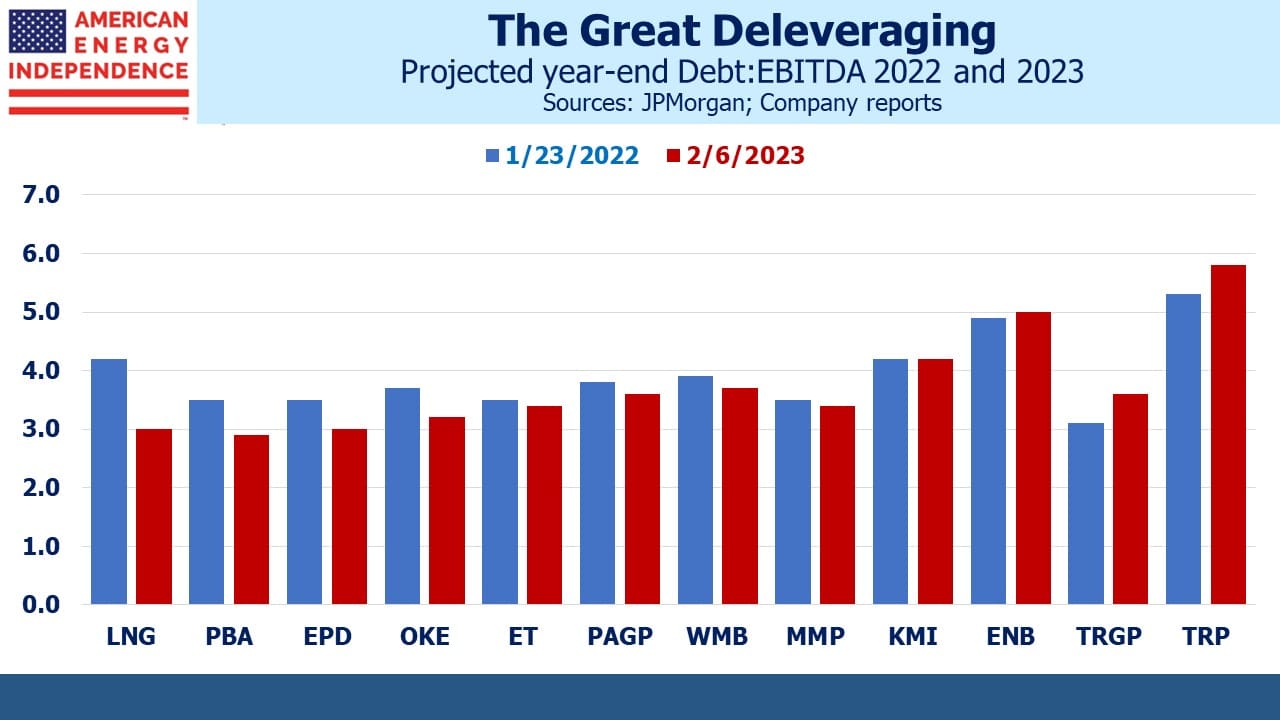
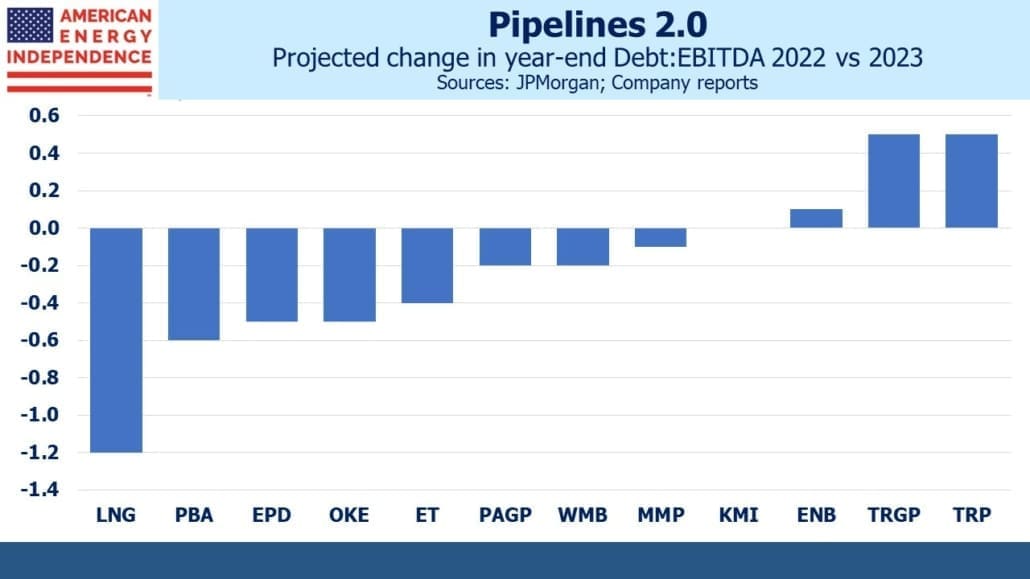
Enterprise Products Partners’ (EPD) earnings release last week revealed that leverage (Debt:EBITDA) fell to 2.9X at the end of last year. They are now targeting 3.0X, down from 3.5X previously. This is among the lowest in the industry, and reflects a continuing trend to strengthen balance sheets, de-risking the businesses. Years ago, Kinder Morgan argued to rating agencies and investors that their diverse asset footprint justified a 5.5X debt multiple. Poor capital allocation (see Will Kinder Morgan Cover Its Cost Of Capital?) led to distribution cuts and KMI has since fallen in line.
Also cheering for investors is that higher EBITDA has been the main driver of the lower risk profile. Growth is creating stronger balance sheets.
JPMorgan estimates that average leverage at big US pipeline corporations and MLPs this year will average 3.5X. Canadians Enbridge (ENB) and TC Energy (TRP) push this figure higher. ENB’s business includes gas distribution with regulated rates and is generally perceived as less risky.
The International Energy Agency recently forecast continued demand growth for global supplies of LNG.
News from the energy patch has been uniformly good in recent weeks, led by strong earnings but supplemented by greater realism about energy security and its impact on the energy transition. Emerging economies, especially in Asia, are growing and how they provide increasing energy to their upwardly mobile populations will determine the path for CO2 emissions.
The US shift from coal to cleaner-burning natural gas for power generation is a great success story in reducing global Green House Gases (GHGs). India is providing encouraging signs of emulating this, with its biggest LNG importer looking to add an additional 12 million Metric Tonnes per year under long term contracts.
Asia-ex Japan burns vast quantities of coal for power generation. The Asia Pacific region consumes an astonishing 80% of the world’s coal output. China is in a league of its own, burning more than the rest of the world combined. India is a distant second at 12% of global demand. PM Narendra Modri recently said he wants natural gas to provide 15% of India’s power by 2030, up from 6% today.
Poorer countries following the US lead in relying more heavily on natural gas to produce electricity offer our best chance of curbing emissions. It won’t be done with only solar and wind.
South Korea is recognizing the shortcoming of intermittent, weather dependent energy. They’re now planning for nuclear to meet a third of their power needs by 2030, up from 24% in their prior forecast. Renewables have been downgraded from 30% to under 22%. In countries with growing energy needs, reliability is a priority.
Exxon and Chevron both reported record profits recently. BP just followed suit, and now plans to increase its spending on oil and gas production although they’re still targeting a production cut of 25% by 2030 (previously 40%). This follows earlier reports that investments in renewables are delivering disappointing returns, leading to less emphasis on ESG goals. BP’s capex decisions are now guided by a long-term price target for Brent crude of $70 per barrel, up from $60 previously.
Siemens Energy is an example of the low returns in windpower, having recently announced a 4Q22 loss of €598MM due to quality issues on installed wind turbines. Siemens is planning to raise €1.5BN in additional equity to shore up its balance sheet.
ESG-driven capital allocation doesn’t assure profits.
Asian urgency around securing long term commitments of LNG supplies contrasts with Europe. Buyers are fearful that signing 20-year deals typically required by suppliers to ensure an adequate return on infrastructure investments will conflict with government regulations on hydrocarbon use. The EU is the region most willing to impose higher costs and inconvenience on their population in pursuit of reduced emissions.
Carbon capture is also growing in Europe. Denmark just approved a project that will by 2030 inject up to 8 million metric tonnes a year of CO2 into depleted oil and gas formations under the North Sea. Returning carbon in the form of CO2 underground into the formations it left as hydrocarbons has a certain logic to it. We noted a similar virtuous loop in Enlink’s plan to transport CO2 in south Texas from a petrochemical plant for eventual storage in the Eagle Ford (see Putting Carbon Back In The Ground).
Energy companies are showing they’re critical to providing secure energy with reduced emissions. It seemed improbable just three years ago, but the sector is having a good energy transition.
We have three funds that seek to profit from this environment:

Important Disclosures
The information provided is for informational purposes only and investors should determine for themselves whether a particular service, security or product is suitable for their investment needs. The information contained herein is not complete, may not be current, is subject to change, and is subject to, and qualified in its entirety by, the more complete disclosures, risk factors and other terms that are contained in the disclosure, prospectus, and offering. Certain information herein has been obtained from third party sources and, although believed to be reliable, has not been independently verified and its accuracy or completeness cannot be guaranteed. No representation is made with respect to the accuracy, completeness or timeliness of this information. Nothing provided on this site constitutes tax advice. Individuals should seek the advice of their own tax advisor for specific information regarding tax consequences of investments. Investments in securities entail risk and are not suitable for all investors. This site is not a recommendation nor an offer to sell (or solicitation of an offer to buy) securities in the United States or in any other jurisdiction.
References to indexes and benchmarks are hypothetical illustrations of aggregate returns and do not reflect the performance of any actual investment. Investors cannot invest in an index and do not reflect the deduction of the advisor’s fees or other trading expenses. There can be no assurance that current investments will be profitable. Actual realized returns will depend on, among other factors, the value of assets and market conditions at the time of disposition, any related transaction costs, and the timing of the purchase. Indexes and benchmarks may not directly correlate or only partially relate to portfolios managed by SL Advisors as they have different underlying investments and may use different strategies or have different objectives than portfolios managed by SL Advisors (e.g. The Alerian index is a group MLP securities in the oil and gas industries. Portfolios may not include the same investments that are included in the Alerian Index. The S & P Index does not directly relate to investment strategies managed by SL Advisers.)
This site may contain forward-looking statements relating to the objectives, opportunities, and the future performance of the U.S. market generally. Forward-looking statements may be identified by the use of such words as; “believe,” “expect,” “anticipate,” “should,” “planned,” “estimated,” “potential” and other similar terms. Examples of forward-looking statements include, but are not limited to, estimates with respect to financial condition, results of operations, and success or lack of success of any particular investment strategy. All are subject to various factors, including, but not limited to general and local economic conditions, changing levels of competition within certain industries and markets, changes in interest rates, changes in legislation or regulation, and other economic, competitive, governmental, regulatory and technological factors affecting a portfolio’s operations that could cause actual results to differ materially from projected results. Such statements are forward-looking in nature and involves a number of known and unknown risks, uncertainties and other factors, and accordingly, actual results may differ materially from those reflected or contemplated in such forward-looking statements. Prospective investors are cautioned not to place undue reliance on any forward-looking statements or examples. None of SL Advisors LLC or any of its affiliates or principals nor any other individual or entity assumes any obligation to update any forward-looking statements as a result of new information, subsequent events or any other circumstances. All statements made herein speak only as of the date that they were made. r
Certain hyperlinks or referenced websites on the Site, if any, are for your convenience and forward you to third parties’ websites, which generally are recognized by their top level domain name. Any descriptions of, references to, or links to other products, publications or services does not constitute an endorsement, authorization, sponsorship by or affiliation with SL Advisors LLC with respect to any linked site or its sponsor, unless expressly stated by SL Advisors LLC. Any such information, products or sites have not necessarily been reviewed by SL Advisors LLC and are provided or maintained by third parties over whom SL Advisors LLC exercise no control. SL Advisors LLC expressly disclaim any responsibility for the content, the accuracy of the information, and/or quality of products or services provided by or advertised on these third-party sites.
All investment strategies have the potential for profit or loss. Different types of investments involve varying degrees of risk, and there can be no assurance that any specific investment will be suitable or profitable for a client’s investment portfolio.
Past performance of the American Energy Independence Index is not indicative of future returns.


Leave a Reply
Want to join the discussion?Feel free to contribute!