Pipelines’ New Look

.avia-image-container.av-t5ali9-6cce321e9b8a0ee5b95da8d2659f62d0 img.avia_image{ box-shadow:none; } .avia-image-container.av-t5ali9-6cce321e9b8a0ee5b95da8d2659f62d0 .av-image-caption-overlay-center{ color:#ffffff; }

The point of a public equity listing is to be able to access public markets for financing, to use the stock as a currency for acquisitions, and to provide liquidity for investors. A company’s cost of equity moves inversely with its stock price, just like bond yields and prices. Access to cheap equity is vital for companies that have growth projects, including most energy infrastructure companies. MLPs continue to face a comparatively high cost of equity.

It’s one of the reasons why we believe over the past few years many of the biggest MLPs have “simplified”, which has often meant they’ve abandoned the MLP structure to become a regular corporation (a “c-corp”). An important objective behind each of these restructurings has been to lower their cost of equity. Kinder Morgan (KMI) led this move in 2014, when their desire for external capital to fund their backlog of growth projects collided with the interests of their income-seeking holders. Investors in Kinder Morgan Partners (KMP) weren’t much interested in plowing their distributions back into secondary offerings, so KMP’s yield rose to levels that made equity issuance uneconomic (see 2018 Lessons From The Pipeline Sector).

KMI decided to combine with KMP, creating unexpected tax bills for holders and leading (eventually) to two distribution cuts. The goal was to access a broader set of investors. Fewer than 10% of the money allocated to U.S. equities can invest in MLPs. Taxes and K-1s generally limit buyers to U.S. high net worth individuals. KMI wanted to reach U.S. pension funds, global sovereign wealth funds, and other significant buyers. They had outgrown the old, rich Americans, who used to own their stock. If you ever talk to a former KMP investor, you’ll learn how much bitterness this caused (see Kinder Morgan: Still Paying for Broken Promises).

Other MLPs followed, and today midstream energy infrastructure is more corporations than MLPs. The list includes Enbridge (ENB), Oneok (OKE), Pembina (PBA), Targa Resources (TRGP), Semgroup (SEMG), Transcanada (TRP) and Williams (WMB). None of these are in an MLP index.

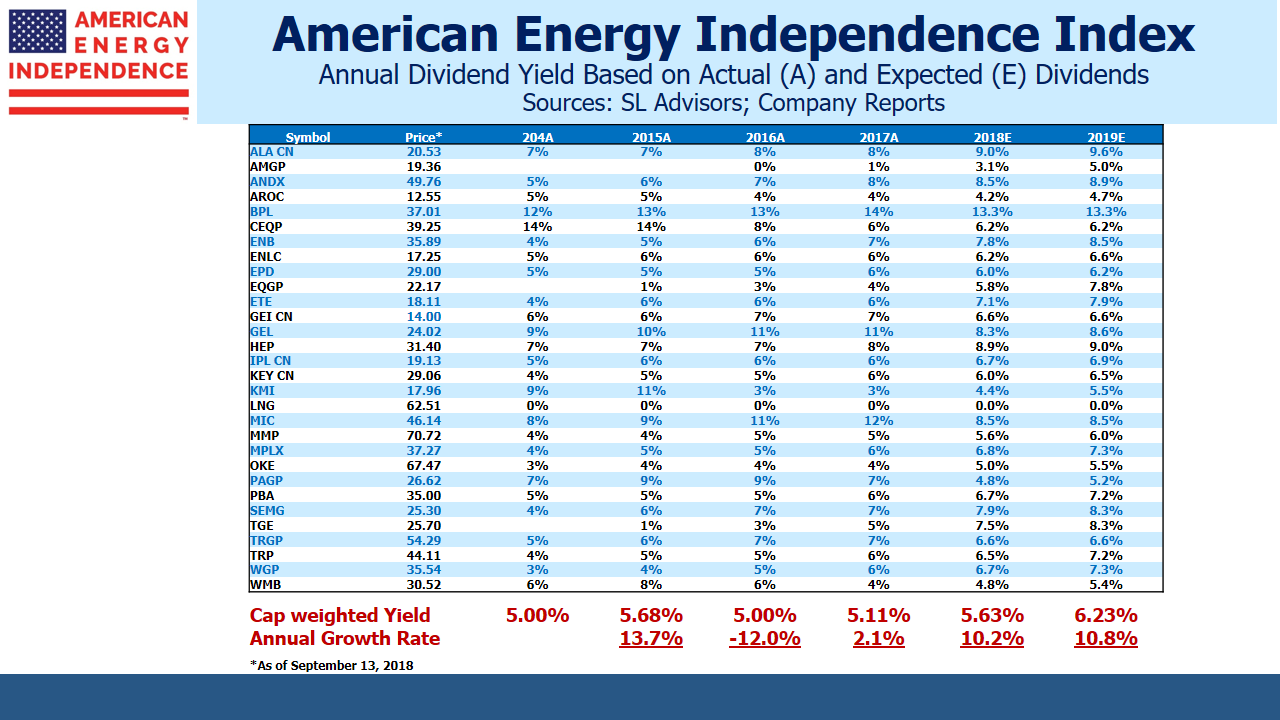
In late 2017 we created the investable American Energy Independence Index (AEITR). It’s a market-cap weighted index of North American energy infrastructure companies. It includes some MLPs, because the structure still works for those not in need of external equity. But MLPs are kept at 20%, reflecting their diminished role.

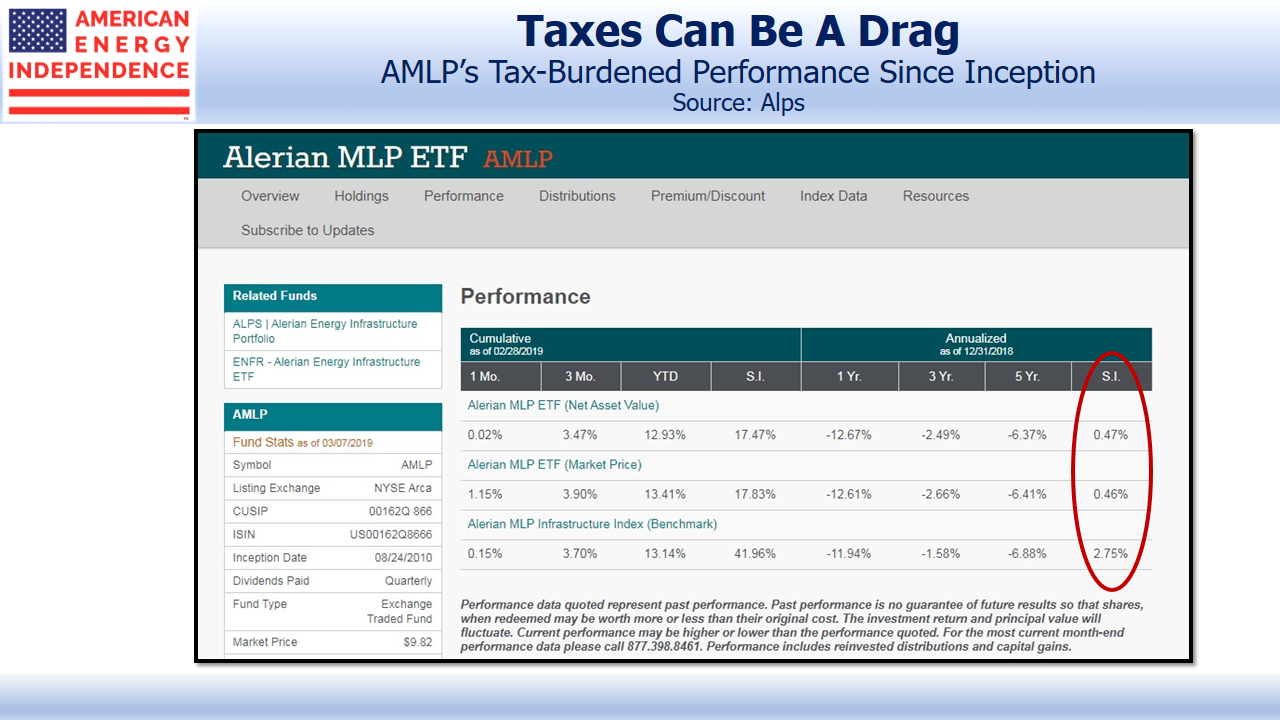
The AEITR’s limit on MLPs also means that funds linked to it aren’t subject to corporate tax. A flawed tax structure has been a substantial drag on performance for MLP-dedicated funds. For example, the Alerian MLP ETF (AMLP) has a since inception return of 0.47% p.a., compared with its index of 2.75%. It’s delivered less than a fifth of its index since 2010, in part because of a structure that requires it to pay corporate tax. Nobody would create such a fund today.

See MLP Funds Made for Uncle Sam for more detail.

.avia-image-container.av-1p853lt-3e6d6657cf0db9a4c2ad78f173316b81 img.avia_image{ box-shadow:none; } .avia-image-container.av-1p853lt-3e6d6657cf0db9a4c2ad78f173316b81 .av-image-caption-overlay-center{ color:#ffffff; }

AMLP's Tax Burdened Performance

The Alerian MLP indices are becoming outdated, because they represent what the pipeline business used to be, before MLPs started converting to corporations. An MLP-only approach to energy infrastructure misses most of the sector. MLPs aren’t going away, they’re just becoming less important.

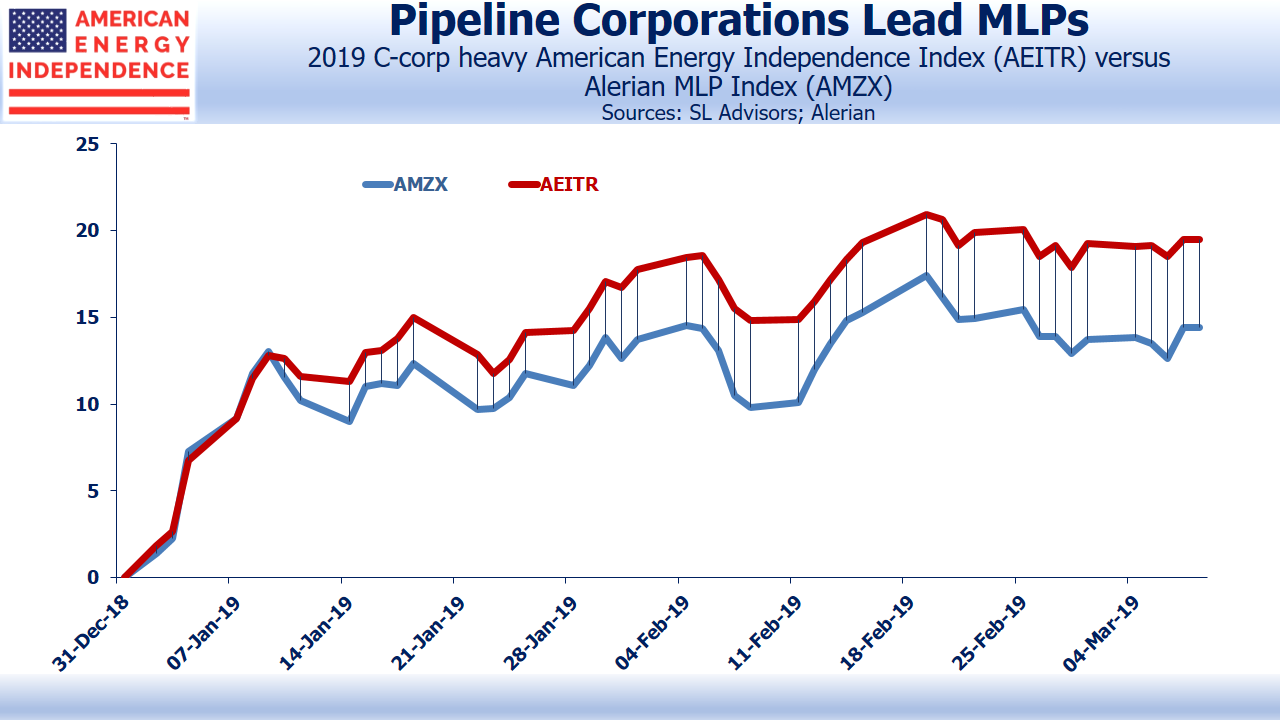
For the former MLPs who converted so as to lower their cost of capital, stock performance shows that these were good decisions. The AEITR’s 80% allocation to corporations makes it more representative than the Alerian MLP Index (AMZX). Performance differences between the two are driven by how corporations are doing relative to MLPs. This year, AEITR is 5% ahead.

.avia-image-container.av-17rb2gx-7ca24e55de06f6f7af6ee858047b0d86 img.avia_image{ box-shadow:none; } .avia-image-container.av-17rb2gx-7ca24e55de06f6f7af6ee858047b0d86 .av-image-caption-overlay-center{ color:#ffffff; }

Pipeline Corporations Outperform MLPs

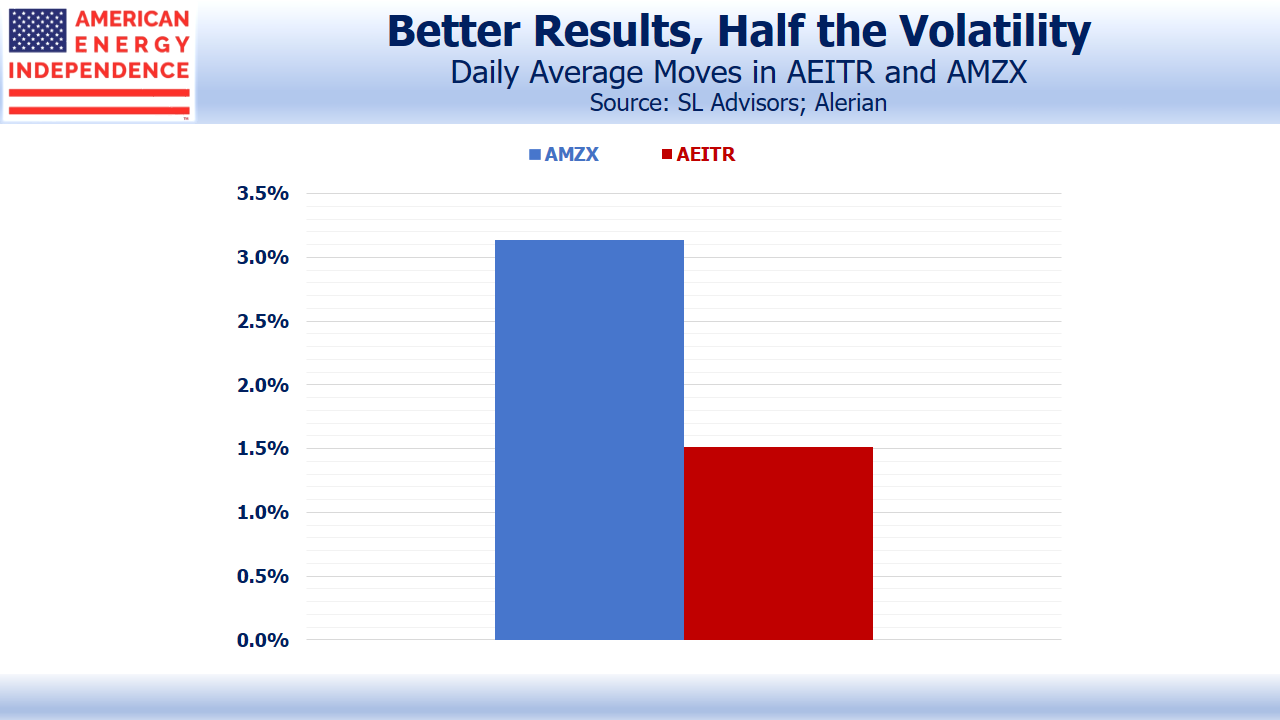
What’s also encouraging is that it’s coming with lower volatility. Since AEITR’s creation in October 2017, it has had average daily moves of 1.5%, half that of AMZX. This makes sense, because the corporations that make up 80% of AEITR have a wider pool of investors. It’s precisely why MLPs have been converting. A more diverse set of buyers means a deeper market, which lowers the risk for investors and thereby lowers the cost of capital for those companies.

.avia-image-container.av-mh26wx-e3a5672ec2e63faac5e9df4eff610507 img.avia_image{ box-shadow:none; } .avia-image-container.av-mh26wx-e3a5672ec2e63faac5e9df4eff610507 .av-image-caption-overlay-center{ color:#ffffff; }

Corporations Are Less Risky vs MLPs

So far, we haven’t heard of a company that regrets its decision to drop the MLP structure in a simplification, and those that remain get questions on every earnings call about their possible plans to simplify. There are some well run, attractive MLPs, including Enterprise Products Partners (EPD), Magellan Midstream Partners (MMP), Energy Transfer LP (ET), Western Gas Partners (WES), and Crestwood Equity Partners (CEQP). But the evidence is mounting that the adoption of a corporate structure and the global investor base that comes with it is beneficial.

We are invested in ENB, EPD, ET, KMI, MMP, OKE, PBA, SEMG, TRGP, TRP, WMB.

We are short AMLP.

SL Advisors is the sub-advisor to the Catalyst MLP & Infrastructure Fund.  To learn more about the Fund, please click here.

SL Advisors is also the advisor to an ETF (USAIETF.com)



MLP-Dedicated Funds See Increasing Redemptions

Fund flows will always beat fundamentals. This was rarely more evident than in the performance of MLPs last year. Throughout 2018, earnings reports from pipeline companies were generally in-line, with positive guidance. Operating results contrasted with stock prices, which confounded investors and management teams as they sagged. Negative sentiment worsened late in the year, not helped by broader market weakness caused by trade friction, Fed communication mis-steps and the Federal government shutdown.

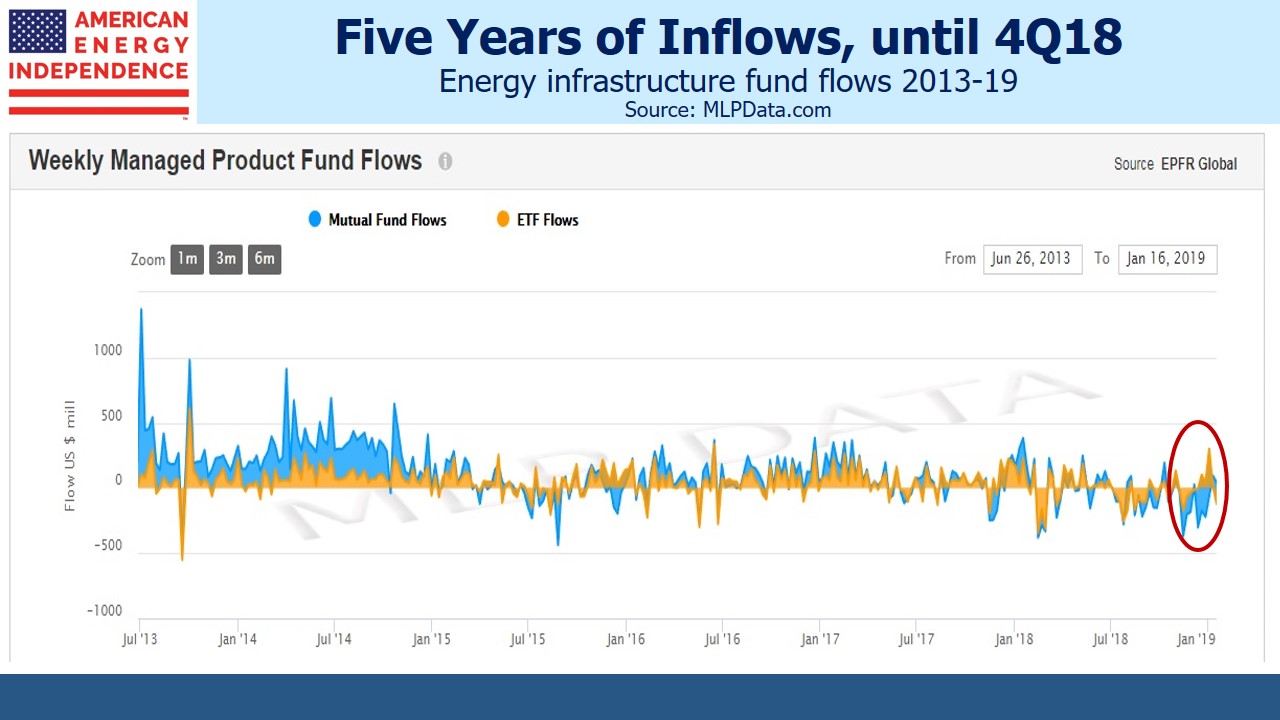
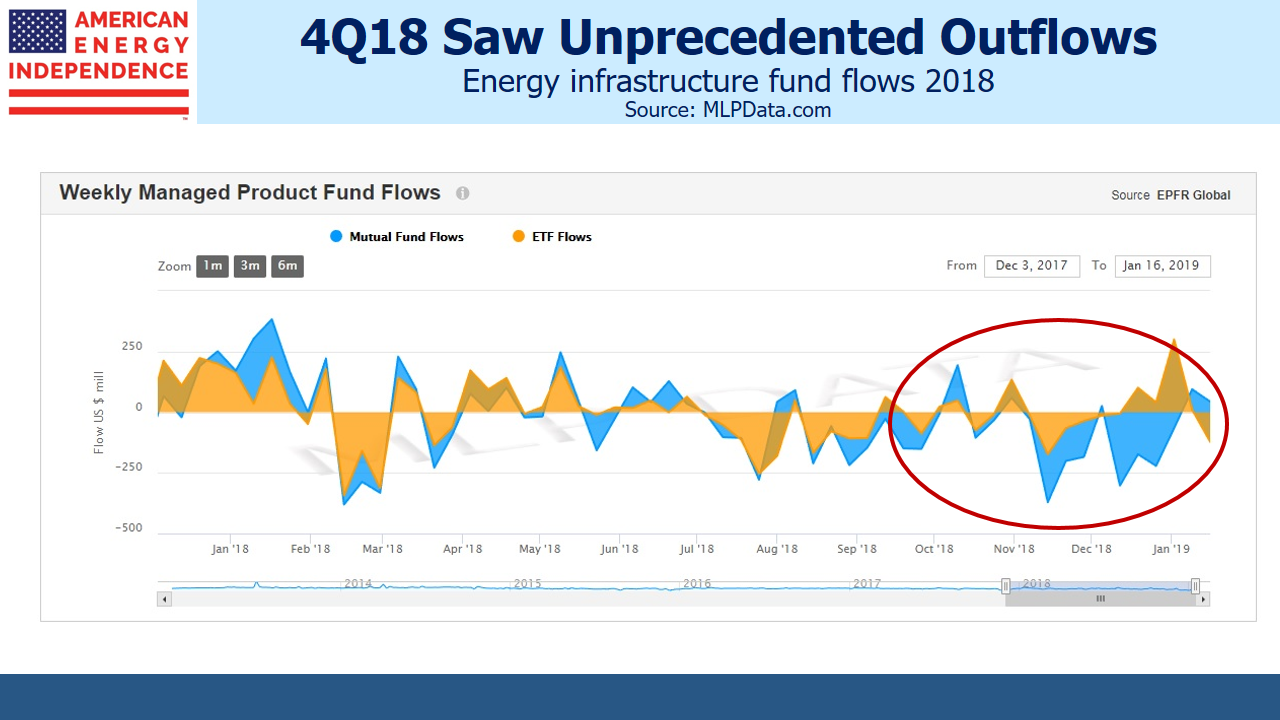
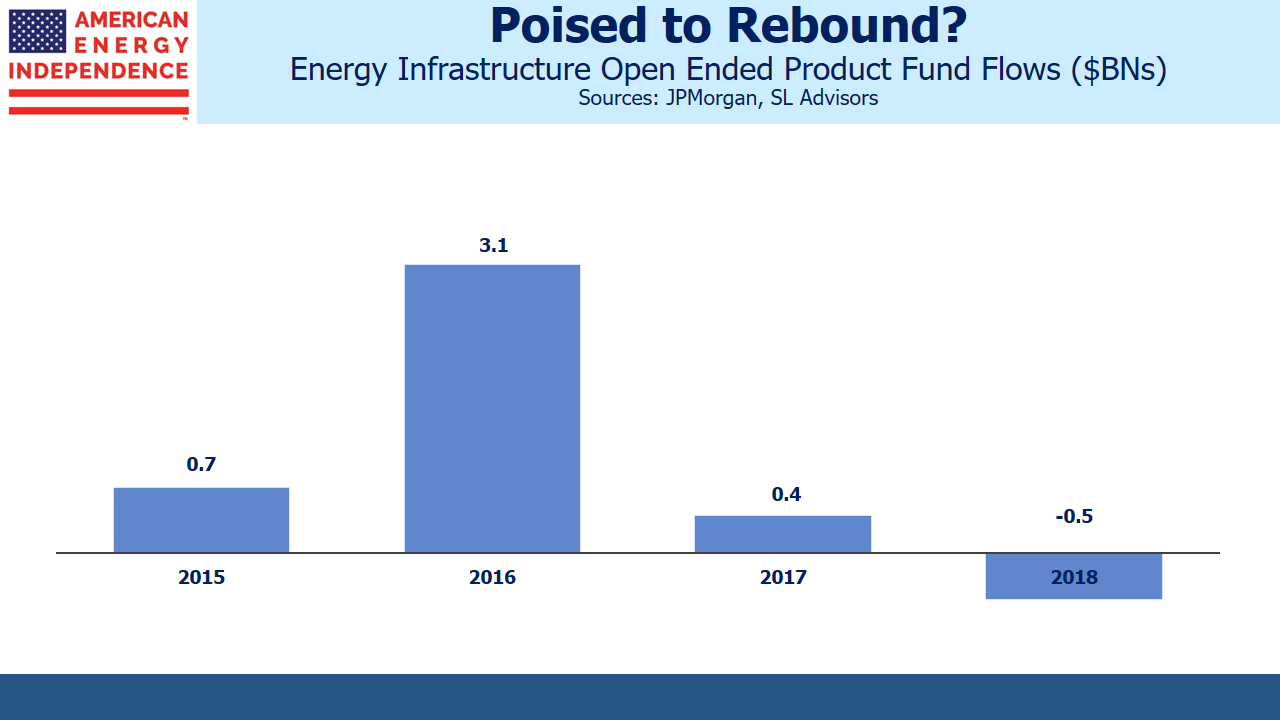
JPMorgan calculates that there is $38BN invested in open-ended MLP and energy infrastructure products, across ETFs, mutual funds and exchange traded notes. In spite of peaking in August 2014, the sector saw inflows during the three subsequent years. This reversed dramatically late last year, as retail investors liquidated holdings. November and December saw $1.9BN in net outflows, enough to depress prices regardless of news.

.avia-image-container.av-tygtya-85cf6151549522e3ef8b31a741f4f945 img.avia_image{ box-shadow:none; } .avia-image-container.av-tygtya-85cf6151549522e3ef8b31a741f4f945 .av-image-caption-overlay-center{ color:#ffffff; }

Energy Infrastructure 5 Years of Inflows

.avia-image-container.av-1mdz402-24509c70cdd110fc7d66e3496f6ea37d img.avia_image{ box-shadow:none; } .avia-image-container.av-1mdz402-24509c70cdd110fc7d66e3496f6ea37d .av-image-caption-overlay-center{ color:#ffffff; }

Energy Infrastructure Q418 Fund Outflows

Looking back over several years, the period looks like a selling climax, with no similar episodes visible.

Conversations with redeeming investors revealed many unwilling sellers. Taking tax losses motivated some, while others confessed to exhaustion with poor stock returns in spite of apparently improving fundamentals. Like all money managers in the sector, we were faced with little choice but to sell on behalf of such clients.

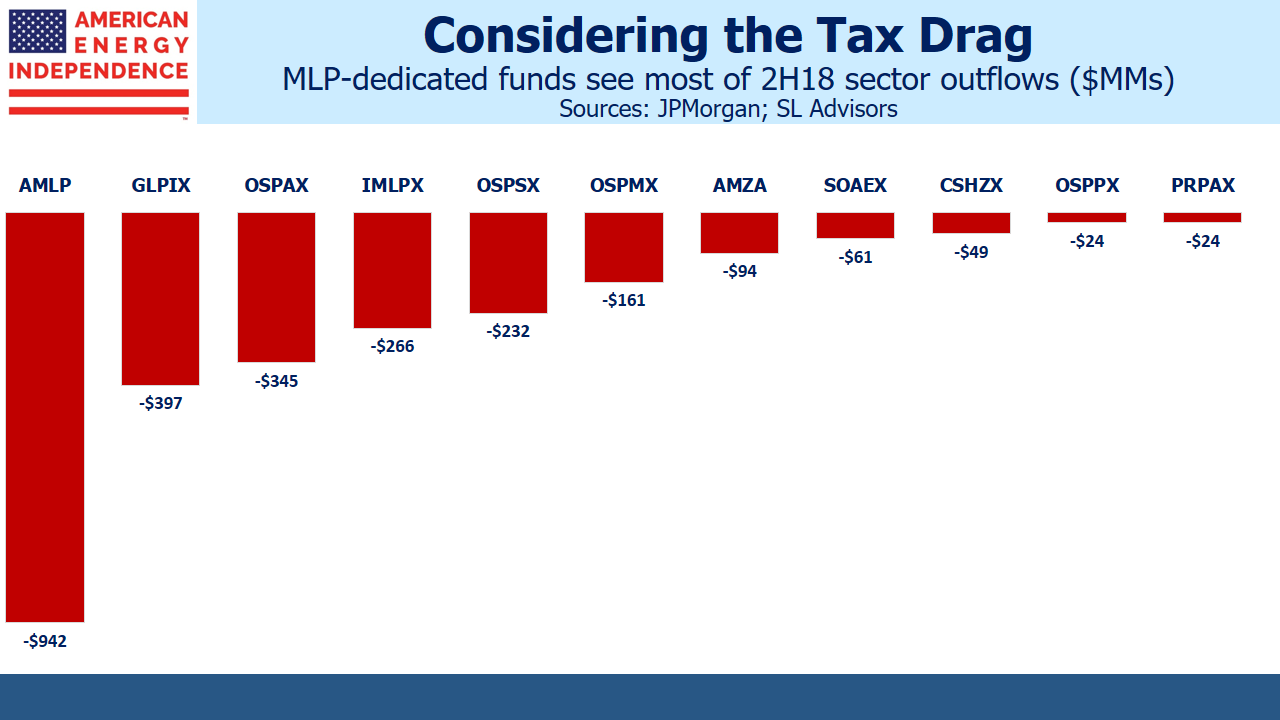
Interestingly, MLP-dedicated funds received a disproportionate share of redemptions. This makes sense, given their flawed tax structure (see MLP Funds Made for Uncle Sam). The drag from paying corporate taxes on profits has been substantial in past years of good performance.

.avia-image-container.av-jgcfnm-fb78523e26d4c3ad803a4eb6d963c340 img.avia_image{ box-shadow:none; } .avia-image-container.av-jgcfnm-fb78523e26d4c3ad803a4eb6d963c340 .av-image-caption-overlay-center{ color:#ffffff; }

MLP Dedicated Fund Outflows

Hinds Howard of CBRE Clarion Securities recently noted that, “MLPs are less than half of the market cap of North American Midstream, and the number of MLPs continues to shrink.  This is ultimately a good thing for those public players that remain, who will achieve greater scale and competitive bargaining power.” Many big pipeline operators are corporations, so an MLP-only focus makes less sense because it omits many of the biggest operators.

Howard went on to add that, “…it has significant ramifications for the asset managers with funds designed specifically to invest in MLPs.” This is because such funds are faced with an unenviable choice between sticking with a shrinking portion of the overall energy infrastructure sector, or dumping most of their MLPs in order to convert to a RIC-compliant status (see The Uncertain Future of MLP-Dedicated Funds). These are additional marketing headwinds on top of last year’s weak returns.

2018 fund flows suggest that investors in MLP-only funds are beginning to realize this problem, and are acting accordingly. The biggest such funds saw $2.6BN in net outflows during 2018’s latter half, 88% of the total, although they only represent 55% of the sector’s funds. Investors redeemed from tax-burdened MLP funds at almost twice the rate of the overall sector.

Many feel the sector is due a good year, and if it is, corporate taxes will lead to correspondingly high expense ratios for MLP-focused funds.

.avia-image-container.av-trdruq-23b629b72a68f31091b1c1193873f042 img.avia_image{ box-shadow:none; } .avia-image-container.av-trdruq-23b629b72a68f31091b1c1193873f042 .av-image-caption-overlay-center{ color:#ffffff; }

Energy Infrastructure Open Ended Fund Flows

Early signs in 2019 are encouraging. The outflows abruptly ended at year-end, and investors we talk to are turning more positive. Strong January performance has helped. From where we sit, inflows dominate and new investor interest has increased sharply. Valuations remain very attractive, with distributable cash flow yields of 11%. We expect dividend growth in the American Energy Independence Index of 7-10% this year and next. Momentum seems to be turning.

We are short AMLP.

SL Advisors is the sub-advisor to the Catalyst MLP & Infrastructure Fund.  To learn more about the Fund,  please click here.

SL Advisors is also the advisor to an ETF (USAIETF.com).


Are Computers Exploiting MLP Investors?

Energy infrastructure roared higher during the first six trading days of January. After four days, the sector had recovered December’s losses. Two days later, it had almost recouped all of 2018. It was a complete reversal of last month, when slumping equity markets dragged pipeline stocks lower.

It’s looking increasingly likely to us that automated trading strategies relying on complex algorithms (“algos”) are at least part of the reason.

Last year MLPs had already been laboring under the weight of serial distribution cuts. For example, AMLP’s payout is down by 34% since 2014. Incidentally, this must be the worst performing passive ETF in history. Since inception in 2010, it has returned 4% compared to its index of 25%. Its tax-impaired structure is part of the reason (see Uncle Sam Helps You Short AMLP).

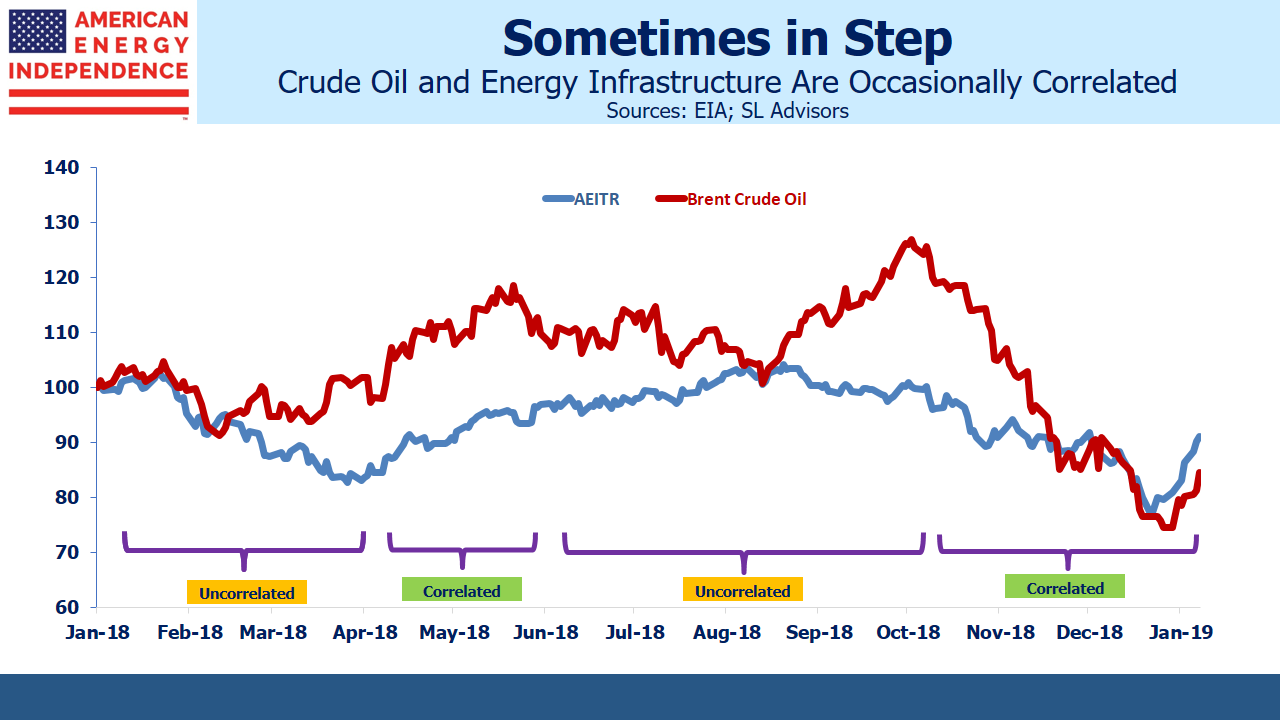
For the first nine months of last year, crude oil and energy infrastructure moved independently of one another. Investors who painfully recall the 2014-16 energy sector collapse complained that rising crude prices didn’t help, but as the chart shows, they rallied together in the Spring but parted company in late Summer as the oil market started to anticipate the re-imposition of sanctions on Iran. Crude and pipeline stocks are intermittently correlated, because their economic relationship is weak. Crude sometimes drives sentiment, which can quickly change.

.avia-image-container.av-k296n6-4193aa4fbf92cc50457513fd14332a0f img.avia_image{ box-shadow:none; } .avia-image-container.av-k296n6-4193aa4fbf92cc50457513fd14332a0f .av-image-caption-overlay-center{ color:#ffffff; }

Energy Infrastructure Sometimes In Step with Crude Oil

However, when crude dropped sharply following the Administration’s waivers allowing most Iranian exports to continue, energy infrastructure followed. Pipeline company management teams routinely show very limited cash flow sensitivity to commodity prices, and 3Q18 earnings reported in October/November were largely at or ahead of expectations. Nonetheless, an algorithm incorporating the 2014-16 history would expect MLPs to follow crude when it drops sharply, and would act accordingly. Trading systems bet on falling MLPs following crude, and sold.

In late December crude reversed, and trading systems at a minimum are closing out short pipeline positions if not going the other way. Hence the blistering early January recovery. The fundamentals were good in December, and remained so in January. Any change was imperceptible.

This is conjecture. It’s impossible to obtain hard data to support or refute this theory of market activity. So consider our perspective as a money manager in the energy infrastructure sector, in daily contact with clients and potential investors discussing the outlook. In December, callers were frustrated. The apparent disconnect between fundamentals and stock prices was confusing, troubling. What were they overlooking? What were we missing? Many held, but some didn’t. Frustrated at losses they couldn’t explain, having lost faith with repeated bullish analysis, the sector saw more outflows than inflows. Potential buyers noted compelling values, but usually were dissuaded by continued sector weakness. Unable to comprehend the inability of good financial performance to boost prices, many opted to wait. Tax loss selling towards the end of the year exacerbated.

The turn of the calendar coincided with a modest bounce in crude oil, as reports surfaced that the Saudis were sharply reducing crude exports to the U.S. Current prices are creating for them a substantial fiscal gap.

Conversations with clients and prospects have completely turned. Now callers want to know if there will be a pullback. Is the rally for real? Flows have also reversed. One day last week inflows to one of our funds outweighed outflows by 100:1. In December there were no buyers. In early January there are no sellers.

I was prompted to consider events in this light by a recent article in the Financial Times (Volatility: how ‘algos’ changed the rhythm of the market). Philosophically, I’m inclined to believe that automated trading simply does what humans do, just better and more cheaply. However, there is a less benign feature in that algos are also exploiting the inefficiences of humans. Michael Lewis showed this in Flash Boys by examining how high frequency trading systems will see market orders placed and race to snatch the best price before the limit order is executed. This happens in fractions of a second. But humans can also be outwitted over longer periods. December saw the biggest ever monthly outflows from mutual funds, capping an unusual year in which almost every market was down.

There was some bad news. The trade dispute with China is slowing growth there, and S&P500 earnings forecasts are being revised lower. The government is shut down. Fed chairman Powell sounded more hawkish before walking back his comments (see Bond Market Looks Past Fed). But these developments scarcely seem to justify record mutual fund outflows. There have been far worse environments for stocks.

Hedge fund veteran Stanley Druckenmiller said, “These ‘algos’ have taken all the rhythm out of the market, and have become extremely confusing to me.” Philip Jabre closed his eponymous hedge fund, complaining, “…the market itself is becoming more difficult to anticipate as traditional participants are imperceptibly replaced by computerized models.”

The Financial Times quoted a senior JPMorgan strategist as saying that, “…we just have to accept that equity markets are almost fully automated.” JPMorgan estimates that only 10% of trading is generated by humans.

The Wall Street Journal reported that trend-following trading systems shifted “…from bullish to bearish to a degree not seen in a decade, according to an analysis of algorithms that buy or sell based on asset-price momentum.”

The WSJ also blamed volatility in commodity markets on computerized trading, citing a report that “…Goldman Sachs attributed the recent volatility to algorithmic traders exerting more influence in the oil market.”

The growth in algorithmic trading seems to be coinciding with a drop in discretionary trading by humans, which probably reflects that computers are beating humans in certain areas.

On one level, algos are designed to exploit human frailties by anticipating them. Perhaps they even cause them. It seems many people had little reason to sell in December beyond fear of losing money. Successful algos by definition attract capital, increasing their ability to move markets and hunt for more inefficiencies. Humans, at least those who adjust their positions too frequently, are becoming prey. One result could have been systematic shorting of pipeline stocks in response to crude’s sharp drop, because it worked in 2014-15. Sector weakness certainly couldn’t be traced back to recent earnings reports. Investors who sold during this time because they tired of losing money added to the downward pressure, reinforcing the trend. This would also have provided confirmation to the algorithms that the signal worked.

Since computerized trading isn’t going away, survival for the rest of us lies in being less sensitive to market moves. Examining fundamentals and staying with a carefully considered strategy that doesn’t rely on the market for constant confirmation of its correctness is the human response to algos.

Energy infrastructure remains attractively valued. Free cash flow yields before growth capex (i.e. Distributable Cash Flow) are over 11%. We estimate dividends will grow on the broadly based American Energy Independence Index this year by mid to high single digits. The long term outlook for the sector remains very good.

We are short AMLP.

SL Advisors is the sub-advisor to the Catalyst MLP & Infrastructure Fund.  To learn more about the Fund,  please click here.

SL Advisors is also the advisor to an ETF (USAIETF.com).


2018 Lessons From The Pipeline Sector

Blog pageviews and comments help us gauge how relevant our topics are. Writing is more enjoyable when readers engage. This blog gets reposted across many websites, including Seeking Alpha and Forbes.com. The feedback from subscribers often leads to a useful dialog and informs later choice of topics. Below are the themes that resonated in 2018.

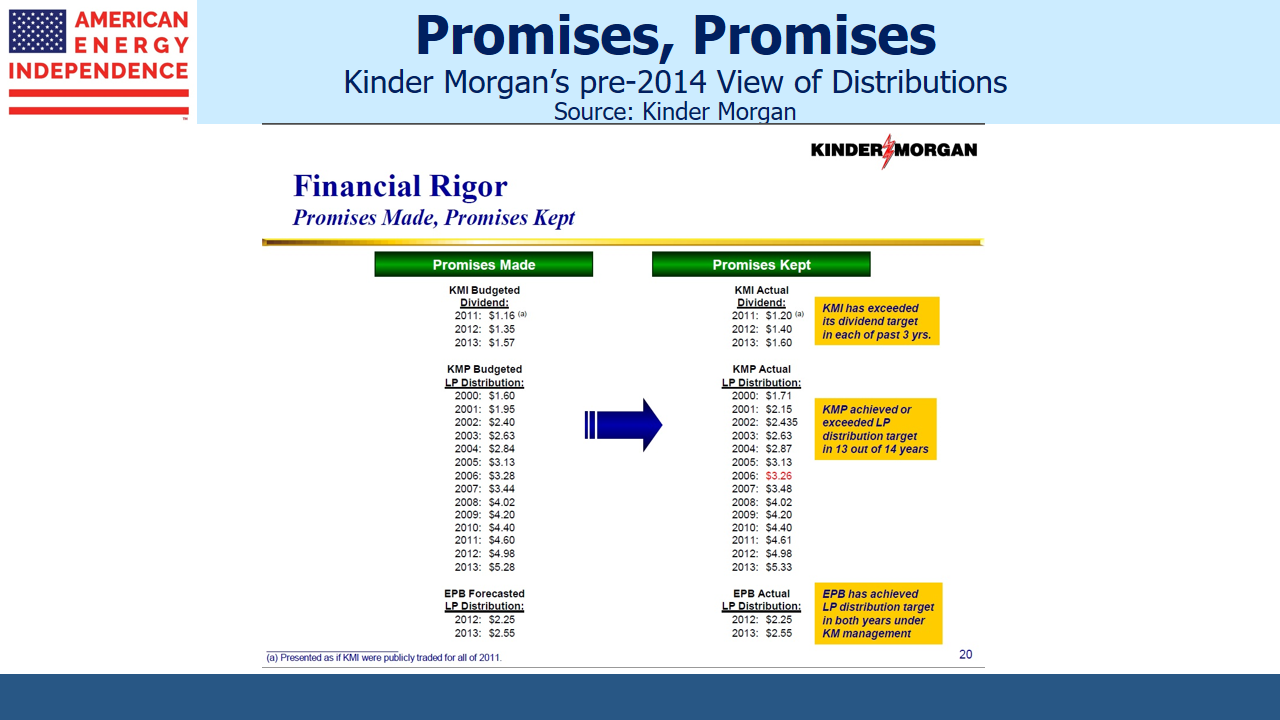
The name Rich Kinder strikes a raw nerve with many. Kinder Morgan: Still Paying For Broken Promises revealed the depth of feeling among many investors. This is because Kinder Morgan (KMI) began the trend towards “simplification”, which came to mean distribution cuts and an adverse tax outcome. To get a sense of the betrayal felt by some, peruse the comments on the blog post on Seeking Alpha where readers can let rip in a mostly un-moderated forum. It becomes clear that cutting payouts has severely damaged appetite for the sector, something we realized through this type of feedback.

.avia-image-container.av-1qp8ygc-a6856f383084f962019965e7ab88f1b5 img.avia_image{ box-shadow:none; } .avia-image-container.av-1qp8ygc-a6856f383084f962019965e7ab88f1b5 .av-image-caption-overlay-center{ color:#ffffff; }

KMI Promises Made Promises Kept

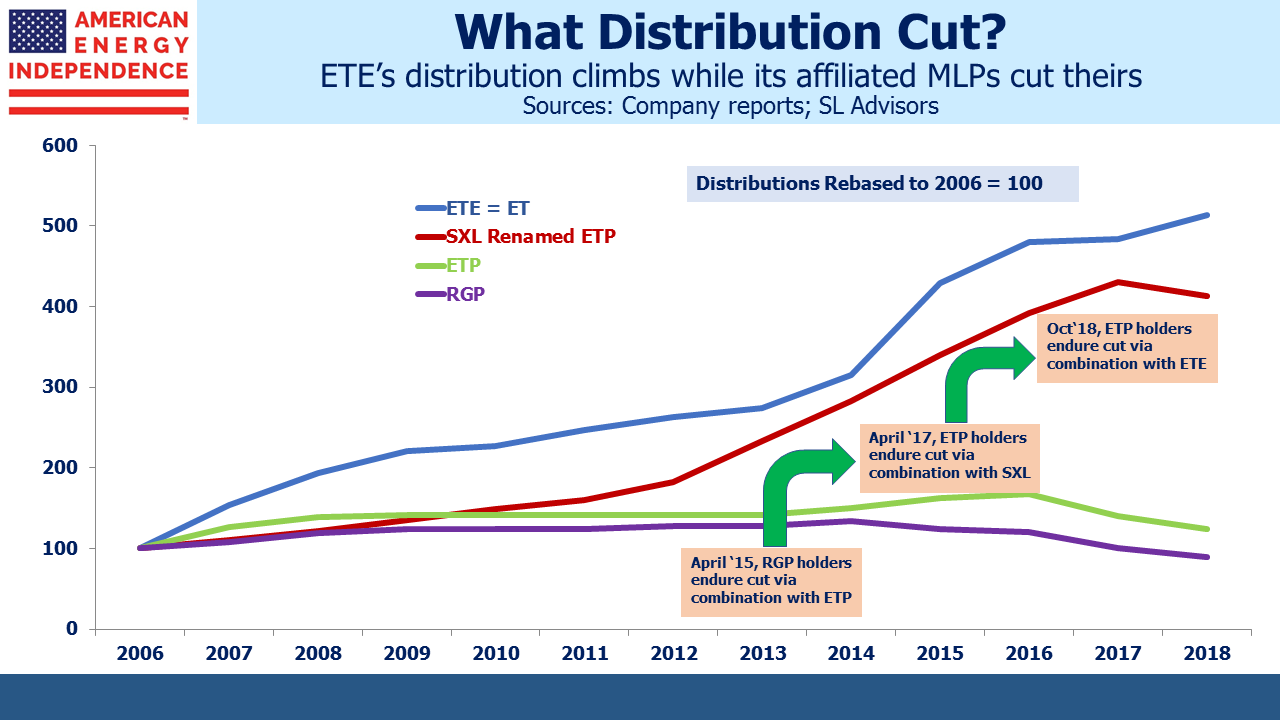
A similar post examined how Energy Transfer (ET) had lowered payouts for certain classes of investor, (see Energy Transfer: Cutting Your Payout Not Mine) and drew an even bigger response (272 comments). ET CEO Kelcy Warren is a controversial figure. Our post showed that while original Energy Transfer Equity investors had avoided distribution cuts, holders of Energy Transfer Partners, Sunoco Logistics and Regency Partners hadn’t fared so well.

.avia-image-container.av-136szpo-4ef3a2cfe95c69cc18393ee57193ef6e img.avia_image{ box-shadow:none; } .avia-image-container.av-136szpo-4ef3a2cfe95c69cc18393ee57193ef6e .av-image-caption-overlay-center{ color:#ffffff; }

ETEs Distributions Climb While its Affiliate MLPs Decline

Kelcy Warren inspired our most colorful graphic in August, when he said, “A monkey could make money in this business right now.” (see Running Pipelines Is Easy). ET’s stock has lost a quarter of its value since then, even though their financial performance has justified his comments.

Last year was a testing one for those convinced the Shale Revolution should generate investment profits. In Valuing MLPs Privately; Enterprise Products Partners we laid out how a private equity investor might value the biggest publicly traded MLP. It wasn’t controversial, but many readers communicated their appreciation at this type of analysis.

The problem for the sector has always been balancing high cash distributions with financing growth projects. We think current valuations focus too much on Free Cash Flow (FCF) without giving credit to Distributable Cash Flow (DCF). FCF is after growth capex, while DCF is before. We illustrated this with a short video (see Valuing Pipelines Like Real Estate).

Early in the year we wrote several blog posts highlighting the tax drag faced by most MLP-dedicated funds. Because they pay Federal corporate taxes on investment profits, 2018’s bear market didn’t expose their flawed structure the way a bull market will. We won’t repeat the argument here, but it’s laid out in MLP Funds Made for Uncle Sam.

A related topic we covered several times was the conundrum facing MLP-only funds, given that many big MLPs have converted to regular corporations. MLP-only funds can no longer claim to provide broad sector exposure, since they omit most of the biggest North American pipeline companies. But the funds themselves can’t easily broaden their holdings beyond MLPs, which creates some uncertainty for their investors. We explained why in Are MLPs Going Away? and The Alerian Problem.

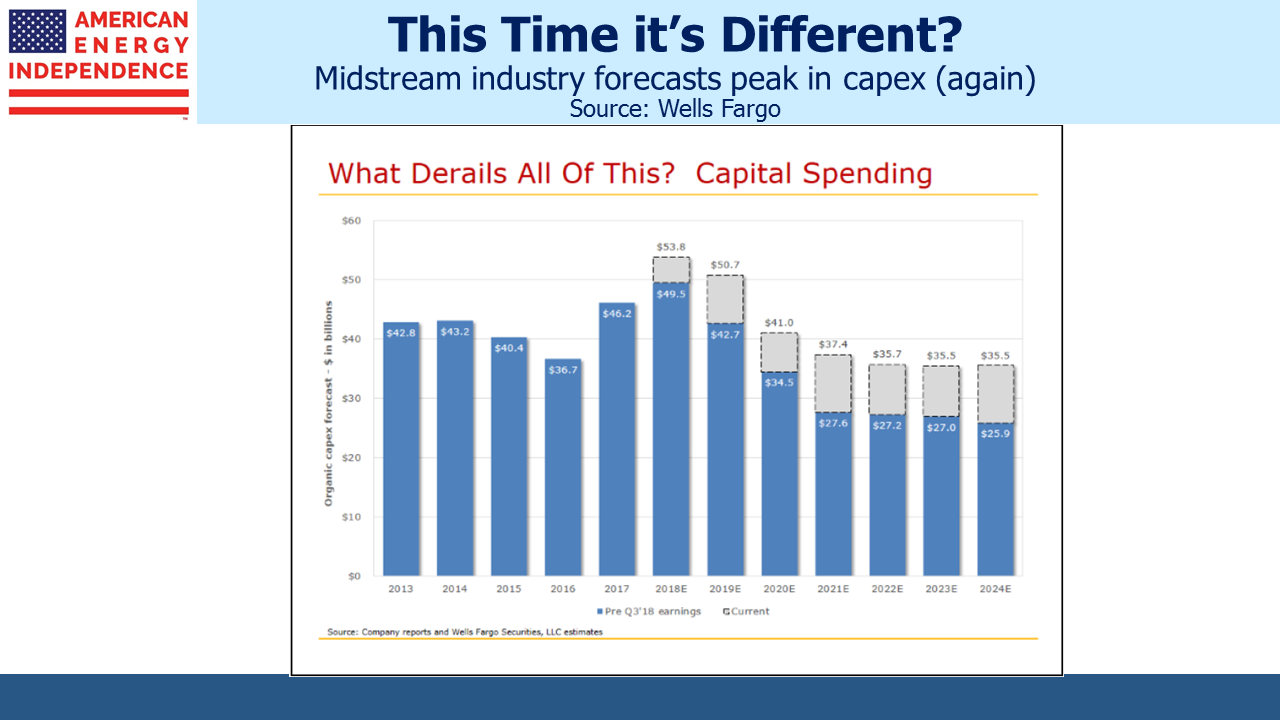
We returned to the tension between using cash for growth versus distributions in Buybacks: Why Pipeline Companies Should Invest in Themselves. The industry continues to reinvest more cash in new infrastructure than is justified by stock prices. In many cases, share repurchases offer a better and more certain return than a new pipeline. Trade journals are full of breathless commentary on the need for more export facilities, more pipelines, more everything. It’s not pleasant reading for an investor, but this is the world inhabited by industry executives. More mention of IRR would be welcome. Pipeline investors are hoping that the Wells Fargo chart showing lower capex in the future will, finally, be accurate.

.avia-image-container.av-s1846k-0e9f9240a8388565f3b45da13c42805d img.avia_image{ box-shadow:none; } .avia-image-container.av-s1846k-0e9f9240a8388565f3b45da13c42805d .av-image-caption-overlay-center{ color:#ffffff; }

Midstream Industry Forecasts Peak in CAPEX

Fortunately, there are signs of better financial discipline. Leverage continues to drop and dividend coverage is improving, which will support a 6-8% increase in dividends on the American Energy Independence Index in 2019. As the year unfolds, we expect investors to cheer a long overdue improvement in returns.

We are invested in ET and KMI.

SL Advisors is the sub-advisor to the Catalyst MLP & Infrastructure Fund.  To learn more about the Fund,  please click here.

SL Advisors is also the advisor to an ETF (USAIETF.com).


Another MLP Jumps Ship

Last week Antero Midstream (AM) became the latest MLP to simplify their structure. This is further evidence of the declining opportunity set for MLP-dedicated funds, and cause for investors to seek exposure to energy infrastructure that goes beyond MLPs to include corporations (see The Uncertain Future of MLP-Dedicated Funds).

Like many MLPs before them, Antero is becoming a corporation. Broader institutional ownership and enhanced trading liquidity were cited as the reasons.

The benefits of being an MLP persist – our friend and regular commenter Elliot Miller would note that the tax benefits remain significant: MLPs don’t pay Federal corporate income tax, leaving more money available for distributions. And those distributions are largely tax deferred, with the possibility of being tax-free to one’s heirs given thoughtful estate planning.

Nonetheless, Antero concluded that the MLP structure no longer suited them. They joined a long list of companies who’ve reached the same conclusion, including Kinder Morgan (KMI), Targa Resources (TRGP), Semgroup (SEMG), Oneok (OKE), Archrock (AROC), Williams (WMB), Dominion (D) and Enbridge (ENB). Tallgrass (TGE) has retained the partnership structure for governance but chosen to be taxed as a corporation, and Plains All American offers a option for both 1099 (PAGP) and K-1 tolerant (PAA) investors.

They’ve all found that MLP investors are too few and fickle to be a reliable source of equity capital. Tax impediments add cost and complexity to tax-exempt and non-U.S. institutions, a substantial portion of the investor base for U.S. public equities. The K-1s are how investors achieve the tax benefits noted above, but their complexity dissuades most retail investors. Once you eliminate these different classes of investor, almost the only buyers left are taxable, high net worth individuals. In other words, older, wealthy Americans.

These investors like their income, and the several dozen distribution cuts imposed in recent years have done irreparable harm. The high payout ratios of MLPs left little cash for funding growth projects (see It’s the Distributions, Stupid!). This wasn’t a problem until the Shale Revolution created the need for investments in new infrastructure, to support the huge increases in U.S. oil and gas output. Cash was duly diverted from payouts to growth projects, leading to a 30% drop in distributions (see Will MLP Distribution Cuts Pay Off?).

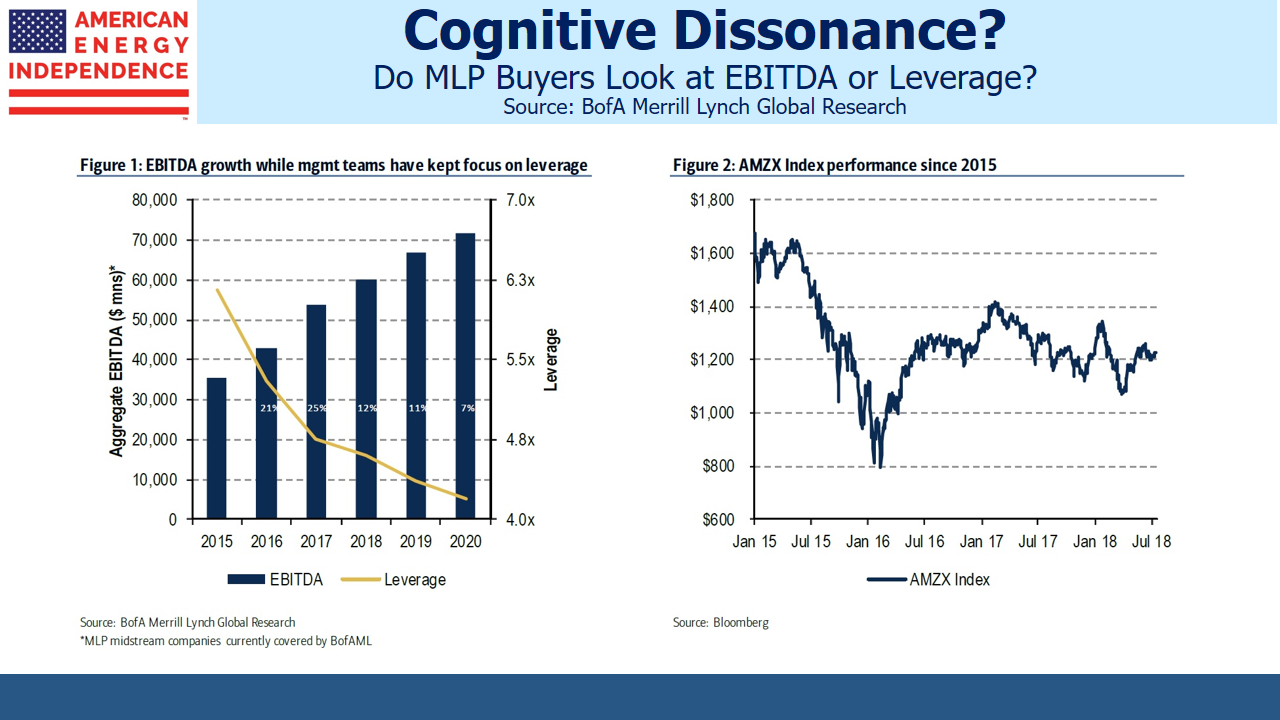
EBITDA improved and leverage came down, but MLP investors only care about distributions, which were cut by 30%. Consequently, the sector fell hard and is still 30% below its 2014 peak.

.avia-image-container.av-tn1ajr-227a1b8488c57994041e22f8ffacce11 img.avia_image{ box-shadow:none; } .avia-image-container.av-tn1ajr-227a1b8488c57994041e22f8ffacce11 .av-image-caption-overlay-center{ color:#ffffff; }

MLP Investors EBITDA v Leverage

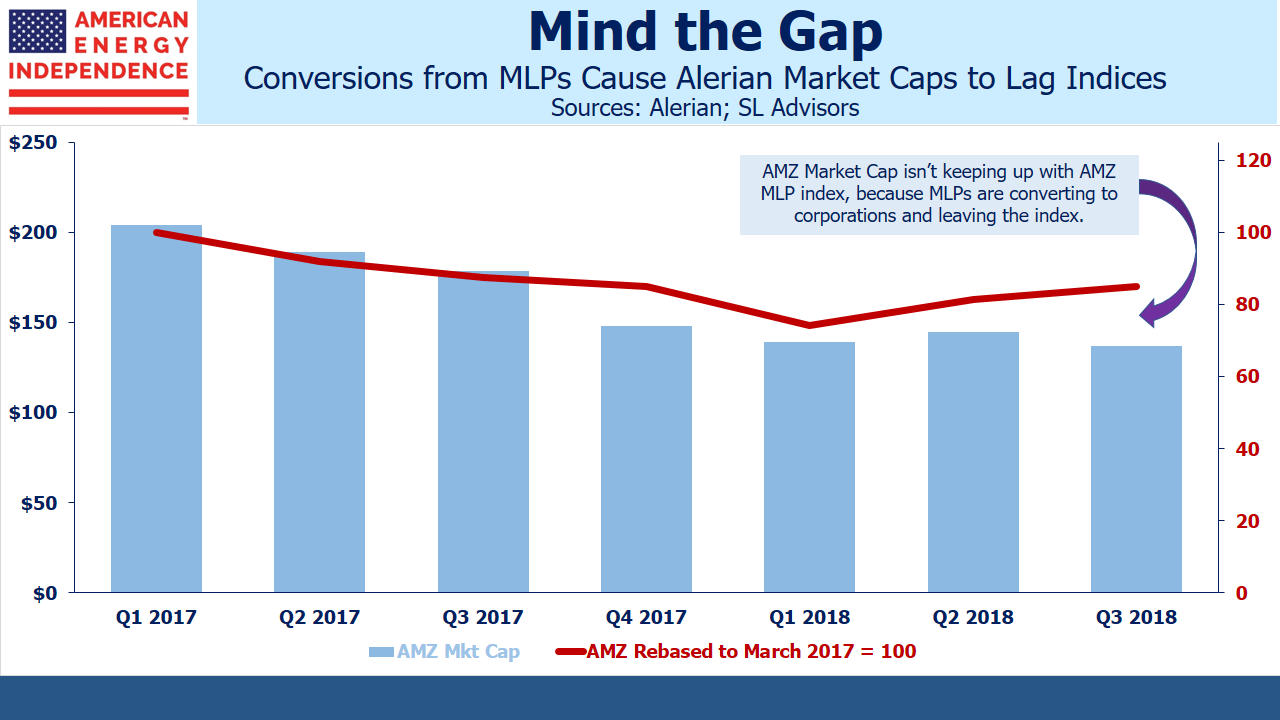
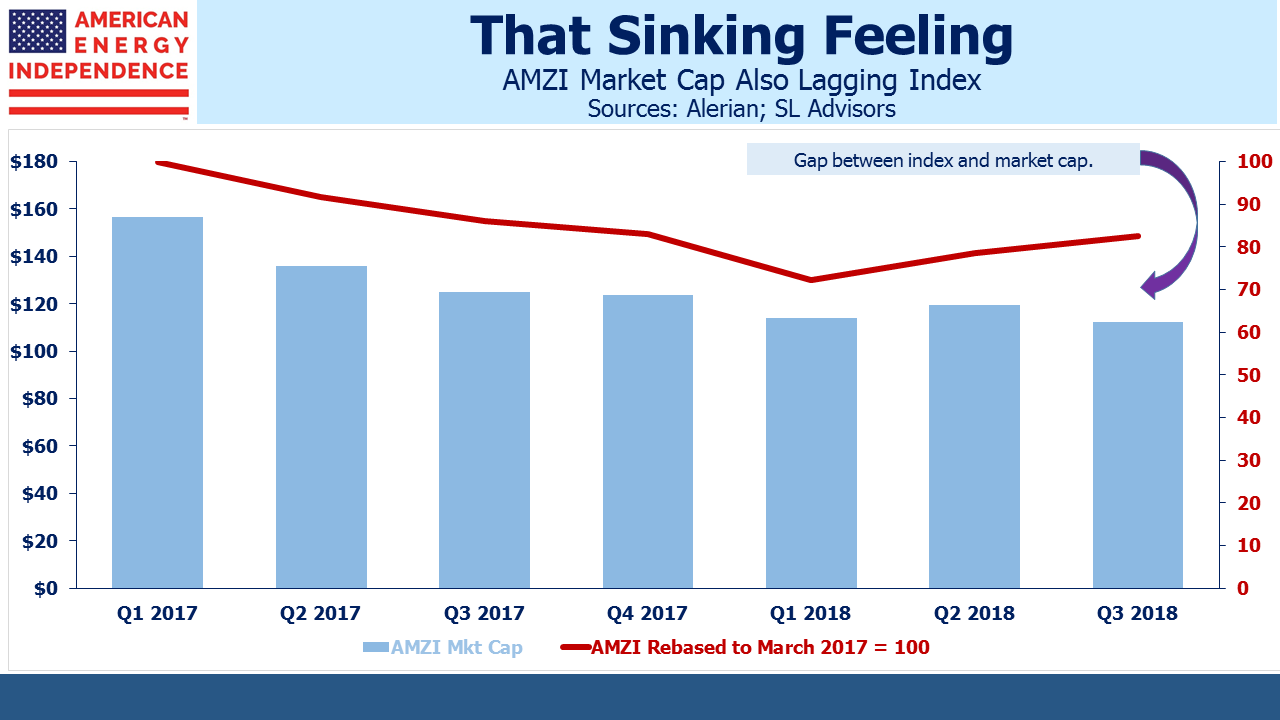
MLP-dedicated funds are left with fewer, smaller fish to catch. Their promoters still defend them, in spite of their flawed structure rendering them taxable with correspondingly eye-watering expenses (see MLP Funds Made for Uncle Sam). As pipeline companies continue to abandon the MLP structure, it’s showing up in the sinking market cap of the MLP indices. The market cap of both the Alerian MLP Index (AMZ) and the Alerian MLP Infrastructure Index (AMZI) are decreasing even while the sector is up this year.

It’s stark evidence of the declining role MLPs play in U.S.energy infrastructure. Affected ETFs include those from Alerian (AMLP) and InfraCap (AMZA). Mutual funds from Oppenheimer Steelpath, Centercoast, Mainstay Cushing and Goldman Sachs are similarly stuck with a declining opportunity set.

.avia-image-container.av-1cjwlyf-463599b942cecc50c43e2cf42691f36f img.avia_image{ box-shadow:none; } .avia-image-container.av-1cjwlyf-463599b942cecc50c43e2cf42691f36f .av-image-caption-overlay-center{ color:#ffffff; }

MLPs convert to Corporations

.avia-image-container.av-nvo0jr-ec7fee123908019d5af42af7c03d6c51 img.avia_image{ box-shadow:none; } .avia-image-container.av-nvo0jr-ec7fee123908019d5af42af7c03d6c51 .av-image-caption-overlay-center{ color:#ffffff; }

These MLP-dedicated funds can’t easily change their structure to avoid taxes by becoming RIC-compliant – they’d have to sell 75% of their MLPs, which is prohibitively disruptive. Some smaller funds whose MLP sales weren’t market moving have done so, which shows that others would if they could. Instead, MLP fund proponents are left to argue that their fund structure is optimal, even though no new MLP-dedicated funds are being launched any more.

Some big MLPs are happy enough. Enterprise Products (EPD), Magellan Midstream (MMP) and Energy Transfer (ETE) are all sticking with the structure. It works best if you don’t need external financing. We are invested in all three companies through our funds and separately managed account strategies.

MLPs can still be good. An MLP-only approach is not. MLP-dedicated funds are the worst place to be, given the shrinking MLP market cap and tax burden. But broad energy infrastructure, growing as we pursue American Energy Independence, is cheap.

We are long AMGP, AROC, ENB, EPD, ETE, KMI, OKE, MMP, PAGP, SEMG, TGE, TRGP, WMB. We are short AMLP.


Pipeline Stocks Chart a Higher Path

Technical analysis shows that the outlook for pipeline stocks is bullish.

We rarely write on technicals, since we’re relentlessly focused on the fundamentals. But fundamental news has been light, with prices drifting irregularly lower. Investors are overwhelmingly frustrated with the failure of pipeline company stocks to reflect growing throughput volumes. The U.S. just claimed World’s Biggest Oil Producer (see America Seizes Oil Throne). Liquified Natural Gas exports are set to more than double next year (see U.S. Oil and Gas Exports: A New Weapon). In willful defiance, pipeline stocks sagged. One sell-side analyst described recent investor meetings as, “at times blurred between market discussions and therapy sessions.”

For a chartist relying on technical analysis, we think the sector is setting up for a sustained rally. We don’t make investment decisions based on charts. As a visual price history they are helpful, but our portfolio adjustments are driven by shifts in long term fundamentals. However, many investors use technical analysis as a timing aid. Some pore over charts carefully before making decisions. Absent much market-moving news, such analysis is more relevant.

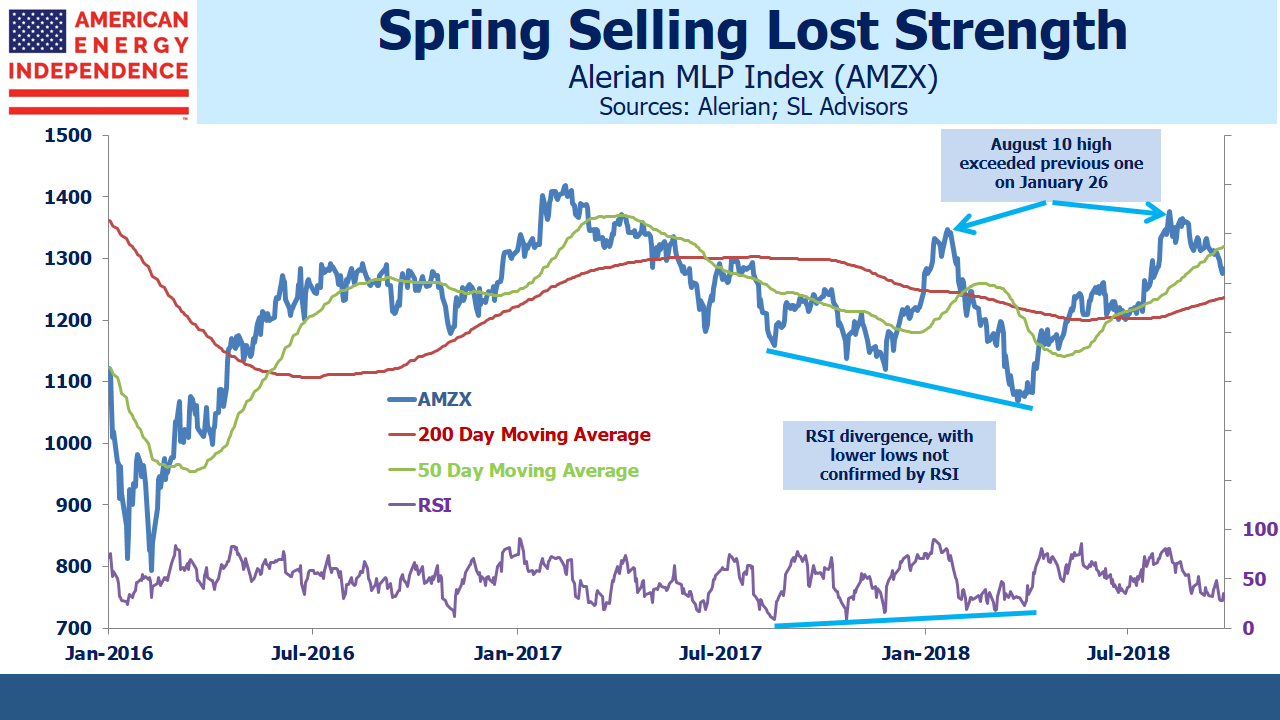
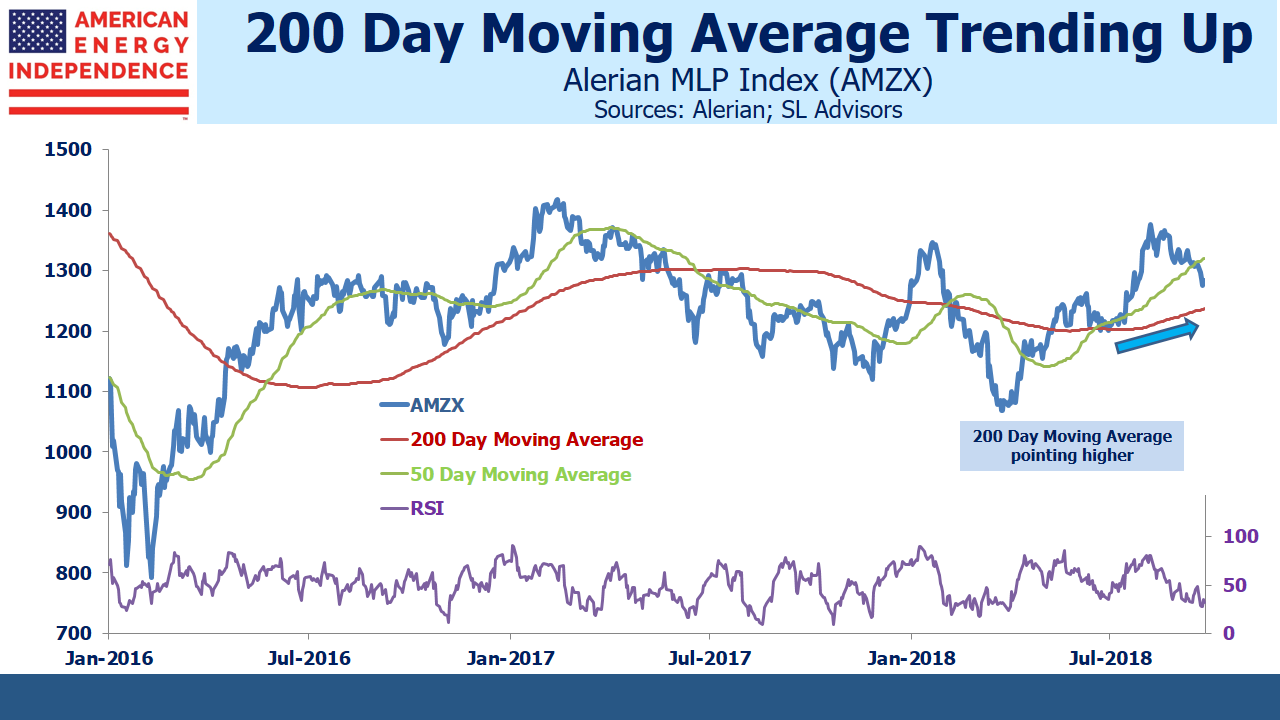
Energy infrastructure charts show three bullish patterns. The first is that the sequence of lower lows from late last year into Spring was not confirmed by the Relative Strength Index (RSI) readings. This type of divergence typically indicates weaker conviction among sellers on each successive dip, warning of a change in trend. Sure enough, the recent August high exceeded the prior one in February, revealing that a new uptrend has begun.

.avia-image-container.av-1z8zwhb-e8bf9da160ba2d68482d151aa1085eae img.avia_image{ box-shadow:none; } .avia-image-container.av-1z8zwhb-e8bf9da160ba2d68482d151aa1085eae .av-image-caption-overlay-center{ color:#ffffff; }

Pipeline Stocks Chart Higher

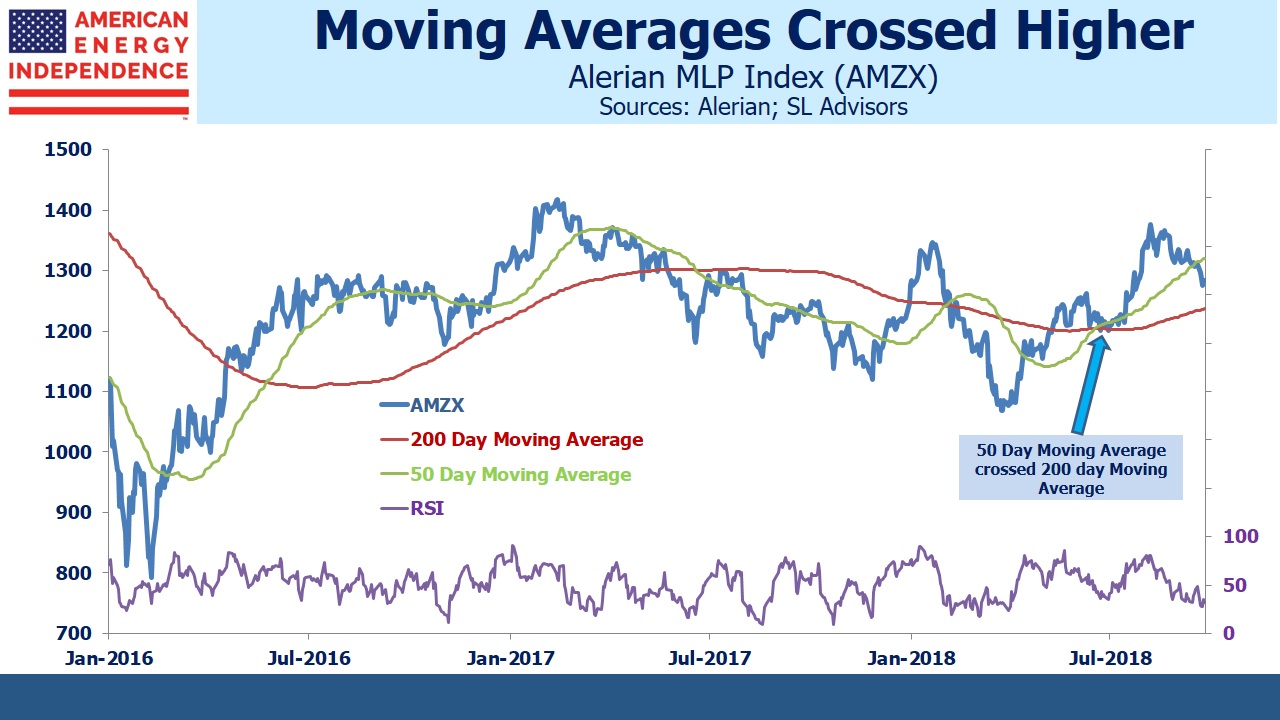
Supporting this, in June the 50 day moving average convincingly crossed the 200 day moving average, following which the sector moved smartly higher.

.avia-image-container.av-1ksn1rj-4575e5846931d5447f294547103edfc5 img.avia_image{ box-shadow:none; } .avia-image-container.av-1ksn1rj-4575e5846931d5447f294547103edfc5 .av-image-caption-overlay-center{ color:#ffffff; }

Further confirmation is provided by the clear upturn in the 200 day moving average.

.avia-image-container.av-11y3bm7-c73aeca88e6da15528397b6e913d5fe3 img.avia_image{ box-shadow:none; } .avia-image-container.av-11y3bm7-c73aeca88e6da15528397b6e913d5fe3 .av-image-caption-overlay-center{ color:#ffffff; }

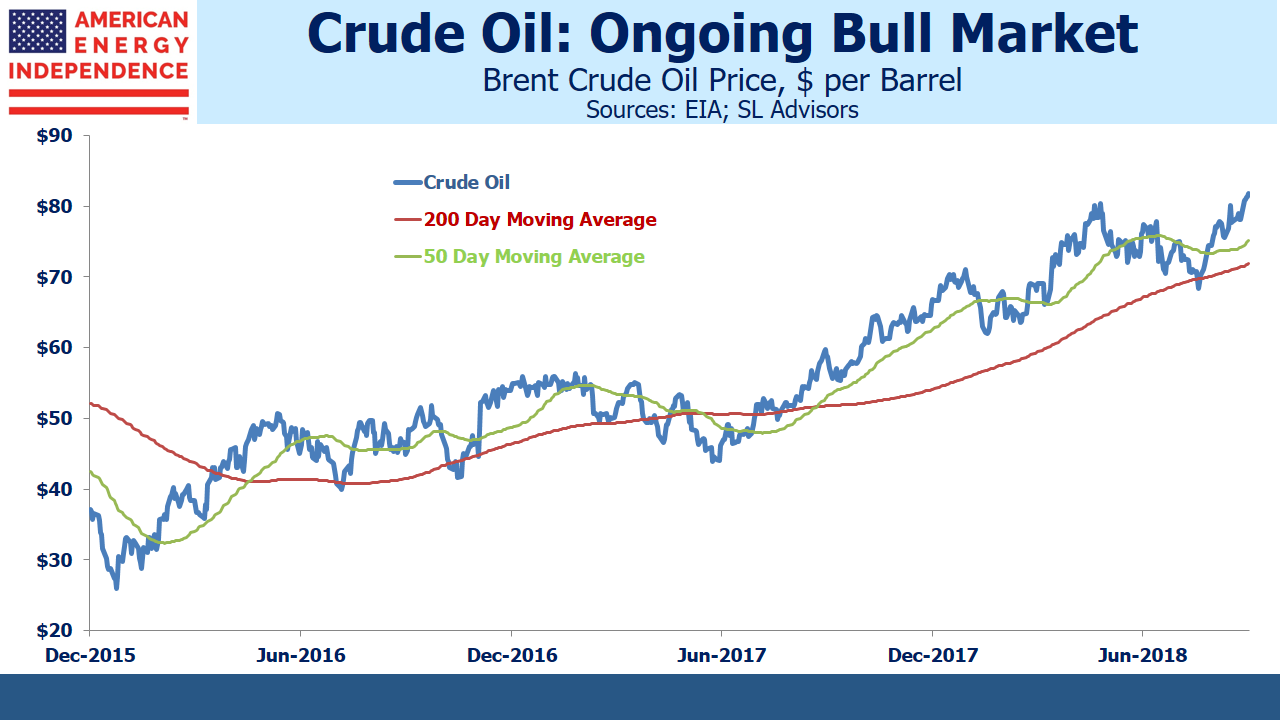
This all points to a sector in which medium term (i.e. 3-12 months) momentum is turning up, with the recent softness not that material over a longer perspective. Crude oil technical analysis shows a bull market many months old, adding to the frustration of  investors in pipeline stocks who feel the two are only correlated on the downside.

.avia-image-container.av-nyabin-e13a753134b132e4b4aeab7995811a26 img.avia_image{ box-shadow:none; } .avia-image-container.av-nyabin-e13a753134b132e4b4aeab7995811a26 .av-image-caption-overlay-center{ color:#ffffff; }

Nonetheless, the sector has been weak. It might be in part because the Alerian MLP ETF (AMLP) has experienced steady outflows since June. Its shares outstanding have dropped by 8% in spite of the fact that 2Q18 earnings were generally good. Some of this is probably due to growing awareness of its flawed tax structure (see Uncle Sam Helps You Short AMLP) and shrinking pool of MLPs (see The Uncertain Future of MLP-Dedicated Funds). One reader on Seeking Alpha described it as “obsolete and tax inefficient”.

Oil and gas volumes continue to grow, which augurs well for the next earnings reports in October. Examples of infrastructure shortages abound. Natural gas at the Waha hub in west Texas trades at $0.82 per thousand cubic feet, a steep discount to the $3 Henry Hub benchmark because gas production exceeds pipeline capacity. Gas is being flared in the Permian basin.

Crude oil in Midland, TX trades at a $12 per barrel discount to Cushing, OK (the delivery point for CME futures). This similarly reflects a shortage of pipeline capacity, since tariffs on long term contracts are around $3-$5. The 2015 collapse was due to fears of pipeline overcapacity, so today’s bottlenecks ought to be positive.

Proposition 112 is the Colorado referendum question that would greatly impede future oil and gas development.  Fear of it passing in November has weighed on affected stocks, such as Noble Midstream (NBLX) and Western Gas (WES). But there’s no indication that other states are considering similar moves, so its impact is limited to those with significant Colorado exposure.

We expect solid 3Q18 earnings, which will support 10% dividend growth across the sector.  This might well provide the fundamental impetus needed for pipeline stocks to rally. When that happens, technical analysts can point to chart patterns that predicted it.

We are invested in Western Gas Equity Partners (General Partner of WES), and are short AMLP.


America Seizes Oil Throne

.avia-image-container.av-jbvntp-196b46f32cd5b11fab81c82ca0903508 img.avia_image{ box-shadow:none; } .avia-image-container.av-jbvntp-196b46f32cd5b11fab81c82ca0903508 .av-image-caption-overlay-center{ color:#ffffff; }

Last week the U.S. became the world’s biggest crude oil producer. Not everyone agrees – Russian production figures still show them ahead. But the Energy Information Administration (EIA) is confident that we are, and that we’re going to stay there at least through next year.

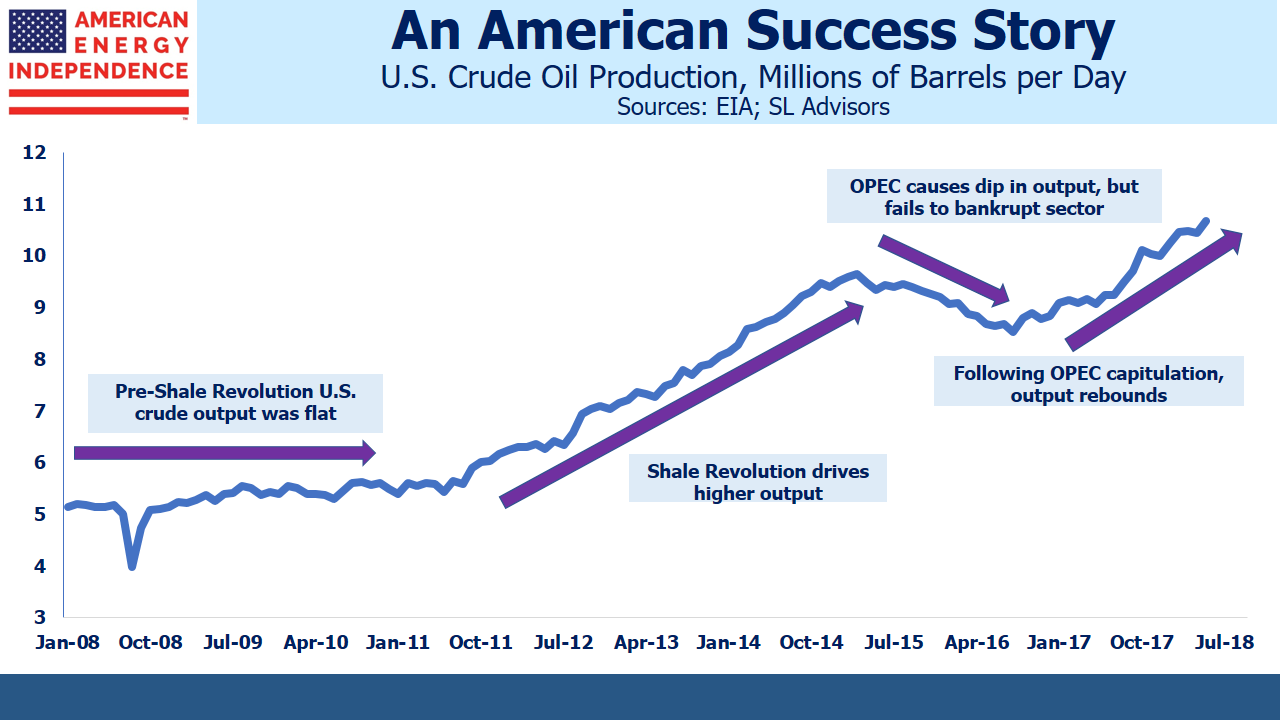
This represents a milestone in the path towards American Energy Independence. Only 10 years ago, U.S. output was 5 Million Barrels per Day (MMB/D) and was in decline. Today it’s reached 11MMB/D and is growing rapidly.  Horizontal drilling and hydraulic fracturing unlocked the huge reserves in shale formations, and the decline was arrested. Over the next several years U.S. output grew sufficiently to more than meet global demand growth.

.avia-image-container.av-lk4w65-1d3bd50c5fd649712f7fac4beba03c8a img.avia_image{ box-shadow:none; } .avia-image-container.av-lk4w65-1d3bd50c5fd649712f7fac4beba03c8a .av-image-caption-overlay-center{ color:#ffffff; }

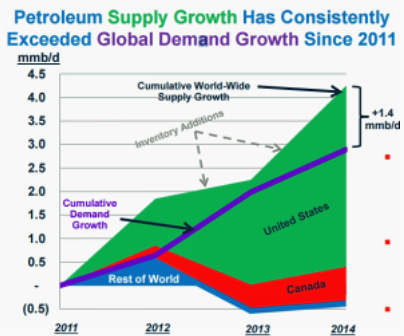
In 2014 Plains All American (PAGP) produced a powerful chart showing how North American crude was gaining market share. OPEC finally tired of their commensurate lost share which they believed was hurting their revenues. The subsequent 2014-16 energy sector collapse was OPEC’s attempt to bankrupt America’s nascent shale industry, to blunt the growth of this new oil producer. Although the financial pain was widespread, the industry didn’t break. American capitalism responded – costs were slashed, productivity enhanced and a leaner, stronger shale industry emerged.

.avia-image-container.av-18o1vr1-162ec25ba4cd387aea4b5b47584066f7 img.avia_image{ box-shadow:none; } .avia-image-container.av-18o1vr1-162ec25ba4cd387aea4b5b47584066f7 .av-image-caption-overlay-center{ color:#ffffff; }

OPEC relented (see OPEC Blinks), concluding low prices were damaging their members more than the shale upstarts. U.S. production began rising again. It passed its 2014 high last year, and last week took the world’s top oil producer spot, well ahead of many forecasts.

It’s an epic story, with significant consequences across geopolitics, trade and the environment. America’s improved energy security is underwriting a more robust approach to Iran. In the 1970s, support for Israel in its wars against Arab states led to gas lines as OPEC’s flexed its muscle and imposed an oil embargo.

American exports of Liquified Natural Gas (LNG) are creating new trade opportunities with Asia, where South Korea, China and Japan are among our biggest buyers. In spite of the escalating tariffs with China, they recently exempted U.S. crude oil imports from a list of items subject to new tariffs. Germany’s plan to buy more natural gas from Russia via Nord Stream 2 is more easily criticized when U.S. LNG is available. Trump’s tweet, “What good is NATO if Germany is paying Russia billions of dollars for gas and energy?” is hard to fault.

American Shale gas has contributed to the world’s biggest reduction in CO2 emissions (see Guess Who’s Most Effective at Combating Global Warming). It’s made possible the shift from coal to natural gas in electricity generation. The Shale Revolution has been positive in so many ways.

Although few stop to think about it, the Shale Revolution reflects the success of American capitalism. Oil and gas originate in porous rock all over the world, but it’s taken a unique combination of advantages for the U.S. to emerge as virtually the only shale player on the planet. In America Is Great! we list the many attributes whose presence was necessary, such as a skilled energy sector labor force, existing infrastructure, access to capital, advanced technology and so on. Apart from the geology, they’re all the results of America’s capitalist system. The least appreciated is privately-owned mineral rights. All over the world, an individual’s property ownership is limited to the surface, with the government owning what’s beneath. By contrast, American landowners have been able to profit from their mineral rights. This has created private sector wealth in a way that a government claiming eminent domain of a lucrative property never could.

All this means that the Shale Revolution was not luck; if it was going to happen anywhere, it was going to be in America.

The energy infrastructure sector has been lethargic over the past few weeks. 2Q18 earnings were strong, but investor positivity was fleeting. Since early August, flows have been light and buyers cautious. The Alerian MLP ETF (AMLP) has seen outflows on most days, although that may be because people are becoming aware of its flawed tax structure (see Uncle Sam Helps You Short AMLP).

.avia-image-container.av-joz74t-883487ba70292a0dc94e55bad4cb1f14 img.avia_image{ box-shadow:none; } .avia-image-container.av-joz74t-883487ba70292a0dc94e55bad4cb1f14 .av-image-caption-overlay-center{ color:#ffffff; }

Record U.S. oil production should serve as a reminder that pipeline companies are the vital enablers of our energy success. Cash flow yields on the American Energy Independence Index are 8.75% and we expect 15-20% annual cash flow growth this year and next.  The dividend yield is 5.6% and growing 10%/year.  Hydrocarbons have to be processed, stored and moved; record volumes should support 3Q18 profits when they start being reported next month.

We are long PAGP.

We are short AMLP.


Old Style MLP Funds Get Left Behind

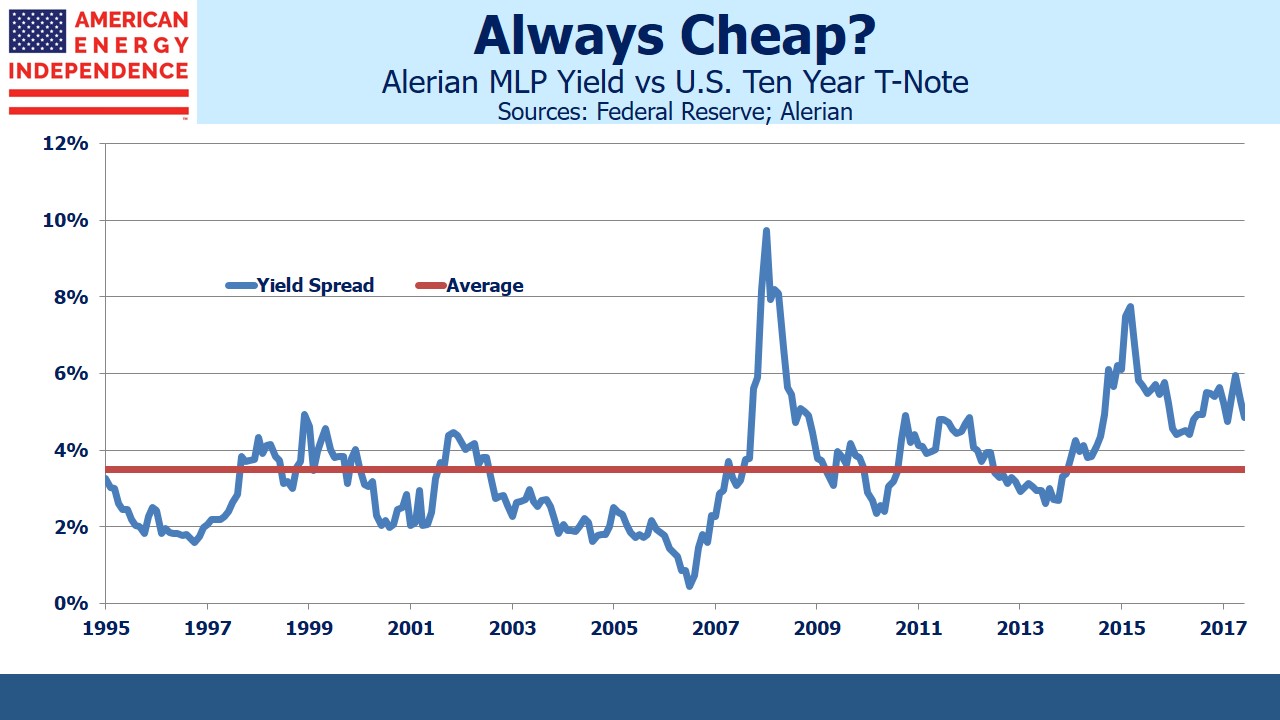
Although MLPs are cheap by historical standards, the persistence of their attractive valuation should prompt observers to think a little harder. The almost 5% yield spread between the Alerian MLP Index and ten year treasuries is 1.5% wider than the 20-year average of 3.5%. However, the MLP yield spread to treasuries has been historically wide since 2013.

.avia-image-container.av-294ath-3513f16f9ffbc66cd917546566bc86e9 img.avia_image{ box-shadow:none; } .avia-image-container.av-294ath-3513f16f9ffbc66cd917546566bc86e9 .av-image-caption-overlay-center{ color:#ffffff; }

What an investor regards as a cheap security is, for the issuer, an expensive source of capital. Market gyrations create opportunities, but a temporary mispricing can evolve into a permanent one. The buyers and issuers of such securities are in effect debating whether such a shift has occurred.

The list of companies concluding that a shift has occurred includes all those who have converted from the traditional MLP structure with a General Partner (GP) earning Incentive Distribution Rights (IDRs). In 2014 Kinder Morgan (KMI) became the first large MLP to decide that something fundamental had changed in the MLP investor, and converted to a corporation. As regular readers know, we believe the Shale Revolution upset the prior business model. Before hydraulic fracturing and horizontal drilling unlocked America’s enormous reserves of hydrocarbons, energy infrastructure companies had a limited need to reinvest profits.  Our existing network of pipelines, processing facilities and storage was adequate to the task. Hence, MLPs distributed most of their cashflow in a tax-advantaged form, which attracted income-seeking investors.

In recent years, unconventional oil and gas extraction from previously untapped areas has required new infrastructure. Financing this disrupted the high payout model, leading to distribution cuts which alienated long-time investors (see Will MLP Distribution Cuts Pay Off?).

KMI was followed by many other large MLPs (see What Kinder Morgan Tells Us About MLPs), eventually including Targa Resources (TRGP), Oneok (OKE), Tallgrass (TEGP), Williams Companies (WMB) and Enbridge (ENB). Although there were some differences in structure, all these companies ultimately sought access to the wide pool of global equity investors. They’ve moved beyond the older, wealthy Americans who had long held MLPs for income and didn’t mind the K-1s. This narrow pool of buyers was not suited to finance growth businesses.

The MLPs that converted to corporations, including those listed above, have explicitly acknowledged this inadequacy of the traditional MLP investor. Many of those companies who remain MLPs are nonetheless mindful that the structure may not always suit them. Crestwood (CEQP) CEO Bob Phillips has said, of conversion to a corporation, that, “we won’t be the first, but we won’t be the last either.” Every MLP CFO is regularly asked about their structure.

On the other side of the Corp vs MLP debate are the managers of MLP-dedicated funds, including the Alerian MLP Fund (AMLP), and numerous other tax-burdened vehicles (see MLP Funds Made for Uncle Sam).

While the biggest MLPs are converting to corporations, it isn’t easy for these specialized funds to follow them. A taxable MLP fund that invested in a taxable corporation, delivering taxable returns to investors, would look absurd. But converting an MLP-dedicated fund to a RIC-compliant structure would require dumping 75% of their portfolio in order to comply with the 25% limit on MLPs. This would be hugely disruptive. With over $50BN in various poorly structured vehicles, they must all be hoping that none of their peers decide to become RIC-compliant, because it would depress MLP prices and lead fund investors to fear that others would follow (see The Uncertain Future of MLP-Dedicated Funds).

Faced with unpalatable choices, the managers of such funds naturally enough like their MLP-only approach.

.avia-image-container.av-2aco1h-b804fd402cd0cf9e90f0f2e0b031a029 img.avia_image{ box-shadow:none; } .avia-image-container.av-2aco1h-b804fd402cd0cf9e90f0f2e0b031a029 .av-image-caption-overlay-center{ color:#ffffff; }

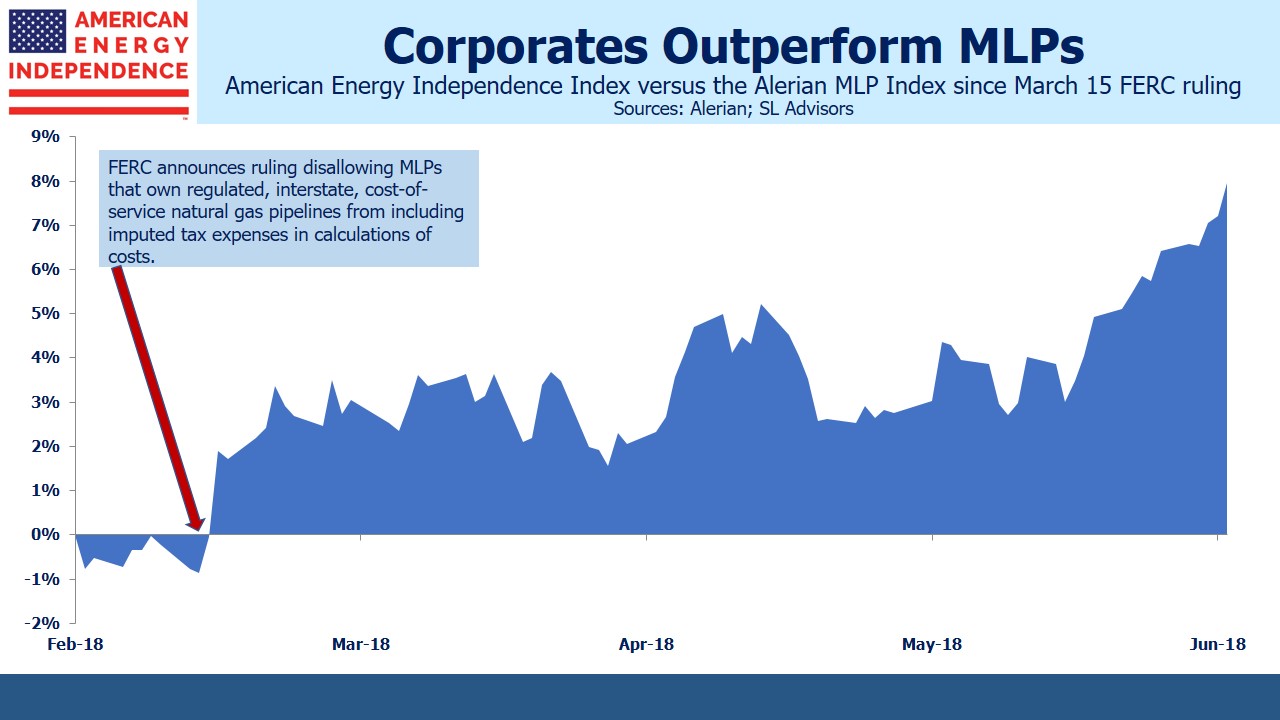
As the chart shows, since the FERC ruling in March which caused many to reconsider the MLP structure (see FERC Ruling Pushes Pipelines Out of MLPs), diversified energy infrastructure has handily beaten MLPs. The American Energy Independence Index (AEITR) consists mostly of U.S. and Canadian corporations as well as having 20% allocated to the largest MLPs.  Driven by its heavy exposure to corporations, the AEITR has delivered an 8% higher return than the Alerian MLP Index. Moreover, investors in AMLP and other MLP-dedicated funds have to contend with the corporate tax drag which further impedes their return. The broader investor base available to corporations means better liquidity, which in turn attracts additional capital. Clearly, the companies that converted from MLPs can feel their choice was vindicated. Even Alerian CEO Kenny Feng concedes that the midstream sector, “…is in a bit of an identity crisis.”

The lesson here is that when a sector stays cheap for an extended period of time, perhaps something has fundamentally changed. Along with many of the largest energy infrastructure corporations, we think it has.

We are invested in CEQP, ENB, KMI, OKE, TEGP, TRGP, WMB.

We are short AMLP.


How to Profit From MLPs Overnight

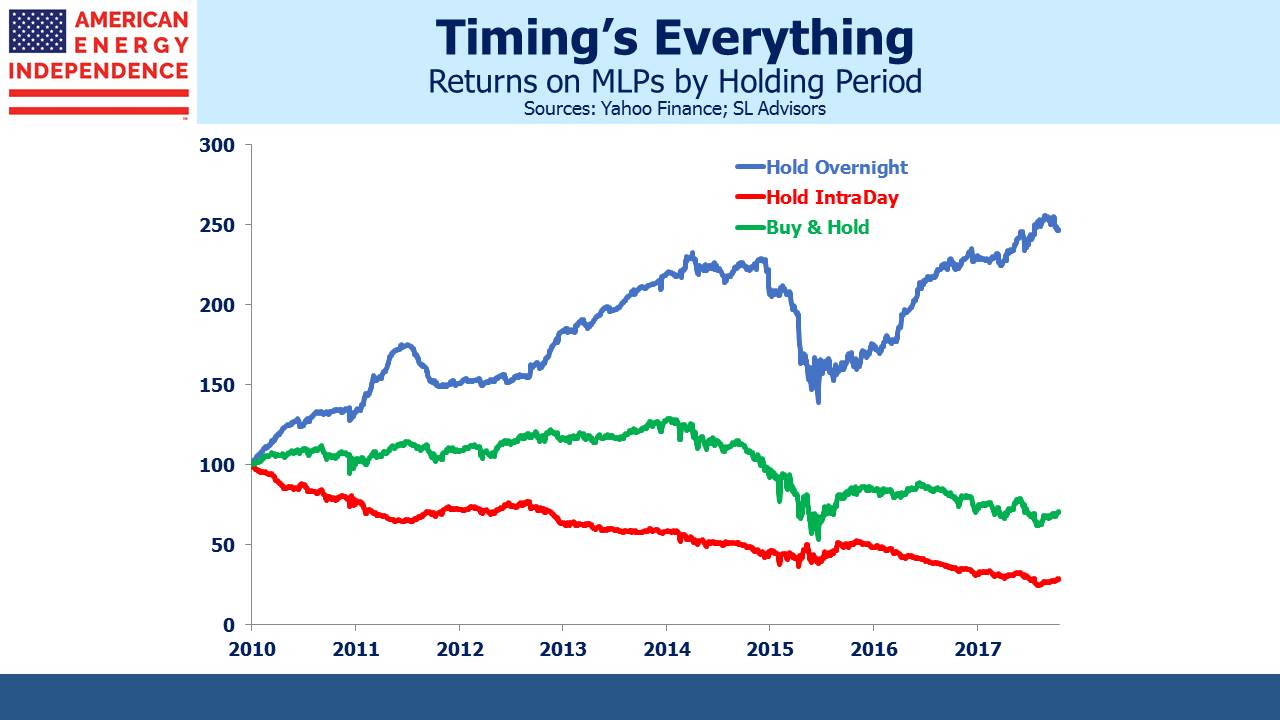
A few months ago the NYTimes ran an interesting piece on the difference between intra-day and overnight returns on the stock market. The article compared a strategy of buying on the open and selling every day at the close (“IntraDay”), with a strategy of buying on the close and selling the next morning at the open (“Overnight”). Using the S&P500 ETF (SPY), they found that the returns to the Overnight strategy easily beat the IntraDay one.

We looked at the figures ourselves using SPY back to 1993, and while we came up with different numbers the pattern is clear. The NYTimes piece omitted dividends, which would always accrue to the Overnight Strategy and not to IntraDay, since you have to own a security at the close of business on the record date to earn the dividend. So in this case and the one below, Overnight returns will be even better by the amount of the annual dividend.

The stock market is full of patterns, and identifying a profitable one takes far more than simply discovering one that’s worked in the past. For instance, the relative advantage of Overnight over IntraDay on SPY has declined over the years, probably because the hedge funds who look for these things long ago found it and started exploiting it. The best results came in the years either side of the dot.com bubble (1998-2002). Since the IntraDay strategy is by definition a day trade, the persistent success of Overnight versus IntraDay back then is probably a tangible measure of day traders gradually ceding their capital to more sophisticated participants.

It’s also important to identify a reason for any anomaly. A series of rainy Sundays tells you nothing about next weekend’s weather (correlation versus causality). There needs to exist some economic reason for the anomaly for it to continue. Is there a reason to expect persistence in the Overnight versus IntraDay phenomenon, even though the margin has diminished? The NYTimes article speculates that buying in the morning offers traders some ability to respond to adversity during the day, and that closing out a long position in the afternoon protects against an inability to immediately react to an overnight event causing losses. Since humans continue to be the ultimate investment decision makers, this is a plausible explanation.

.avia-image-container.av-2rk2o9-75f70bc78f1bf3bcae7666b555774574 img.avia_image{ box-shadow:none; } .avia-image-container.av-2rk2o9-75f70bc78f1bf3bcae7666b555774574 .av-image-caption-overlay-center{ color:#ffffff; }

Because MLPs are more retail-dominated than the broader stock market, human foibles are more likely to show up there. The data doesn’t go back as far as SPY, but we looked at Overnight versus IntraDay using AMLP, which launched in 2010. The superiority of Overnight is far more significant than with SPY. Although AMLP has lost 29% of its value before distributions since 2010, the Overnight strategy grew by almost 150% while IntraDay lost 70% of its value. It looks as if MLP investors bounce out of bed full of optimism, only to have those positive feelings ground down by a sector that has regularly spent the trading day selling off from the open.

This means that if you’re considering investing in the sector, you may want to wait until the afternoon. Buyers tend to execute their intentions early. For this group, caffeine-fuelled exuberance gradually gives way to low blood-sugar despondency. After lunch, your buy order will face less competition. In energy infrastructure, it seems, your money really does work harder for you at night.

Put another way, a strategy of shorting AMLP intra-day would have generated a positive return of 150% before transactions costs over the past seven years. Unfortunately, transactions costs of even 0.025% per trade (i.e. 0.05% daily) wipe out the profit. AMLP remains a good short (see MLP Funds Made for Uncle Sam) because of its structural deficiencies, but bad as they are they’re not sufficiently catastrophic to support a day-trading, active shorting strategy.

We are short AMLP


Some MLP Investors Get Taxed Twice

There is around $53BN invested in MLPs via ’40 Act funds – the term used to describe the three major types of funds issued under the 1940 Investment Company Act (mutual, exchange traded and closed end funds). It’s safe to say that an important motivating factor driving these selections is investors’ desire to hold Master Limited Partnerships (MLPs) without receiving K-1s. ’40 Act funds issue 1099s, which makes tax reporting simpler. We have warned before about these frogs masquerading as princes (see Are You in the Wrong MLP Fund?)

Providing investors MLP exposure while avoiding the K-1s was once an objective of industry pioneers who identified a new source of capital from retail investors, if only this problem could be solved. Although much energy and expensive tax advice were deployed, an elegant solution remained elusive at that time. All that remained was a decidedly inelegant one – offer retail investors shares in a C-corp, which would hold MLPs and issue its investors a 1099. The significant problem with this solution was that the C-corp’s returns would be subject to Federal Corporate Tax, as with any corporation. The investors in this C-corp would only receive 65% of the result, since 35% would go to the IRS.

Some dismissed this “solution” as impractical. After all, who would knowingly make an investment that could only earn around two thirds of what the assets themselves generate? But the absence of a better (i.e. more tax-efficient) solution frustrated a few, and they redirected their attention away from solving the problem to instead convincing investors that a deeply flawed structure was what they really wanted.

The result is that 83% of the $53BN mentioned above is invested in vehicles that have no hope of ever coming close to earning the return of the MLP sector. A careful reading of prospectuses issued by the offending vehicles reveals wording that is technically accurate while still misleading.

Quite a few claim an objective of results corresponding to their chosen index before fees and expenses. Since ’40 Act funds (outside of MLP funds) are very largely RIC-compliant (which means they don’t pay corporate tax), few MLP fund investors consider that by far the biggest line item in the inferior funds’ list of fees and expenses is taxes.

The Alerian MLP ETF (AMLP), the largest repository of mis-directed capital by poorly informed investors, goes further and says it, “…delivers exposure to the Alerian MLP Infrastructure Index”. Exposure to an asset class is not the same as providing good results from investing in it. The carefully worded prospectuses of AMLP and its tax-hindered cousins are technically correct. But I can personally attest that few holders of such securities are aware that they’ve essentially tied their running shoes together at the start of the race. What’s worse is that the tax expense isn’t deducted from the yield, but comes out of the NAV. So the 7.5% yield on AMLP is before the corporate tax expense is paid. Imagine if a corporation paid all its pre-tax cashflow out in distributions and then wrote another, separate check to the U.S. Treasury, thereby reducing its book value. That’s what taxable C-corp MLP funds are doing.

Pointing out to such an investor the mistake they’ve made is not especially fun, and I’ve had to do it numerous times. It’s somewhat akin to noting the toxic dump near an unwitting home buyer’s recent purchase. The reaction to missing such an obvious value destroyer is usually a combination of embarrassment (at their own evidently shallow research) and anger at being guided towards a fundamentally flawed investment.

.avia-image-container.av-3943b1-1c341490e1640d60638274c9d95f7b11 img.avia_image{ box-shadow:none; } .avia-image-container.av-3943b1-1c341490e1640d60638274c9d95f7b11 .av-image-caption-overlay-center{ color:#ffffff; }

Picking a tax-paying MLP fund is an especially tragic choice when returns have been good, and in some cases very good indeed. Moreover, based on recent fund flows some new investors are making the same mistake. Holders of such funds are accepting the downside risk of the sector while only being able to earn 65% of any upside. This is careless to say the least. By choosing to invest in a fund that splits its profits two thirds/one third with Uncle Sam, these investors are supporting the tax base twice – once, before they get their returns, and again after they pay their own tax obligation on what’s left.

The list of such offending funds is too numerous to include here, reflecting the unfortunate tendency towards highly superficial investment research by too many investors. However, if you look at Morningstar’s list of MLP funds and sort by the 1 Year Return column, the structurally impaired can helpfully be found in an undignified heap languishing towards the bottom. At the top you’ll find the funds who thought enough of their investors to at least provide the non-taxable, pass-through structure they assumed they were buying.

If you’re invested in one of the lousy funds, correct that mistake sooner rather than later. And if your financial advisor has put you in one, you may wish to reassess the depth of research carried out on your behalf.