OPEC Blinks
OPEC Blinks
Last week OPEC announced a plan to reduce their crude oil production, from August’s level of 33.23 MMB/D (Million Barrels a Day) to somewhere between 32.5 and 33 MMB/D. The last time OPEC agreed to curb output was in 2008.
Healthy skepticism correctly greets OPEC’s pronouncements on production curbs. Saudi Arabia is the only country with much ability or desire to manage output and therefore prices. A cartel that controls a third of global output is hardly in much control, and widespread cheating over the years has not helped to create an environment of mutual trust among OPEC’s members. Nonetheless, there’s no doubt that some type of accord to reduce output is in their interests given the relative inelasticity of oil supply over even the intermediate term. So the fact that the Saudis and Iranians keep coming together for talks, albeit inconclusive perhaps until recently, illustrates that they’d both like to get to an agreement.
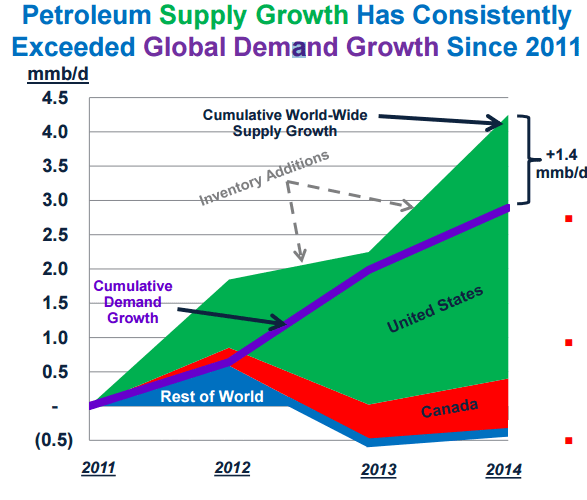
It’s interesting to review how we got here from $100 oil just over two years ago. In 2014 Plains All American used the chart below in their investor presentations, and it neatly encapsulates the dilemma facing OPEC at that time. New global demand was increasingly being satisfied by North American producers. In fact, the 3MMB/D Cumulative Demand Growth from 2011-14 in this chart pretty much matches the increase in U.S. shale oil output over the same period of time. OPEC, or the Saudis, recognized that they were losing market share to the upstart, high cost U.S. shale industry and decided to expose its cost structure.
What follows is a great story of American ingenuity. Although financial pain and bankruptcies continue to occur in the U.S. energy sector, Exploration and Production (E&P) firms have furiously innovated, discovered new technological enhancements, demanded cost reductions from their service providers and adapted to oil under $50 a barrel. Consequently, while U.S. shale oil production dipped it remains around the levels it was in 2014.

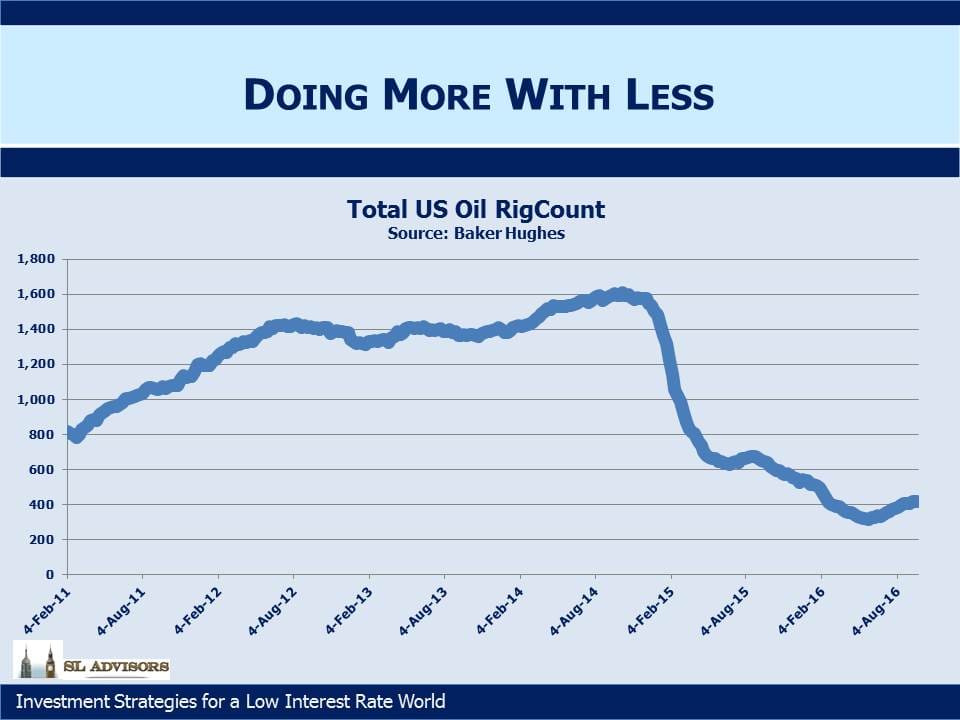
The oil rig count shows signs of bottoming, and U.S. production was already looking as if it may not drop much further before last week’s announcement. The rig count chart shows that the industry has cut its use of rigs by 75%, reflecting substantially improved operating efficiencies.
The asymmetry is quite delicious; the governments of almost half the world’s oil production (since Russia is also sporadically involved in discussions around output) regularly meet to plot the path back to higher oil revenues. Meanwhile the U.S., whose output ostensibly caused the supply imbalance, doesn’t even have an official view on U.S. oil production. Private industry representing the U.S. at its best is combining technological expertise, access to capital, a relentless drive to cut costs and raw entrepreneurialism. The Saudi’s have little to show for their strategy of increasing output beyond steadily depleting their stock of financial assets as they draw on them to fund a gaping budget deficit.
The Saudis may have simply concluded that enough is enough. Or they may be considering the long game. Conventional new supply comes online slowly, typically requiring several years of development. The $1TN of reductions in capex for exploration (see Why Oil Could Be Higher for Longer) run the risk that the roughly 6MMB/D of new supply that’s needed annually to meet depletion and new demand won’t be there at anything close to current prices. There’s some risk of a substantial run-up in prices 2-5 years out. Allowing prices to rise now can stimulate new exploration and reduce the risk of such an imbalance.
Whatever the OPEC strategy, the clear beneficiaries will include the U.S. shale oil industry and the infrastructure providers that support it. They have the shortest reaction time, and can bring on new supply within a couple of quarters or so. By acting as the swing producer, U.S. production will impede the higher price that would make other conventional projects viable. As the Saudis are learning, it’s not good to bet against the American private sector.
Gallic Justice
In 2008 Jerome Kerviel, a trader at Societe Generale, cost his employer €4.9BN when his unauthorized trading spectacularly blew up. Kerviel was sent to prison and assessed €4.9BN in damages. Last week, a French court reduced the damages claim to just €1MM, on the basis that the bank’s poor controls were to blame.
Implausibly, back in June Kerviel also won a wrongful dismissal suit against SocGen that awarded him €400K. Although he had accumulated positions that were nearly twice the value of the entire bank, the tribunal found that he was fired, “without real and serious cause”. And yet, even had SocGen refrained from this most reasonable action and not fired him, Kerviel would nonetheless have been unable to show up for work because he was in prison. Therefore, the tribunal presumably believes this extended absence from his place of work would also have been insufficient grounds for dismissal. You just can’t make this stuff up.

Important Disclosures
The information provided is for informational purposes only and investors should determine for themselves whether a particular service, security or product is suitable for their investment needs. The information contained herein is not complete, may not be current, is subject to change, and is subject to, and qualified in its entirety by, the more complete disclosures, risk factors and other terms that are contained in the disclosure, prospectus, and offering. Certain information herein has been obtained from third party sources and, although believed to be reliable, has not been independently verified and its accuracy or completeness cannot be guaranteed. No representation is made with respect to the accuracy, completeness or timeliness of this information. Nothing provided on this site constitutes tax advice. Individuals should seek the advice of their own tax advisor for specific information regarding tax consequences of investments. Investments in securities entail risk and are not suitable for all investors. This site is not a recommendation nor an offer to sell (or solicitation of an offer to buy) securities in the United States or in any other jurisdiction.
References to indexes and benchmarks are hypothetical illustrations of aggregate returns and do not reflect the performance of any actual investment. Investors cannot invest in an index and do not reflect the deduction of the advisor’s fees or other trading expenses. There can be no assurance that current investments will be profitable. Actual realized returns will depend on, among other factors, the value of assets and market conditions at the time of disposition, any related transaction costs, and the timing of the purchase. Indexes and benchmarks may not directly correlate or only partially relate to portfolios managed by SL Advisors as they have different underlying investments and may use different strategies or have different objectives than portfolios managed by SL Advisors (e.g. The Alerian index is a group MLP securities in the oil and gas industries. Portfolios may not include the same investments that are included in the Alerian Index. The S & P Index does not directly relate to investment strategies managed by SL Advisers.)
This site may contain forward-looking statements relating to the objectives, opportunities, and the future performance of the U.S. market generally. Forward-looking statements may be identified by the use of such words as; “believe,” “expect,” “anticipate,” “should,” “planned,” “estimated,” “potential” and other similar terms. Examples of forward-looking statements include, but are not limited to, estimates with respect to financial condition, results of operations, and success or lack of success of any particular investment strategy. All are subject to various factors, including, but not limited to general and local economic conditions, changing levels of competition within certain industries and markets, changes in interest rates, changes in legislation or regulation, and other economic, competitive, governmental, regulatory and technological factors affecting a portfolio’s operations that could cause actual results to differ materially from projected results. Such statements are forward-looking in nature and involves a number of known and unknown risks, uncertainties and other factors, and accordingly, actual results may differ materially from those reflected or contemplated in such forward-looking statements. Prospective investors are cautioned not to place undue reliance on any forward-looking statements or examples. None of SL Advisors LLC or any of its affiliates or principals nor any other individual or entity assumes any obligation to update any forward-looking statements as a result of new information, subsequent events or any other circumstances. All statements made herein speak only as of the date that they were made. r
Certain hyperlinks or referenced websites on the Site, if any, are for your convenience and forward you to third parties’ websites, which generally are recognized by their top level domain name. Any descriptions of, references to, or links to other products, publications or services does not constitute an endorsement, authorization, sponsorship by or affiliation with SL Advisors LLC with respect to any linked site or its sponsor, unless expressly stated by SL Advisors LLC. Any such information, products or sites have not necessarily been reviewed by SL Advisors LLC and are provided or maintained by third parties over whom SL Advisors LLC exercise no control. SL Advisors LLC expressly disclaim any responsibility for the content, the accuracy of the information, and/or quality of products or services provided by or advertised on these third-party sites.
All investment strategies have the potential for profit or loss. Different types of investments involve varying degrees of risk, and there can be no assurance that any specific investment will be suitable or profitable for a client’s investment portfolio.
Past performance of the American Energy Independence Index is not indicative of future returns.
Leave a Reply
Want to join the discussion?Feel free to contribute!