Getting Cheaper By Moving Sideways

/
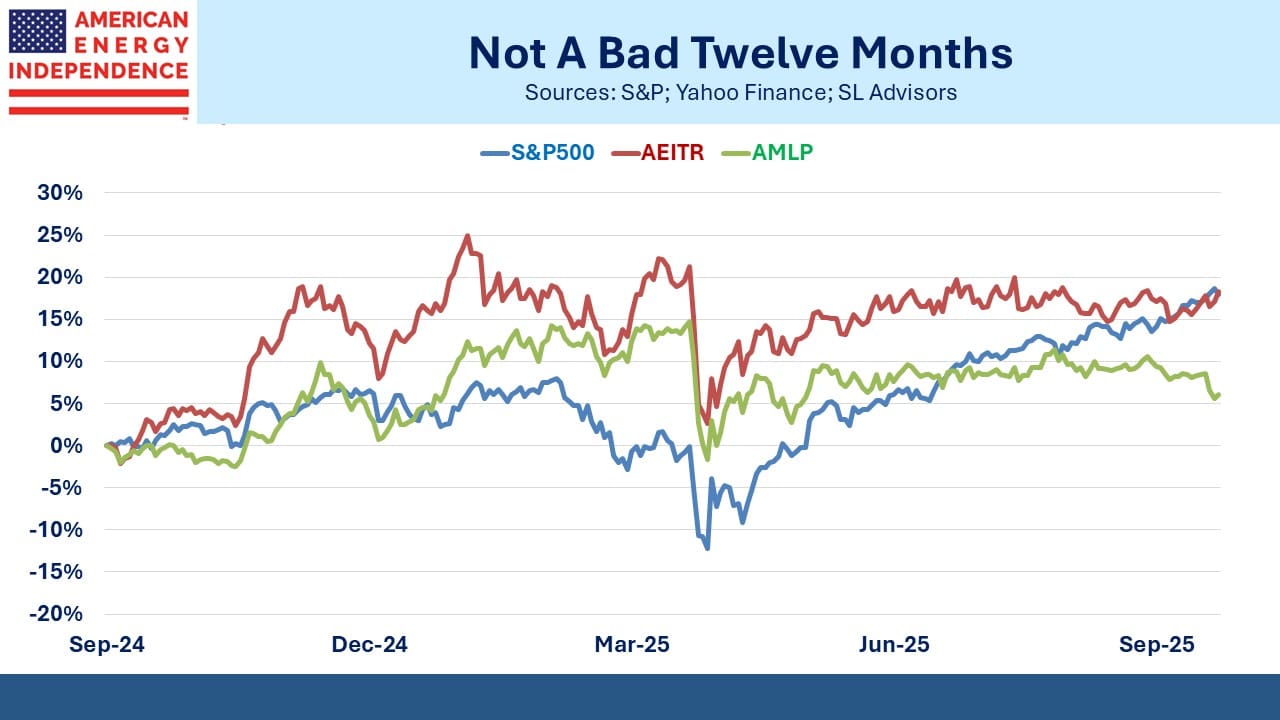
The energy sector is leaving investors unimpressed. YTD the American Energy Independence Index (AEITR) is +5% and seems to be marking time. The S&P500, increasingly dominated by tech and AI exposure, is +13%. Long-time clients, having enjoyed several strong years, hope the better days will soon return. More recent investors demand to know what’s gone wrong.
Time period matters. Roll the start date back three months, and the trailing one-year return for the S&P500 is +17% and the midstream sector is +19%. 4Q24 makes a big difference.
The perennially underperforming Alerian MLP ETF (AMLP) is only +8%.
Operating performance is beating sentiment. 2Q earnings contained few surprises and mostly confirmed the positive trend for cash flow growth. More recently, Hess Midstream revised their guidance lower but the outlook for crude, where Hess operates, is weaker than for gas. Upstream capex is declining because of soft oil prices (see The Energetic Outlook For Energy) while midstream capex is increasing to meet growing gas demand for data centers and LNG exports.
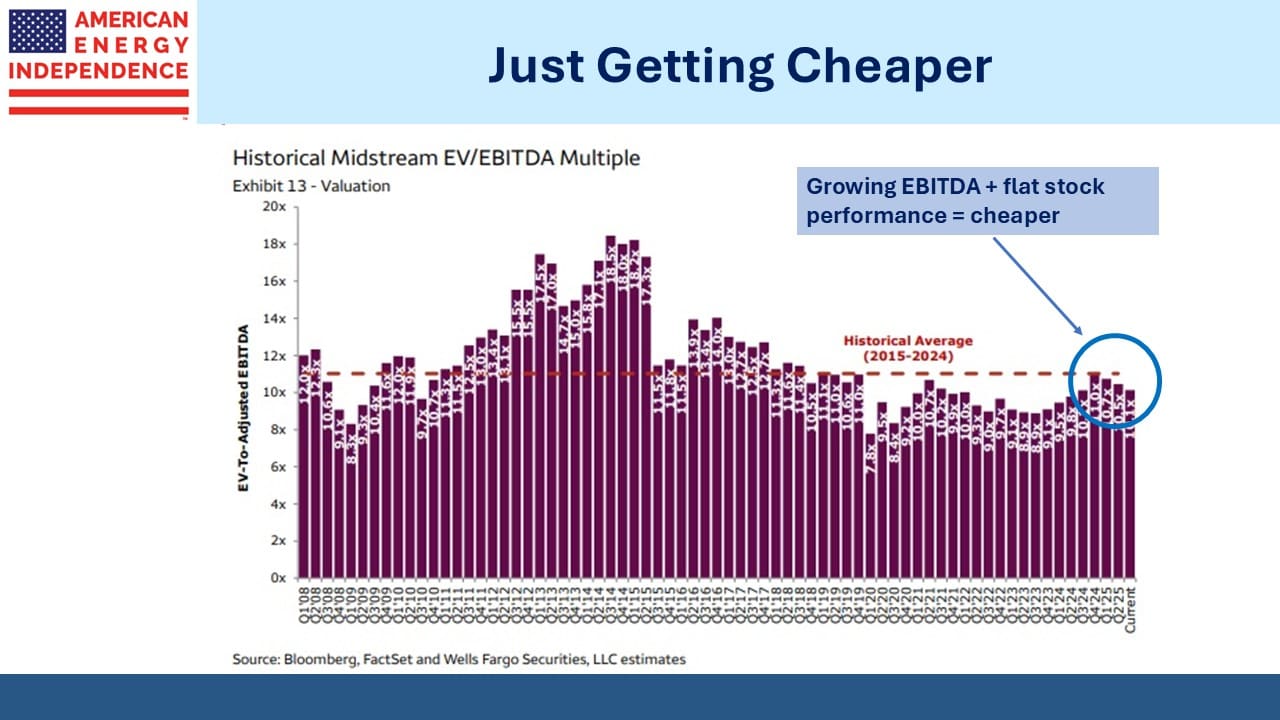
The contrast between moribund price performance and dynamic operating results is demonstrated by the Wells Fargo EV/EBITDA chart. The midstream sector has become cheaper, having pulled back almost halfway to the lows of late 2023, from which it delivered last year’s +45% total return. The problem, if a trailing one-year return of 19% deserves that characterization, is more with overly cautious investors than with how the companies are doing.
Modest price performance with growing EBITDA has left the sector more attractive than it’s been all year.
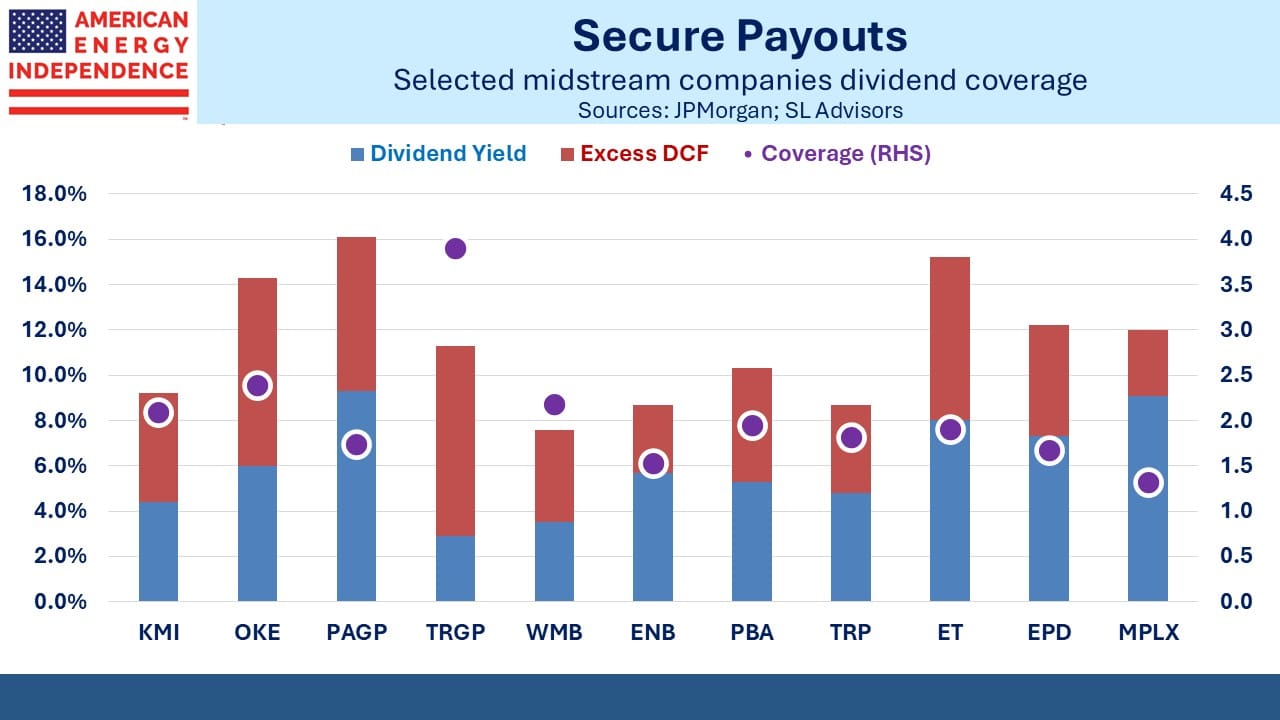
Leverage continues to drift lower with a median Debt:EBITDA of 3.5X according to JPMorgan, who also sees dividends growing at 5-7% next year. Distributable Cash Flow coverage ratios for the large cap names listed are at a median of 1.9X. We’ve omitted the LNG exporters Cheniere and Venture Global because they pay small dividends so would distort this metric higher.
The demand picture for natural gas remains robust, with hundreds of $BNs being invested in data centers that will need reliable electricity and LNG exports growing strongly. Below average sea temperatures in the Pacific near Peru meet the criterion for La Nina, meaning the odds of a warmer than average US winter are low. Natural gas prices rose accordingly on this news.
Although we’re rarely accused of insufficient enthusiasm towards pipelines, it does seem that for those underweight the sector, which would be most investors, current valuations offer an opportunity to rectify.
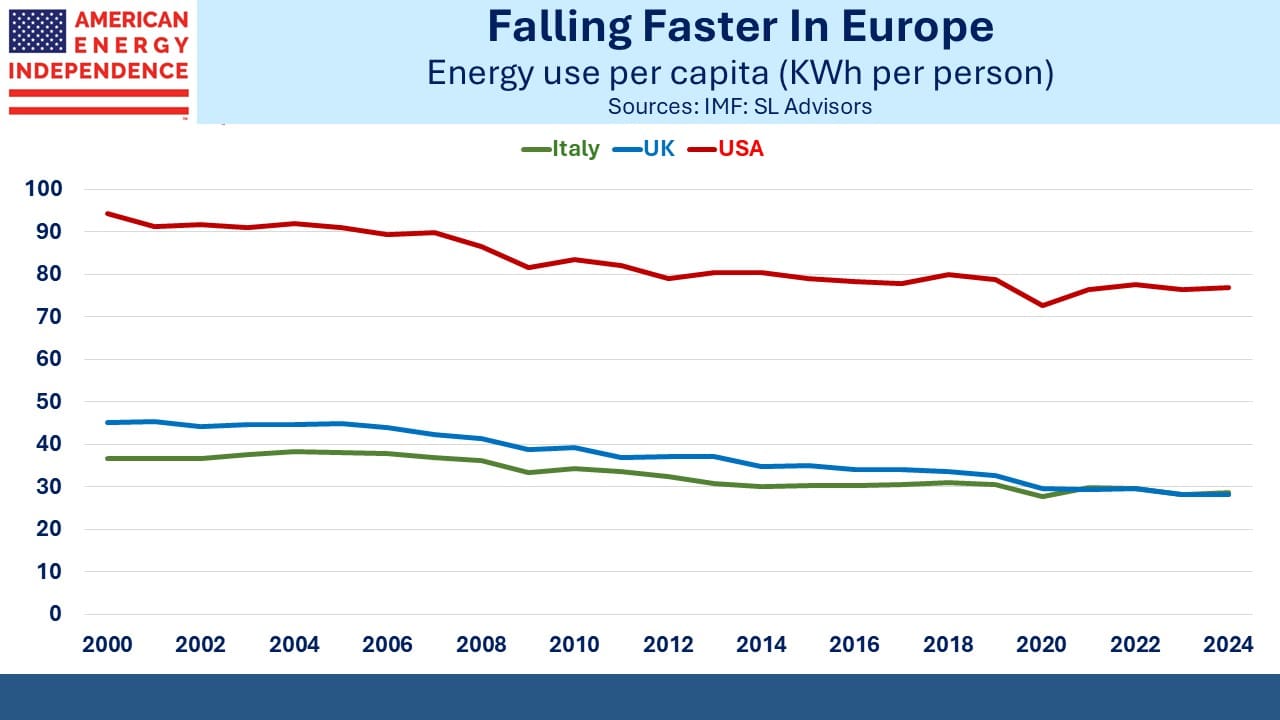
My wife and I were in Italy recently. When we travel, I’m always interested to learn more about how other countries use energy. Americans use more energy per capita than any other developed country except Canada, where the winters are long and cold.
The typical Italian uses only 37% as much energy as an American. There are many factors for this – Europeans rely less on air conditioning than we do in North America. They like to open the windows, since summer heat rarely matches the US.
The cars are smaller, with two-seater and even one-seater models that would fit in the back of a Ford F150. Hotels often require you to put your key in a slot to activate the room’s power, ensuring no wasted electricity when guests are out.
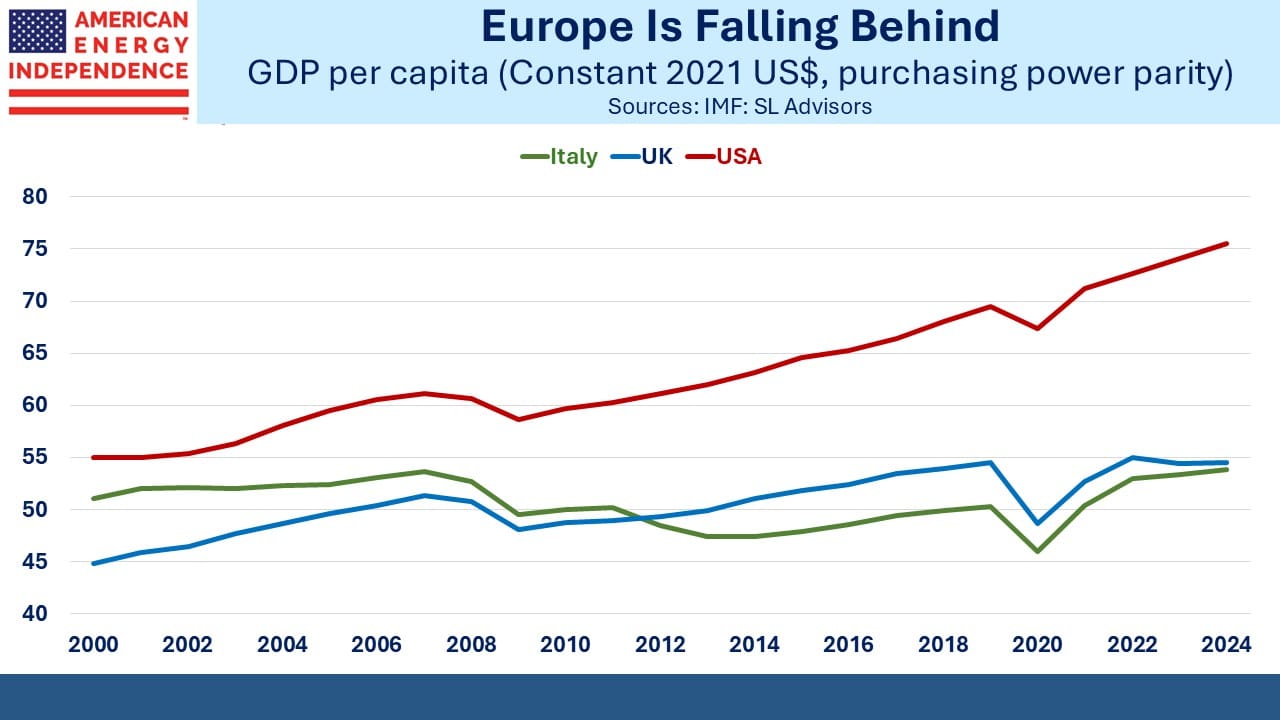
The EU is a leader in adopting policies to reduce greenhouse gases, which has led to some of the world’s highest electricity prices and a slow de-industrialization of the region. Living standards and energy consumption are symbiotically linked. Italian GDP per capita is only 71% of the US, down from 95% twenty-five years ago. Per capita energy consumption has declined 0.8% annually over the past decade, faster than the US at 0.5%.
The setting for Frances Mayes’ Under the Tuscan Sun is populated by many who care little for such analysis. It’s true that sharing a bottle of Chianti in a picturesque village overlooking rolling vineyards can generate thoughts beyond GDP. But to live like an American in Italy you need to have made your money elsewhere.
The inescapable conclusion is that relative living standards in much of Europe are sliding along with energy use. One can debate cause versus effect, but not the outcome. One of the saddest charts I ever look at is the ratio of UK to US GDP per capita, which has dropped quite sharply in the past decade. Brexit, no productivity growth and widespread use of expensive windpower have all contributed. But it does pain me to see my old country making bad choices while also confirming my 1982 decision to emigrate.
Trump’s jibe at the UN that European countries were “going to hell” in part because of energy policies was hyperbolic as usual but directionally correct. He’s wrong in denying the risks in elevated atmospheric CO2, but right in criticizing the belief that the world will run on renewables. It won’t. Fortunately, in America, we know that.
We have two have funds that seek to profit from this environment:

Important Disclosures
The information provided is for informational purposes only and investors should determine for themselves whether a particular service, security or product is suitable for their investment needs. The information contained herein is not complete, may not be current, is subject to change, and is subject to, and qualified in its entirety by, the more complete disclosures, risk factors and other terms that are contained in the disclosure, prospectus, and offering. Certain information herein has been obtained from third party sources and, although believed to be reliable, has not been independently verified and its accuracy or completeness cannot be guaranteed. No representation is made with respect to the accuracy, completeness or timeliness of this information. Nothing provided on this site constitutes tax advice. Individuals should seek the advice of their own tax advisor for specific information regarding tax consequences of investments. Investments in securities entail risk and are not suitable for all investors. This site is not a recommendation nor an offer to sell (or solicitation of an offer to buy) securities in the United States or in any other jurisdiction.
References to indexes and benchmarks are hypothetical illustrations of aggregate returns and do not reflect the performance of any actual investment. Investors cannot invest in an index and do not reflect the deduction of the advisor’s fees or other trading expenses. There can be no assurance that current investments will be profitable. Actual realized returns will depend on, among other factors, the value of assets and market conditions at the time of disposition, any related transaction costs, and the timing of the purchase. Indexes and benchmarks may not directly correlate or only partially relate to portfolios managed by SL Advisors as they have different underlying investments and may use different strategies or have different objectives than portfolios managed by SL Advisors (e.g. The Alerian index is a group MLP securities in the oil and gas industries. Portfolios may not include the same investments that are included in the Alerian Index. The S & P Index does not directly relate to investment strategies managed by SL Advisers.)
This site may contain forward-looking statements relating to the objectives, opportunities, and the future performance of the U.S. market generally. Forward-looking statements may be identified by the use of such words as; “believe,” “expect,” “anticipate,” “should,” “planned,” “estimated,” “potential” and other similar terms. Examples of forward-looking statements include, but are not limited to, estimates with respect to financial condition, results of operations, and success or lack of success of any particular investment strategy. All are subject to various factors, including, but not limited to general and local economic conditions, changing levels of competition within certain industries and markets, changes in interest rates, changes in legislation or regulation, and other economic, competitive, governmental, regulatory and technological factors affecting a portfolio’s operations that could cause actual results to differ materially from projected results. Such statements are forward-looking in nature and involves a number of known and unknown risks, uncertainties and other factors, and accordingly, actual results may differ materially from those reflected or contemplated in such forward-looking statements. Prospective investors are cautioned not to place undue reliance on any forward-looking statements or examples. None of SL Advisors LLC or any of its affiliates or principals nor any other individual or entity assumes any obligation to update any forward-looking statements as a result of new information, subsequent events or any other circumstances. All statements made herein speak only as of the date that they were made. r
Certain hyperlinks or referenced websites on the Site, if any, are for your convenience and forward you to third parties’ websites, which generally are recognized by their top level domain name. Any descriptions of, references to, or links to other products, publications or services does not constitute an endorsement, authorization, sponsorship by or affiliation with SL Advisors LLC with respect to any linked site or its sponsor, unless expressly stated by SL Advisors LLC. Any such information, products or sites have not necessarily been reviewed by SL Advisors LLC and are provided or maintained by third parties over whom SL Advisors LLC exercise no control. SL Advisors LLC expressly disclaim any responsibility for the content, the accuracy of the information, and/or quality of products or services provided by or advertised on these third-party sites.
All investment strategies have the potential for profit or loss. Different types of investments involve varying degrees of risk, and there can be no assurance that any specific investment will be suitable or profitable for a client’s investment portfolio.
Past performance of the American Energy Independence Index is not indicative of future returns.




Leave a Reply
Want to join the discussion?Feel free to contribute!