Fighting Climate Change Is Hard
Incoming President Biden is expected to take the U.S. back into the Paris Climate Agreement, which will mean policies to reduce emissions of GHGs (Green House Gases) will figure in Administration policy.
Polls showed that two thirds of registered U.S. voters described climate change as “somewhat” or “very” important in how they voted. As we saw last week, opinion polls were poor predictors of the election, Democrats received a substantially smaller share of the vote than this poll would have suggested.
A survey last year found that 68% of Americans wouldn’t even pay $10 a month in higher utility bills to combat climate change. It seems fair to say that, beyond a small group of climate extremists, support for green policies doesn’t have widespread economic support. The Democrats’ weaker than expected electoral result reflects this.
White House executive orders to combat climate change could even lead to a healthy debate about where emissions are growing and the cost of solutions. The two charts below are informative.
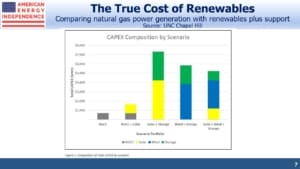
The first is from a 2018 paper called “Measuring Renewable Energy As Baseload Power” published in 2018 by the University of North Carolina. Proponents of solar and wind power often superficially claim that renewables are now cheaper than natural gas power plants. A true comparison needs to account for their intermittency (it’s not always sunny and windy). So the authors walk through a cost comparison of a 650 Megawatt (MW) Natural Gas Combined Cycle (NGCC) power plant running 85% of the time with solar or wind on equivalent terms. The 85% uptime for an NGCC plant allows for maintenance approximately 55 days a year. Solar intermittency means it’s producing power only 21% of the time, peaking around noon.
A correct comparison between the two requires combing the renewables power production with either (1) a smaller NGCC plant, or (2) battery storage. This raises the solar plus model to the 85% capacity utilization of the NGCC plant.
The study compares the cost of an NGCC plant with four different combinations of solar and/or wind plus supplemental power.
The point is that using renewables when they’re available can be cheap. But relying on them is not. California is finding that a purist approach to power generation of eliminating all fossil fuels plus nuclear is both more expensive and unreliable (see California Dreamin’ of Reliable Power). It’s not a combination many should find attractive.
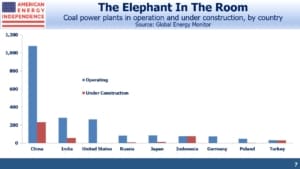
The second chart shows coal-burning power plants in the world’s top ten users. China, the world’s biggest emitter of GHGs, doesn’t just operate far more coal burning power plants than any other country. They’re also building almost as many new plants as the existing U.S. coal fleet. This issue receives very little media attention, although the FT did highlight it recently (see Climate change: China’s coal addiction clashes with Xi’s bold promise). This is why China is planning to increase its GHG emissions over the next decade.
If the Administration pursues policies that impede the use of natural gas for power generation in favor of renewables, intermittency and China’s role in curbing emissions will receive more attention. It’s a debate worth having.
We are invested in all the components of the American Energy Independence Index via the ETF that seeks to track its performance.

