Carry Traders Get Carried Out

/
It looks like a big margin call started in Japan. The Japanese Yen has become a funding currency in recent years, a source of cheap financing with the proceeds reinvested in better returning assets – such as US$ listed AI stocks. Debtors benefit when the currency in which they’ve borrowed depreciates. The Yen offered low borrowing costs and a lower value – until it didn’t.
The proximate cause of the unwinding of this carry trade was the Bank of Japan’s modest 0.15% tightening last week. Friday’s weaker than expected US unemployment report was quickly interpreted as signaling a growth scare. The subsequent Friday-Monday sell off looks far more than is warranted by the data but has nonetheless triggered calls for a 0.50% cut in September, with another by December.
Perhaps big bank economists at JPMorgan and Goldman Sachs were sufficiently shocked by the carnage that they felt compelled to align their own revised forecasts with the market drama. Or maybe they expect the Fed will feel compelled to act on the market’s sudden swing from manic to depressive.
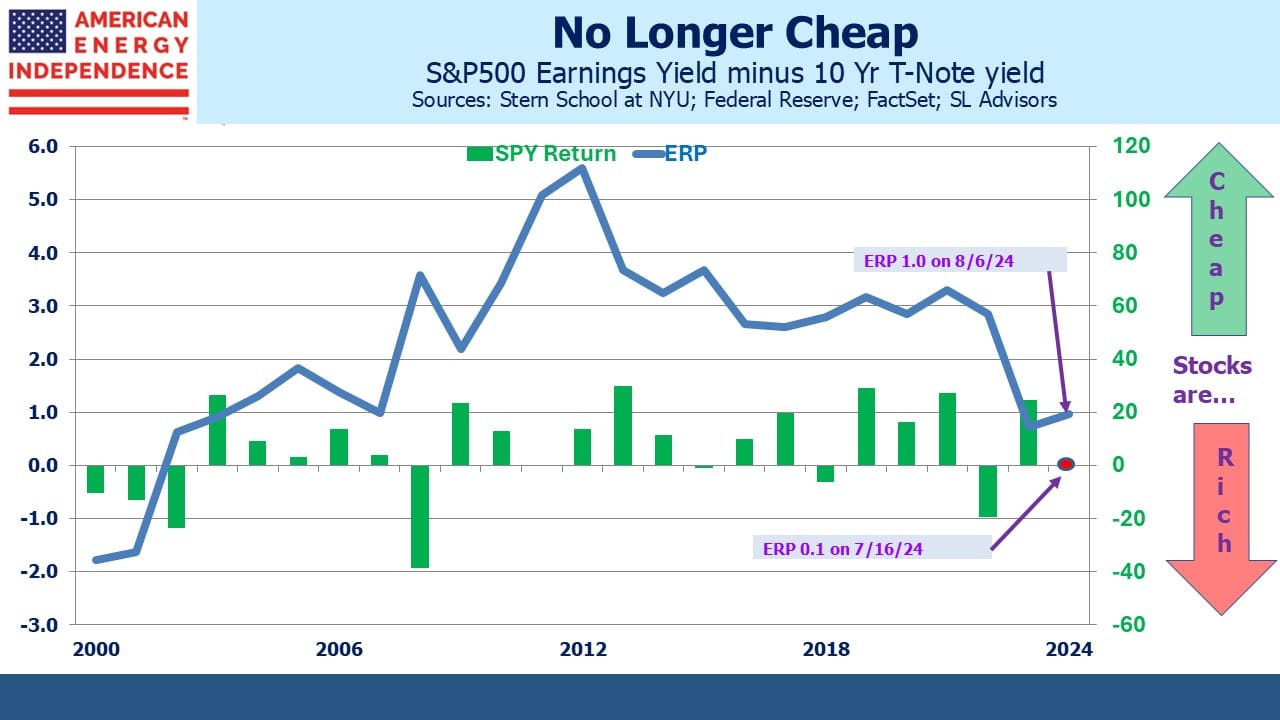
What hasn’t received much attention is that the market was far from cheap, a state that has steadily worsened during the year.
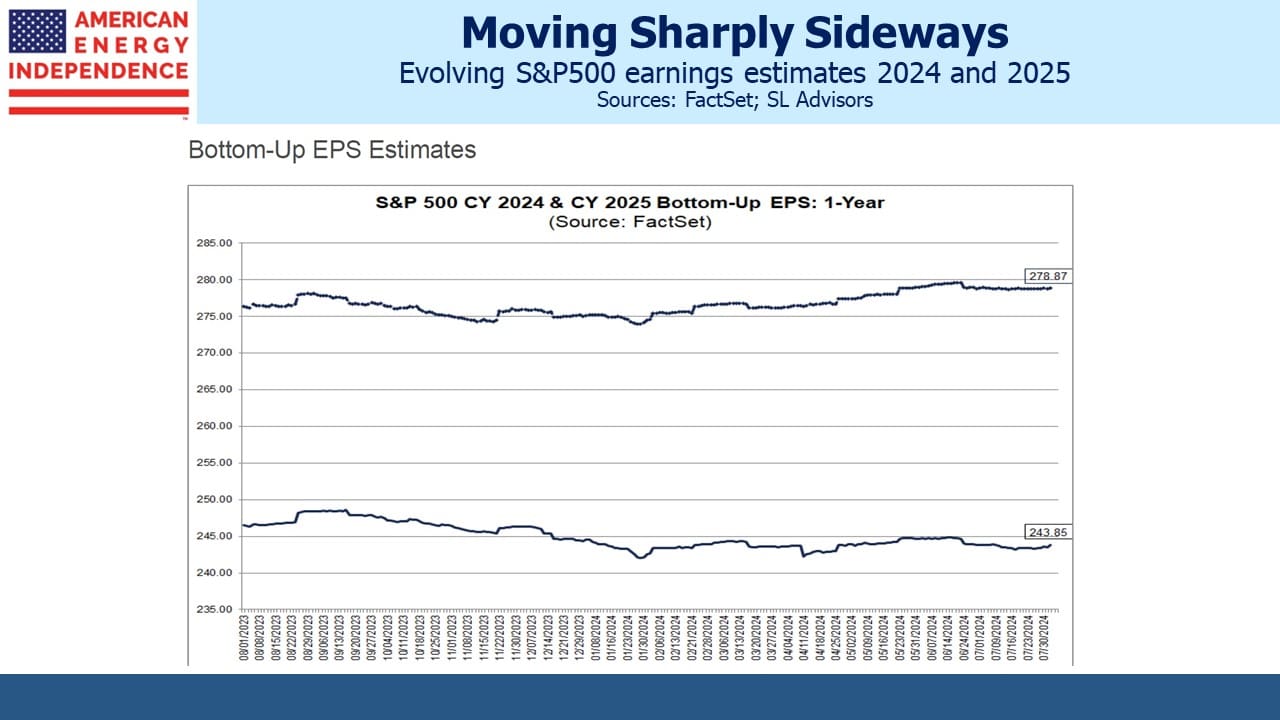
S&P500 earnings forecasts for this year and next have been trending sideways and are barely changed from a year ago. Stocks have risen largely on multiple expansion. The Equity Risk Premium (ERP, defined here as the S&P500 earnings yield minus the ten year treasury yield) slipped to 0.1 on July 16, when stocks made another high.
This is the lowest in over two decades, and essentially means that an investor eschewing bonds in favor of stocks with virtually no yield pick-up was fully relying on earnings growth to compensate for the increased risk.
Put another way, with forecasts of long term equity returns in the 6-8% range, riskless treasury bills yielding 5.3% look competitive.
The subsequent drop in equity prices and bond yields has improved relative value somewhat, but stocks remain historically unattractive on this measure. The great unwinding of the carry trade came, as these things usually do, at an inconvenient valuation point.
By now long-time readers are asking themselves when your blogger will explain what this means for energy stocks, especially midstream. Those long-time readers should know that the answer will soothe any concerns they might have about retaining pipeline stocks during a tempestuous market.
Start with leverage. Pipeline stocks have been paying down debt, such that large US c-corps and MLPs have Debt:EBITDA below 3.5X, in many cases on a path to 3.0X.
Dividends are comfortably within discretionary cashflow, covered by around 2X. 2Q earnings so far have been good. Targa Resources and Plains All American both raised FY guidance. Williams reaffirmed towards the high end of their 2024 range. Oneok reported good earnings. Two weeks ago Kinder Morgan provided an encouraging update on AI-driven natural gas demand.
It’s become normal for midstream earnings to meet or gently exceed expectations, and for Cheniere to do rather better.
Over the past decade US primary energy consumption has grown at 0.6% pa. Apart from during the pandemic and subsequent rebound, year-on-year changes are 1-2% or less. Commodity prices may gyrate wildly, but volumes are remarkably stable.
The outlook for natural gas demand continues to improve. The combination of AI and increased reliance on intermittent renewables means more natural gas – both because solar and wind can’t easily provide electricity with low harmonic distortions that delicate data center kit needs – but also because as unreliable power sources infiltrate the grid, assuring 24X7 supply relies ever more on dispatchable, traditional energy. Which is gas.
The unraveling of the Yen carry trade hasn’t changed any of this. Nor has midstream been a notable beneficiary of the leveraged speculator’s buying, meaning there’s little if anything to unwind.
Over the long run stocks are far more likely than bonds to preserve purchasing power. This is especially so if inflation eventually settles closer to 3% than the Fed’s 2% target. But the ERP relative valuation suggests little need for haste in committing cash. The exception is energy, where we believe the prospects are compelling.
As a reminder of the challenges in making money from renewables, Sunpower (SPWR), once a venerated solar power company with a $9BN market cap, filed for bankruptcy. Pipeline companies keep generating cash and are benefiting from energy transition subsidies from the Inflation Reduction Act.
If you have cash ready to commit, we think now is a good time to put some of it to work in midstream.
We have three have funds that seek to profit from this environment:

Important Disclosures
The information provided is for informational purposes only and investors should determine for themselves whether a particular service, security or product is suitable for their investment needs. The information contained herein is not complete, may not be current, is subject to change, and is subject to, and qualified in its entirety by, the more complete disclosures, risk factors and other terms that are contained in the disclosure, prospectus, and offering. Certain information herein has been obtained from third party sources and, although believed to be reliable, has not been independently verified and its accuracy or completeness cannot be guaranteed. No representation is made with respect to the accuracy, completeness or timeliness of this information. Nothing provided on this site constitutes tax advice. Individuals should seek the advice of their own tax advisor for specific information regarding tax consequences of investments. Investments in securities entail risk and are not suitable for all investors. This site is not a recommendation nor an offer to sell (or solicitation of an offer to buy) securities in the United States or in any other jurisdiction.
References to indexes and benchmarks are hypothetical illustrations of aggregate returns and do not reflect the performance of any actual investment. Investors cannot invest in an index and do not reflect the deduction of the advisor’s fees or other trading expenses. There can be no assurance that current investments will be profitable. Actual realized returns will depend on, among other factors, the value of assets and market conditions at the time of disposition, any related transaction costs, and the timing of the purchase. Indexes and benchmarks may not directly correlate or only partially relate to portfolios managed by SL Advisors as they have different underlying investments and may use different strategies or have different objectives than portfolios managed by SL Advisors (e.g. The Alerian index is a group MLP securities in the oil and gas industries. Portfolios may not include the same investments that are included in the Alerian Index. The S & P Index does not directly relate to investment strategies managed by SL Advisers.)
This site may contain forward-looking statements relating to the objectives, opportunities, and the future performance of the U.S. market generally. Forward-looking statements may be identified by the use of such words as; “believe,” “expect,” “anticipate,” “should,” “planned,” “estimated,” “potential” and other similar terms. Examples of forward-looking statements include, but are not limited to, estimates with respect to financial condition, results of operations, and success or lack of success of any particular investment strategy. All are subject to various factors, including, but not limited to general and local economic conditions, changing levels of competition within certain industries and markets, changes in interest rates, changes in legislation or regulation, and other economic, competitive, governmental, regulatory and technological factors affecting a portfolio’s operations that could cause actual results to differ materially from projected results. Such statements are forward-looking in nature and involves a number of known and unknown risks, uncertainties and other factors, and accordingly, actual results may differ materially from those reflected or contemplated in such forward-looking statements. Prospective investors are cautioned not to place undue reliance on any forward-looking statements or examples. None of SL Advisors LLC or any of its affiliates or principals nor any other individual or entity assumes any obligation to update any forward-looking statements as a result of new information, subsequent events or any other circumstances. All statements made herein speak only as of the date that they were made. r
Certain hyperlinks or referenced websites on the Site, if any, are for your convenience and forward you to third parties’ websites, which generally are recognized by their top level domain name. Any descriptions of, references to, or links to other products, publications or services does not constitute an endorsement, authorization, sponsorship by or affiliation with SL Advisors LLC with respect to any linked site or its sponsor, unless expressly stated by SL Advisors LLC. Any such information, products or sites have not necessarily been reviewed by SL Advisors LLC and are provided or maintained by third parties over whom SL Advisors LLC exercise no control. SL Advisors LLC expressly disclaim any responsibility for the content, the accuracy of the information, and/or quality of products or services provided by or advertised on these third-party sites.
All investment strategies have the potential for profit or loss. Different types of investments involve varying degrees of risk, and there can be no assurance that any specific investment will be suitable or profitable for a client’s investment portfolio.
Past performance of the American Energy Independence Index is not indicative of future returns.


Leave a Reply
Want to join the discussion?Feel free to contribute!