The World Of Natural Gas

/
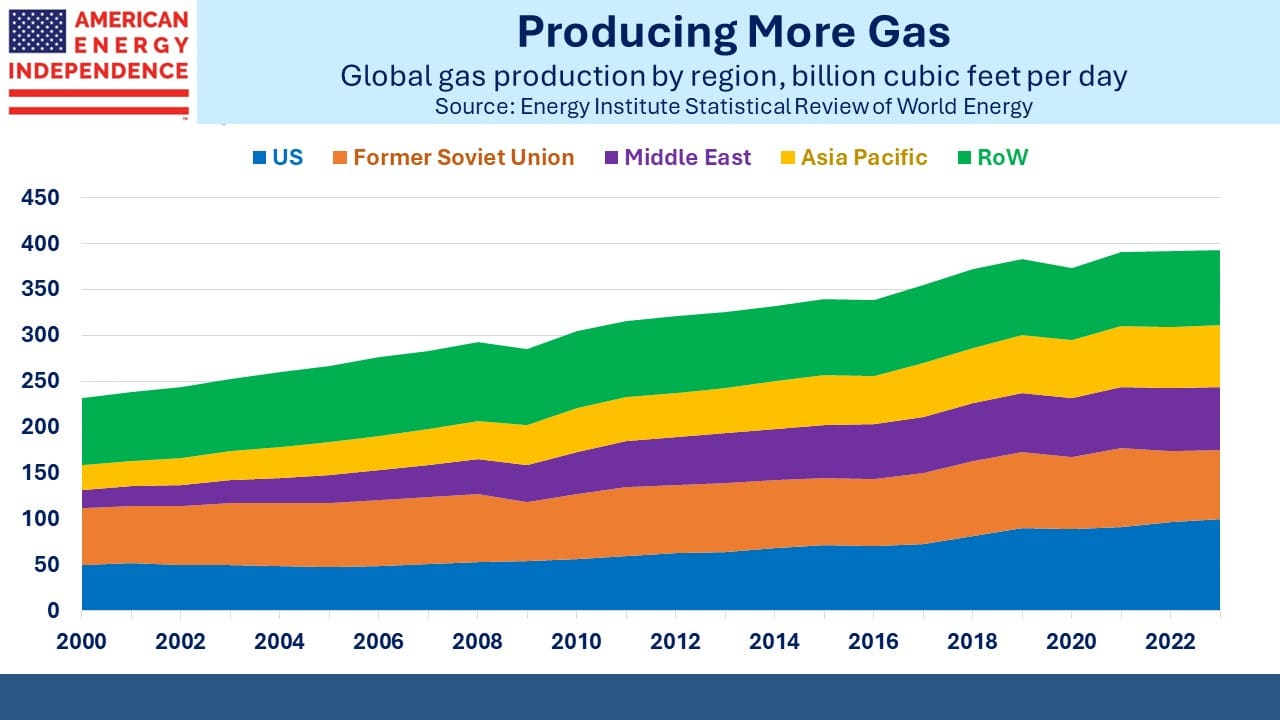
It’s hard to overstate the global success of US natural gas production. Over the past decade we’ve grown output by 37 Billion Cubic Feet per Day (BCF/D), accounting for half the global increase. We now produce over a quarter of the world’s gas. And it’s cheap.
The development of fracking happened in America not elsewhere for many reasons. The geology, water availability, access to capital, technology and a culture of entrepreneurship. Least appreciated is the concept of privately owned mineral rights, which has enabled thousands of landowners to partner with drillers, earning royalties subject to state regulation and taxation.
All over the world except in the US, governments own mineral rights.
Several years ago, a Spanish E&P company found out how hard it is to drill when you’re not welcome. In the north of England, the British government granted Cuadrilla rights to extract natural gas using fracking. The local population was strongly opposed. Britain surely needs natural gas, but the residents living above the reserves saw no financial benefit while enduring all the noise and disruption. It quickly became a political issue and the government backed down (see British Shale Revolution Crushed: America’s Unique Ownership of Oil and Gas).
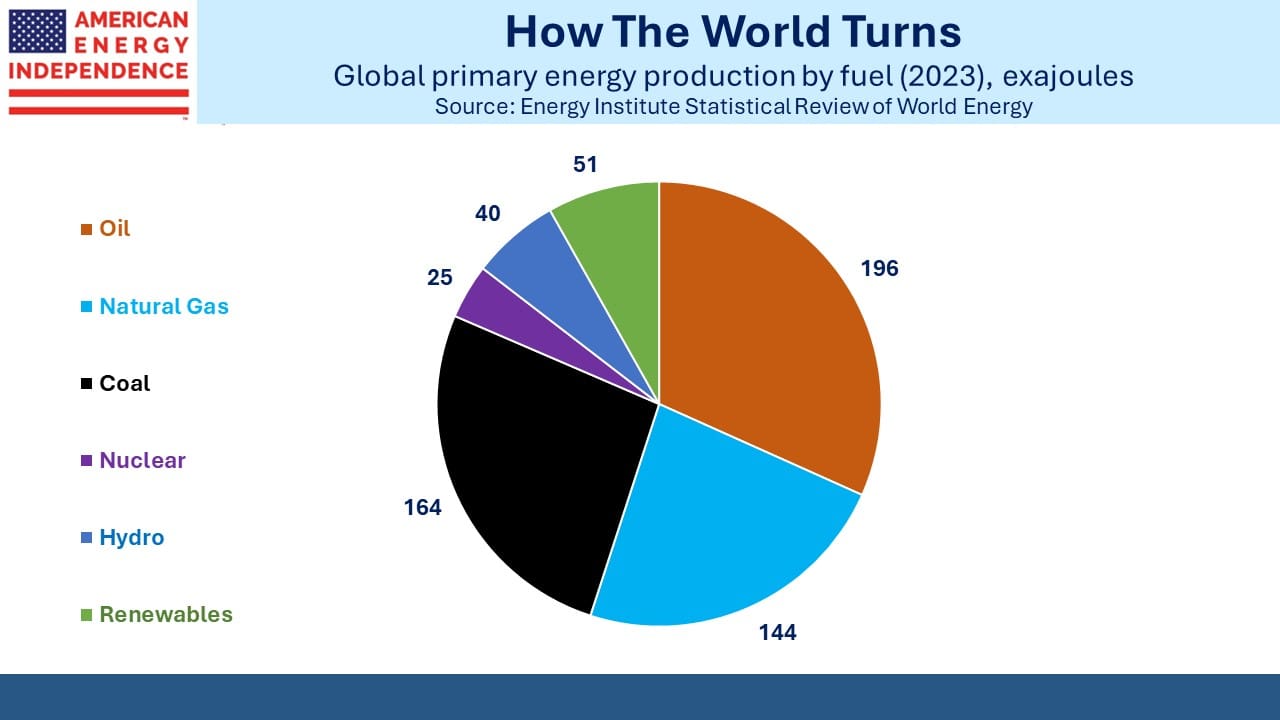
The Energy Institute’s 2024 Statistical Review of World Energy provides informative detail on natural gas, which provides 24% of the world’s primary energy, up from 22% at the start of the century. It’s 23% of the world’s electricity. In the US it provides 43% of our power. Even the International Energy Agency, which has transformed from an objective observer of energy markets to a renewables champion, concedes that last year “Coal-to-gas switching was the largest driver behind emissions reduction in the US electricity sector.”
The US Energy Information Administration (EIA), credits coal to gas switching for 61% of the power sector’s emissions reductions since 2005.
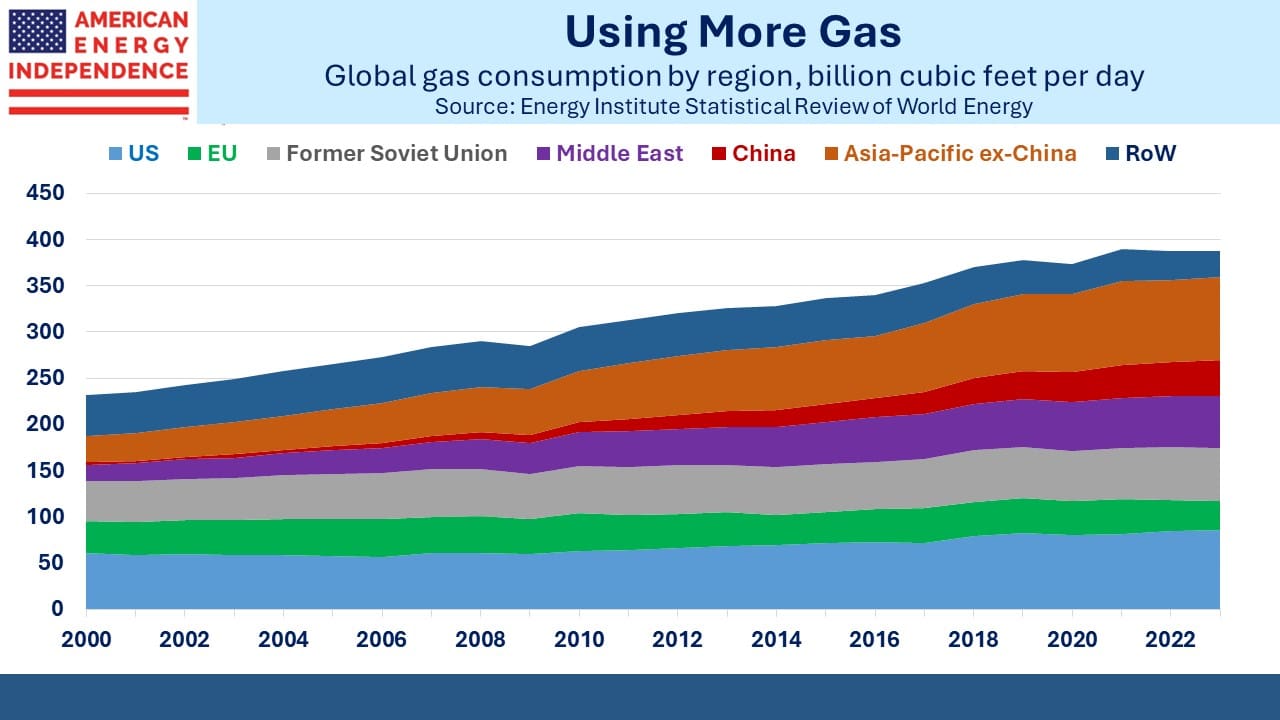
Global consumption has grown broadly, with the notable exception of the EU. Their strategic blunder of reliance on Russian piped gas along with ruinous climate policies have constrained GDP growth (see Natural Gas Demand Keeps Growing). German emissions are falling because they’ve made energy too expensive. They are de-industrializing, to the benefit of the US (see Gains From Energy).
Gas is much harder to transport than oil, so only moves via pipelines or LNG tanker. Transportation costs are a much bigger percentage of the value of the commodity than for oil. Shipping costs from the US to Europe via LNG tanker are $1.50-$2 per Million BTUs (MMBTUs), but liquefaction can add another $2-$3.50. With US spot gas prices at $2, that still leaves a profit margin vs Europe’s TTF benchmark at around $10, but this shows why large regional price differences persist.
Shipping crude oil over the same route is around $2-$4 per barrel, so a much smaller percentage of the value of the commodity.
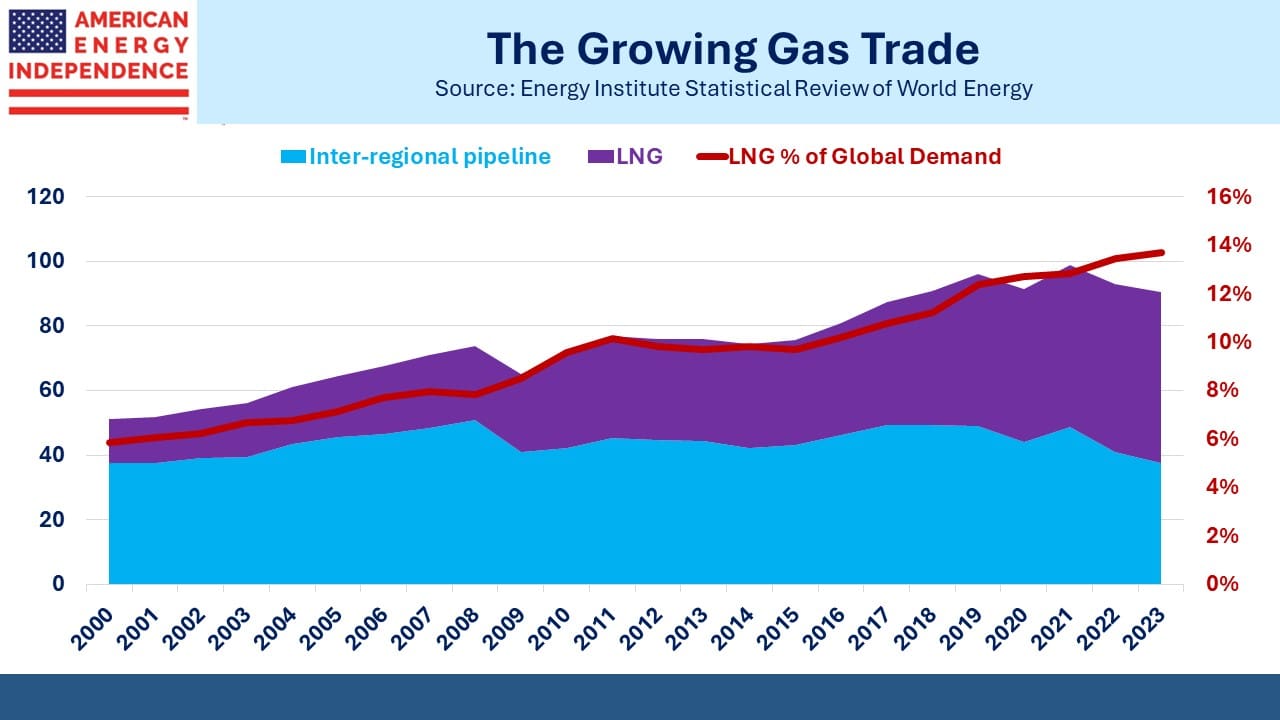
Nonetheless, global trade in LNG is growing, even while intra-regional pipeline trade has shrunk with the loss of Russian shipments to the EU. Almost 14% of natural gas was shipped as LNG last year, up from only 6% in 2000. Pipelines represented another 10%.
LNG provides both buyer and seller optionality in a world more prone to geopolitical trade disruption. Pipelines linking neighboring countries require extremely stable relationships (think US/Canada, or UK/Norway). Nordstream 2 had its gas supply cut before it flooded with seawater after a sabotage. Pipelines reduce flexibility for both parties. It’s why the China-Russia negotiations over Power of Siberia 2 continue to drag on.
By contrast, the global oil trade was 68 million barrels per day last year, around two thirds of consumption. Oil and gas reserves are unevenly distributed. Coal trade was only 21% of consumption. It’s easy to move, but reserves are widely distributed. It’s why developing countries use so much of it – because it’s easily accessible.
Natural gas consumption will continue to grow, to meet the developing world’s relentless demand for more energy. Policymakers may even acknowledge that renewables are hopelessly inadequate to replace fossil fuels and instead emulate the US success by prioritizing coal-to-gas switching.
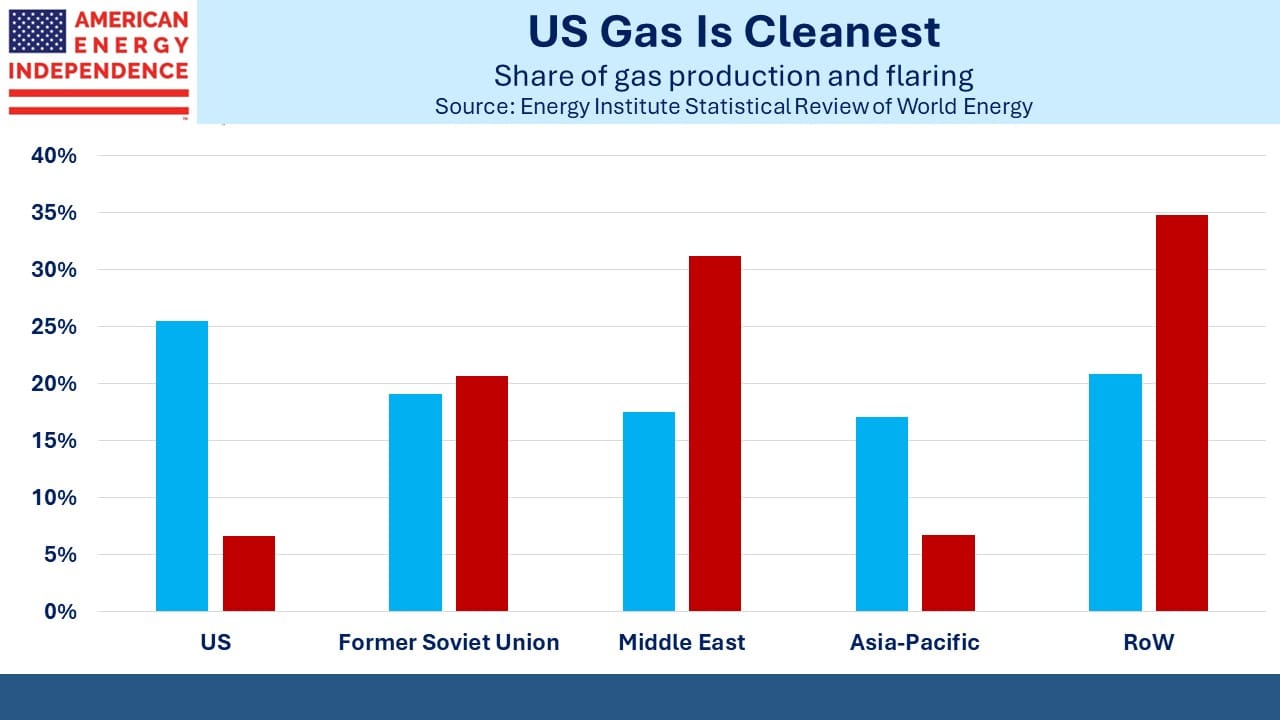
Gas generates around half the CO2 of coal when burned for power, and also generates far less local pollution. Critics argue that flaring and methane leaks offset this advantage. However, the US is far stricter on flaring than other big producing regions such as Russia or the Middle East. We produce 26% of the world’s supply but only 7% of the flaring.
This all highlights the huge opportunity of US natural gas. Our supplies can help poorer countries meet their growing energy needs, while displacing more damaging coal. And because our environmental standards are higher than in Russia or Iran, our natural gas is a more climate-friendly product.
The simpletons at the Sierra Club and the knuckle draggers at Extinction Rebellion who hurl paint in art galleries will never embrace this. But increased US exports of natural gas are the most effective way to reduce CO2 emissions. In our opinion it offers continued attractive returns, and by delivering what is expected rather than unmet promises, it is the most ethical investment in the energy sector.
We have three have funds that seek to profit from this environment:

Important Disclosures
The information provided is for informational purposes only and investors should determine for themselves whether a particular service, security or product is suitable for their investment needs. The information contained herein is not complete, may not be current, is subject to change, and is subject to, and qualified in its entirety by, the more complete disclosures, risk factors and other terms that are contained in the disclosure, prospectus, and offering. Certain information herein has been obtained from third party sources and, although believed to be reliable, has not been independently verified and its accuracy or completeness cannot be guaranteed. No representation is made with respect to the accuracy, completeness or timeliness of this information. Nothing provided on this site constitutes tax advice. Individuals should seek the advice of their own tax advisor for specific information regarding tax consequences of investments. Investments in securities entail risk and are not suitable for all investors. This site is not a recommendation nor an offer to sell (or solicitation of an offer to buy) securities in the United States or in any other jurisdiction.
References to indexes and benchmarks are hypothetical illustrations of aggregate returns and do not reflect the performance of any actual investment. Investors cannot invest in an index and do not reflect the deduction of the advisor’s fees or other trading expenses. There can be no assurance that current investments will be profitable. Actual realized returns will depend on, among other factors, the value of assets and market conditions at the time of disposition, any related transaction costs, and the timing of the purchase. Indexes and benchmarks may not directly correlate or only partially relate to portfolios managed by SL Advisors as they have different underlying investments and may use different strategies or have different objectives than portfolios managed by SL Advisors (e.g. The Alerian index is a group MLP securities in the oil and gas industries. Portfolios may not include the same investments that are included in the Alerian Index. The S & P Index does not directly relate to investment strategies managed by SL Advisers.)
This site may contain forward-looking statements relating to the objectives, opportunities, and the future performance of the U.S. market generally. Forward-looking statements may be identified by the use of such words as; “believe,” “expect,” “anticipate,” “should,” “planned,” “estimated,” “potential” and other similar terms. Examples of forward-looking statements include, but are not limited to, estimates with respect to financial condition, results of operations, and success or lack of success of any particular investment strategy. All are subject to various factors, including, but not limited to general and local economic conditions, changing levels of competition within certain industries and markets, changes in interest rates, changes in legislation or regulation, and other economic, competitive, governmental, regulatory and technological factors affecting a portfolio’s operations that could cause actual results to differ materially from projected results. Such statements are forward-looking in nature and involves a number of known and unknown risks, uncertainties and other factors, and accordingly, actual results may differ materially from those reflected or contemplated in such forward-looking statements. Prospective investors are cautioned not to place undue reliance on any forward-looking statements or examples. None of SL Advisors LLC or any of its affiliates or principals nor any other individual or entity assumes any obligation to update any forward-looking statements as a result of new information, subsequent events or any other circumstances. All statements made herein speak only as of the date that they were made. r
Certain hyperlinks or referenced websites on the Site, if any, are for your convenience and forward you to third parties’ websites, which generally are recognized by their top level domain name. Any descriptions of, references to, or links to other products, publications or services does not constitute an endorsement, authorization, sponsorship by or affiliation with SL Advisors LLC with respect to any linked site or its sponsor, unless expressly stated by SL Advisors LLC. Any such information, products or sites have not necessarily been reviewed by SL Advisors LLC and are provided or maintained by third parties over whom SL Advisors LLC exercise no control. SL Advisors LLC expressly disclaim any responsibility for the content, the accuracy of the information, and/or quality of products or services provided by or advertised on these third-party sites.
All investment strategies have the potential for profit or loss. Different types of investments involve varying degrees of risk, and there can be no assurance that any specific investment will be suitable or profitable for a client’s investment portfolio.
Past performance of the American Energy Independence Index is not indicative of future returns.


Leave a Reply
Want to join the discussion?Feel free to contribute!