Cash Returns Drive Performance

/
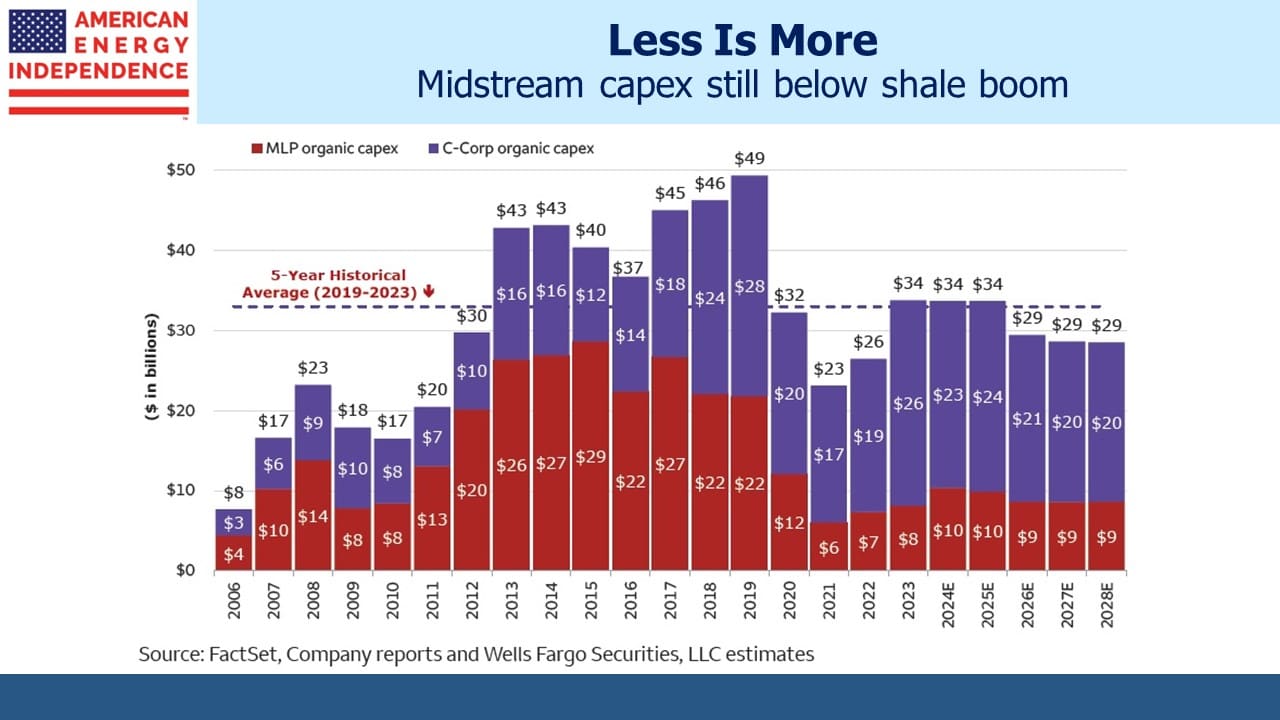
One casualty of the shale revolution was the MLP financing model. The General Partner (GP) would typically direct its MLP to finance assets that were “dropped down” from the GP. MLP capex and M&A more than tripled from 2010 to 2015. Cash returns too often came up short of those promised, and investors lost confidence in many management teams’ ability to generate a Return On Invested Capital (ROIC) above their Weighted Average Cost of Capital (WACC).
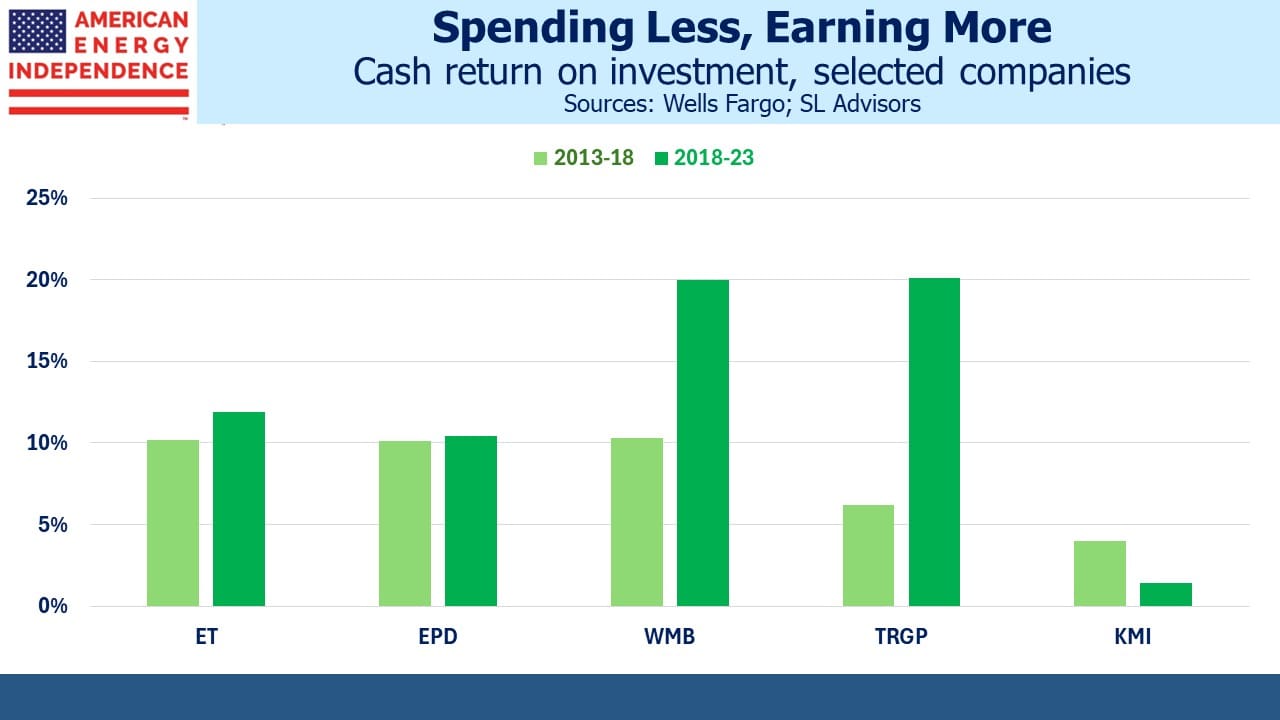
Stock prices fell, MLPs converted to c-corps with distribution cuts led by Kinder Morgan, and midstream capex fell by more than half. Many management teams responded with greater discipline on new spending, and cash returns on capex started to rise. In some cases the improvement was dramatic. Wells Fargo calculates that Williams Companies (WMB) generated a 20.0% ROIC over the past five years, almost double the 10.3% they earned during 2013-18 period.
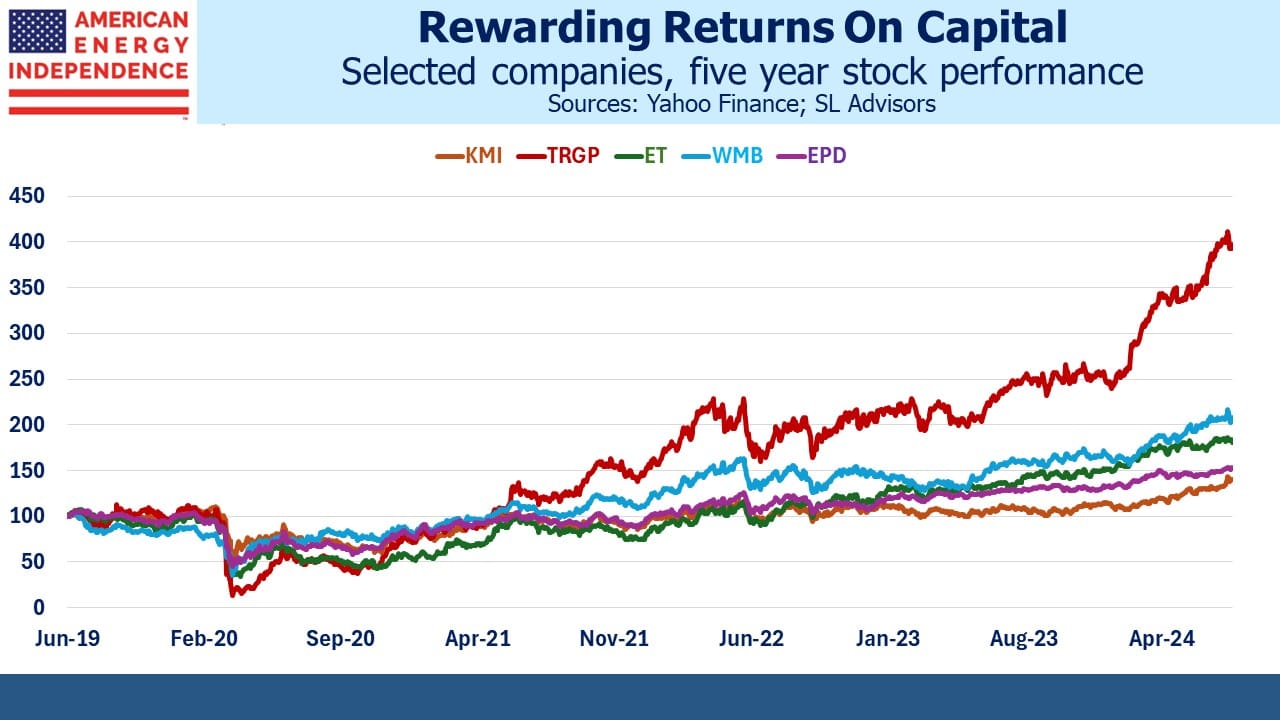
Targa Resources (TRGP) jumped from a miserable 6.2% to 20.1%. Former CEO Joe Bob Perkins used to call their capex opportunities “capital blessings”, to the frustration of sell-side analysts who didn’t feel very blessed. But the improved ROIC of recent years is behind the stock’s strong performance.
Industry capex remains well below the 2017-19 peak. The question for investors is whether a Trump victory will cause a resurgence in the optimism that led to higher spending and disappointing results.
One area where this is already happening is in more natural gas to support AI data centers. Wells Fargo estimates that WMB is investing $1.3B of capex into SESE at a 5x return, meaning when completed it’ll generate EBITDA of around $260MM annually, a 20% ROIC. Kinder Morgan (KMI) is investing $1.5BN into their SNG South System 4 expansion project at a 6X multiple (~18% ROIC). Both projects will help meet the increasing need for electricity from the AI boom.
KMI missed expectations on earnings last week, but the stock nonetheless rose because of the SNG news. Investors looked ahead to the accretion from this and up to 5 Billion Cubic Feet per Day of growth opportunities. The irony is that KMI is among the worst allocators of capital in the sector. Wells Fargo calculates a five year trailing return of only 1.4%. The five years prior was 4.0%.
Several years ago we engaged KMI on this topic (see Kinder Morgan’s Slick Numeracy). Their chronic misallocation of capital dates back to when Kim Dang was CFO. She’s now the CEO, and when appointed last year promised to maintain “business as usual.” The stock’s positive response to AI power demand reflects a hope that Dang is a better judge of accretive projects than in the past.
Over the past five years the market has favored companies with above average skill at deploying capital. KMI could benefit from the Targa Touch.
Proponents of windpower will be disappointed to have seen that wind output reached a 33-month low recently. Fortunately, natural gas made up the difference when hot weather boosted demand for air conditioning. Output from gas-fired power plants of 6.9 Terawatt Hours (TWhs) was, according to the Energy Information Administration “probably the most in history.”
The poor wind output is even more disappointing when you consider that we keep adding capacity. Last year wind generated 425 TWhs, down 2.1% from 2022. We have 147.5 Gigawatts of capacity which is theoretically capable of producing 1,292 TWhs annually (i.e. 147.5 X 365 X 24). So US wind operates at around 32% of capacity.
This is why it’s so misleading when progressives assert that renewables are cheap. They ignore the weather-dependent intermittency of solar and wind whose growth increases the need for excess capacity to compensate. It’s one reason why US electricity prices are rising even though the price of natural gas, which is the biggest source of power, remains low. Grids with more renewables need greater redundancy for when it’s not sunny or windy.
France gets about two thirds of its electricity from nuclear power. This is a constant reminder that carbon-free energy is available to other western governments able to design an approval process that allows predictable outcomes. Currently, constructing new nuclear exposes investors to the uncertainties of persistent legal challenges, making it hard to project IRR.
The CEO of France’s EDF recently complained about excessive subsidies for solar, which are distorting electricity markets by forcing EDF to buy solar power under the country’s complicated rules. They’re planning to add six new nuclear plants, although the recent French election has left political support unclear.
US energy policy is not perfect but has mostly avoided the distorting effects of blindly embracing renewables that is seen in many European countries.
We have three have funds that seek to profit from this environment:

Important Disclosures
The information provided is for informational purposes only and investors should determine for themselves whether a particular service, security or product is suitable for their investment needs. The information contained herein is not complete, may not be current, is subject to change, and is subject to, and qualified in its entirety by, the more complete disclosures, risk factors and other terms that are contained in the disclosure, prospectus, and offering. Certain information herein has been obtained from third party sources and, although believed to be reliable, has not been independently verified and its accuracy or completeness cannot be guaranteed. No representation is made with respect to the accuracy, completeness or timeliness of this information. Nothing provided on this site constitutes tax advice. Individuals should seek the advice of their own tax advisor for specific information regarding tax consequences of investments. Investments in securities entail risk and are not suitable for all investors. This site is not a recommendation nor an offer to sell (or solicitation of an offer to buy) securities in the United States or in any other jurisdiction.
References to indexes and benchmarks are hypothetical illustrations of aggregate returns and do not reflect the performance of any actual investment. Investors cannot invest in an index and do not reflect the deduction of the advisor’s fees or other trading expenses. There can be no assurance that current investments will be profitable. Actual realized returns will depend on, among other factors, the value of assets and market conditions at the time of disposition, any related transaction costs, and the timing of the purchase. Indexes and benchmarks may not directly correlate or only partially relate to portfolios managed by SL Advisors as they have different underlying investments and may use different strategies or have different objectives than portfolios managed by SL Advisors (e.g. The Alerian index is a group MLP securities in the oil and gas industries. Portfolios may not include the same investments that are included in the Alerian Index. The S & P Index does not directly relate to investment strategies managed by SL Advisers.)
This site may contain forward-looking statements relating to the objectives, opportunities, and the future performance of the U.S. market generally. Forward-looking statements may be identified by the use of such words as; “believe,” “expect,” “anticipate,” “should,” “planned,” “estimated,” “potential” and other similar terms. Examples of forward-looking statements include, but are not limited to, estimates with respect to financial condition, results of operations, and success or lack of success of any particular investment strategy. All are subject to various factors, including, but not limited to general and local economic conditions, changing levels of competition within certain industries and markets, changes in interest rates, changes in legislation or regulation, and other economic, competitive, governmental, regulatory and technological factors affecting a portfolio’s operations that could cause actual results to differ materially from projected results. Such statements are forward-looking in nature and involves a number of known and unknown risks, uncertainties and other factors, and accordingly, actual results may differ materially from those reflected or contemplated in such forward-looking statements. Prospective investors are cautioned not to place undue reliance on any forward-looking statements or examples. None of SL Advisors LLC or any of its affiliates or principals nor any other individual or entity assumes any obligation to update any forward-looking statements as a result of new information, subsequent events or any other circumstances. All statements made herein speak only as of the date that they were made. r
Certain hyperlinks or referenced websites on the Site, if any, are for your convenience and forward you to third parties’ websites, which generally are recognized by their top level domain name. Any descriptions of, references to, or links to other products, publications or services does not constitute an endorsement, authorization, sponsorship by or affiliation with SL Advisors LLC with respect to any linked site or its sponsor, unless expressly stated by SL Advisors LLC. Any such information, products or sites have not necessarily been reviewed by SL Advisors LLC and are provided or maintained by third parties over whom SL Advisors LLC exercise no control. SL Advisors LLC expressly disclaim any responsibility for the content, the accuracy of the information, and/or quality of products or services provided by or advertised on these third-party sites.
All investment strategies have the potential for profit or loss. Different types of investments involve varying degrees of risk, and there can be no assurance that any specific investment will be suitable or profitable for a client’s investment portfolio.
Past performance of the American Energy Independence Index is not indicative of future returns.


Leave a Reply
Want to join the discussion?Feel free to contribute!