Cash Returns Drive Performance
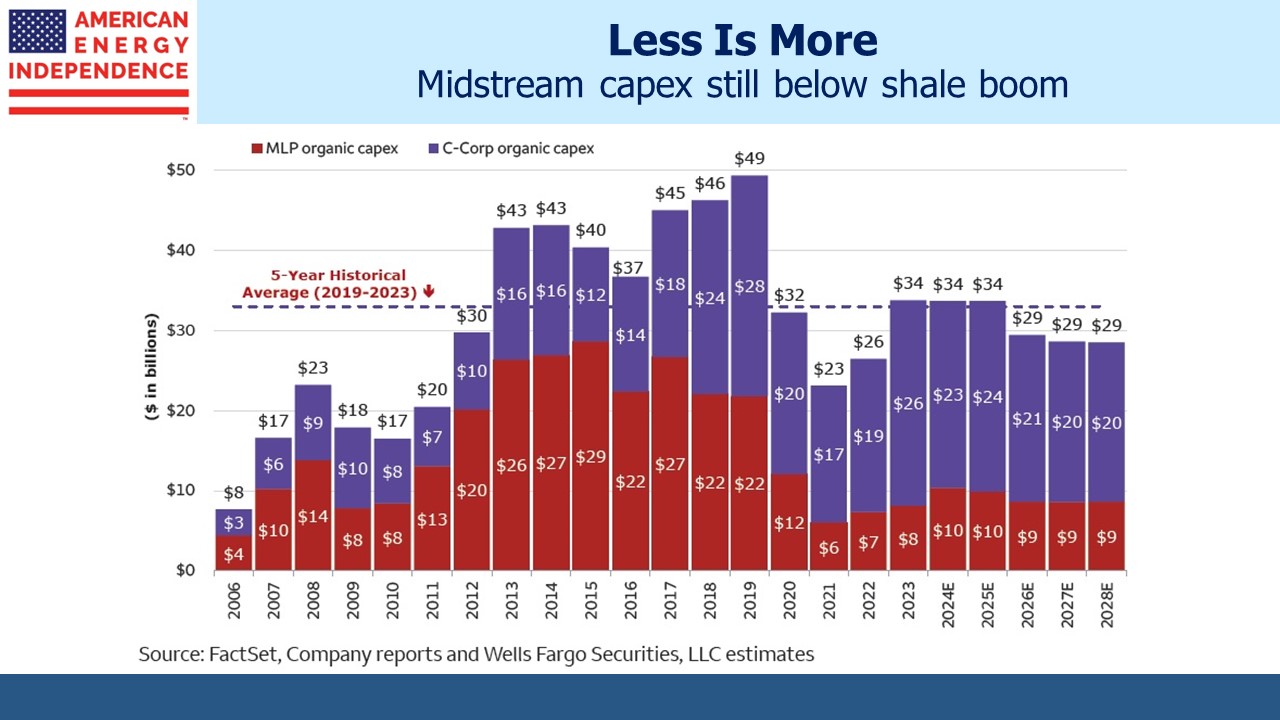
One casualty of the shale revolution was the MLP financing model. The General Partner (GP) would typically direct its MLP to finance assets that were “dropped down” from the GP. MLP capex and M&A more than tripled from 2010 to 2015. Cash returns too often came up short of those promised, and investors lost confidence in many management teams’ ability to generate a Return On Invested Capital (ROIC) above their Weighted Average Cost of Capital (WACC).
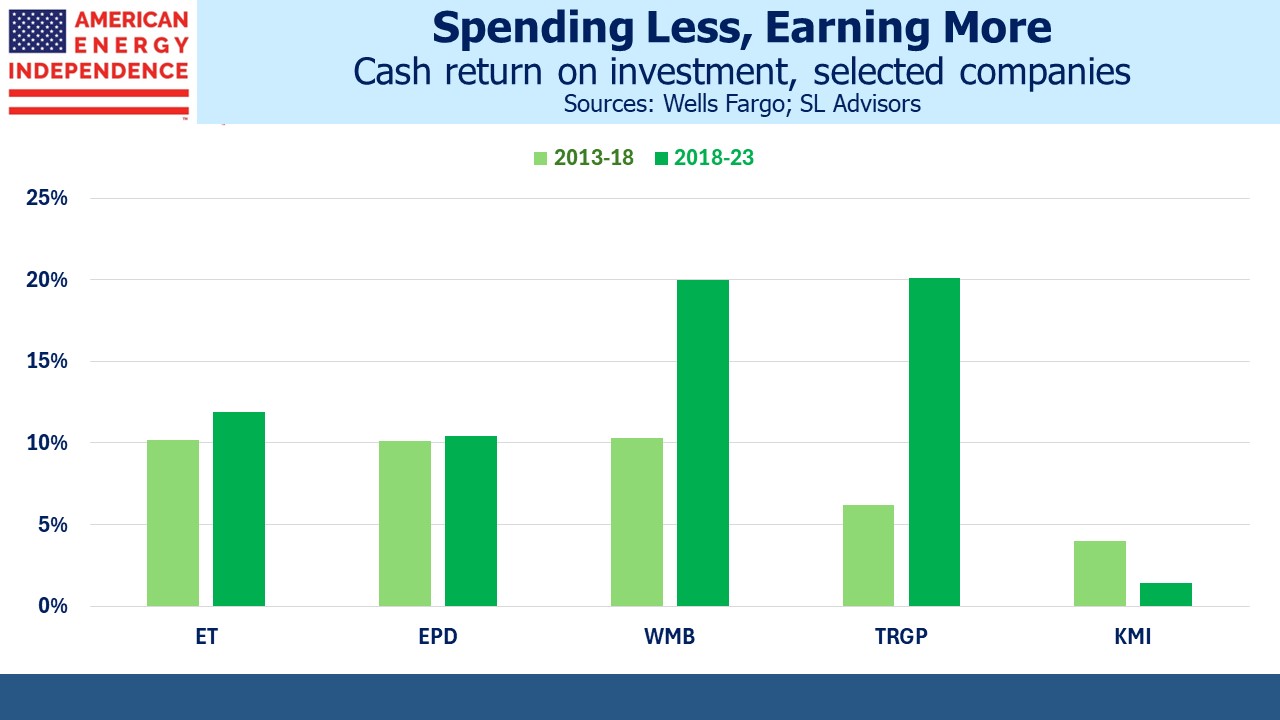
Stock prices fell, MLPs converted to c-corps with distribution cuts led by Kinder Morgan, and midstream capex fell by more than half. Many management teams responded with greater discipline on new spending, and cash returns on capex started to rise. In some cases the improvement was dramatic. Wells Fargo calculates that Williams Companies (WMB) generated a 20.0% ROIC over the past five years, almost double the 10.3% they earned during 2013-18 period.
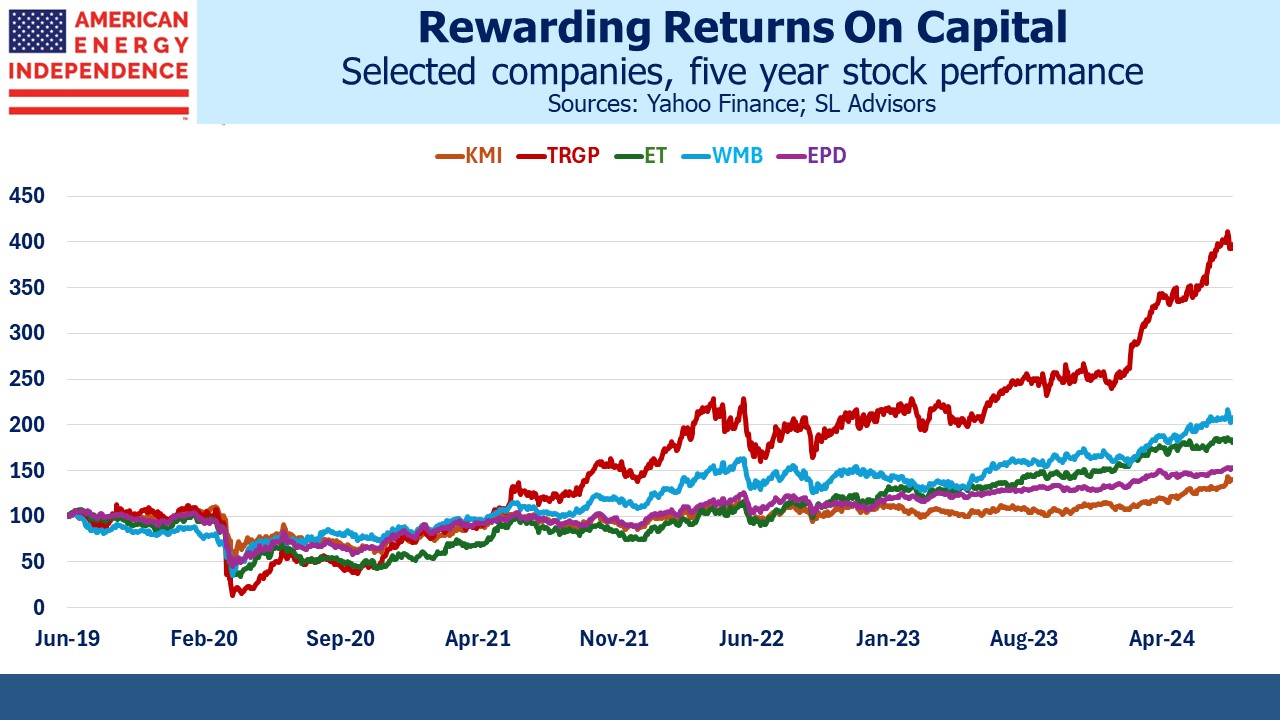
Targa Resources (TRGP) jumped from a miserable 6.2% to 20.1%. Former CEO Joe Bob Perkins used to call their capex opportunities “capital blessings”, to the frustration of sell-side analysts who didn’t feel very blessed. But the improved ROIC of recent years is behind the stock’s strong performance.
Industry capex remains well below the 2017-19 peak. The question for investors is whether a Trump victory will cause a resurgence in the optimism that led to higher spending and disappointing results.
One area where this is already happening is in more natural gas to support AI data centers. Wells Fargo estimates that WMB is investing $1.3B of capex into SESE at a 5x return, meaning when completed it’ll generate EBITDA of around $260MM annually, a 20% ROIC. Kinder Morgan (KMI) is investing $1.5BN into their SNG South System 4 expansion project at a 6X multiple (~18% ROIC). Both projects will help meet the increasing need for electricity from the AI boom.
KMI missed expectations on earnings last week, but the stock nonetheless rose because of the SNG news. Investors looked ahead to the accretion from this and up to 5 Billion Cubic Feet per Day of growth opportunities. The irony is that KMI is among the worst allocators of capital in the sector. Wells Fargo calculates a five year trailing return of only 1.4%. The five years prior was 4.0%.
Several years ago we engaged KMI on this topic (see Kinder Morgan’s Slick Numeracy). Their chronic misallocation of capital dates back to when Kim Dang was CFO. She’s now the CEO, and when appointed last year promised to maintain “business as usual.” The stock’s positive response to AI power demand reflects a hope that Dang is a better judge of accretive projects than in the past.
Over the past five years the market has favored companies with above average skill at deploying capital. KMI could benefit from the Targa Touch.
Proponents of windpower will be disappointed to have seen that wind output reached a 33-month low recently. Fortunately, natural gas made up the difference when hot weather boosted demand for air conditioning. Output from gas-fired power plants of 6.9 Terawatt Hours (TWhs) was, according to the Energy Information Administration “probably the most in history.”
The poor wind output is even more disappointing when you consider that we keep adding capacity. Last year wind generated 425 TWhs, down 2.1% from 2022. We have 147.5 Gigawatts of capacity which is theoretically capable of producing 1,292 TWhs annually (i.e. 147.5 X 365 X 24). So US wind operates at around 32% of capacity.
This is why it’s so misleading when progressives assert that renewables are cheap. They ignore the weather-dependent intermittency of solar and wind whose growth increases the need for excess capacity to compensate. It’s one reason why US electricity prices are rising even though the price of natural gas, which is the biggest source of power, remains low. Grids with more renewables need greater redundancy for when it’s not sunny or windy.
France gets about two thirds of its electricity from nuclear power. This is a constant reminder that carbon-free energy is available to other western governments able to design an approval process that allows predictable outcomes. Currently, constructing new nuclear exposes investors to the uncertainties of persistent legal challenges, making it hard to project IRR.
The CEO of France’s EDF recently complained about excessive subsidies for solar, which are distorting electricity markets by forcing EDF to buy solar power under the country’s complicated rules. They’re planning to add six new nuclear plants, although the recent French election has left political support unclear.
US energy policy is not perfect but has mostly avoided the distorting effects of blindly embracing renewables that is seen in many European countries.
We have three have funds that seek to profit from this environment:


