America Seizes Oil Throne
Last week the U.S. became the world’s biggest crude oil producer. Not everyone agrees – Russian production figures still show them ahead. But the Energy Information Administration (EIA) is confident that we are, and that we’re going to stay there at least through next year.
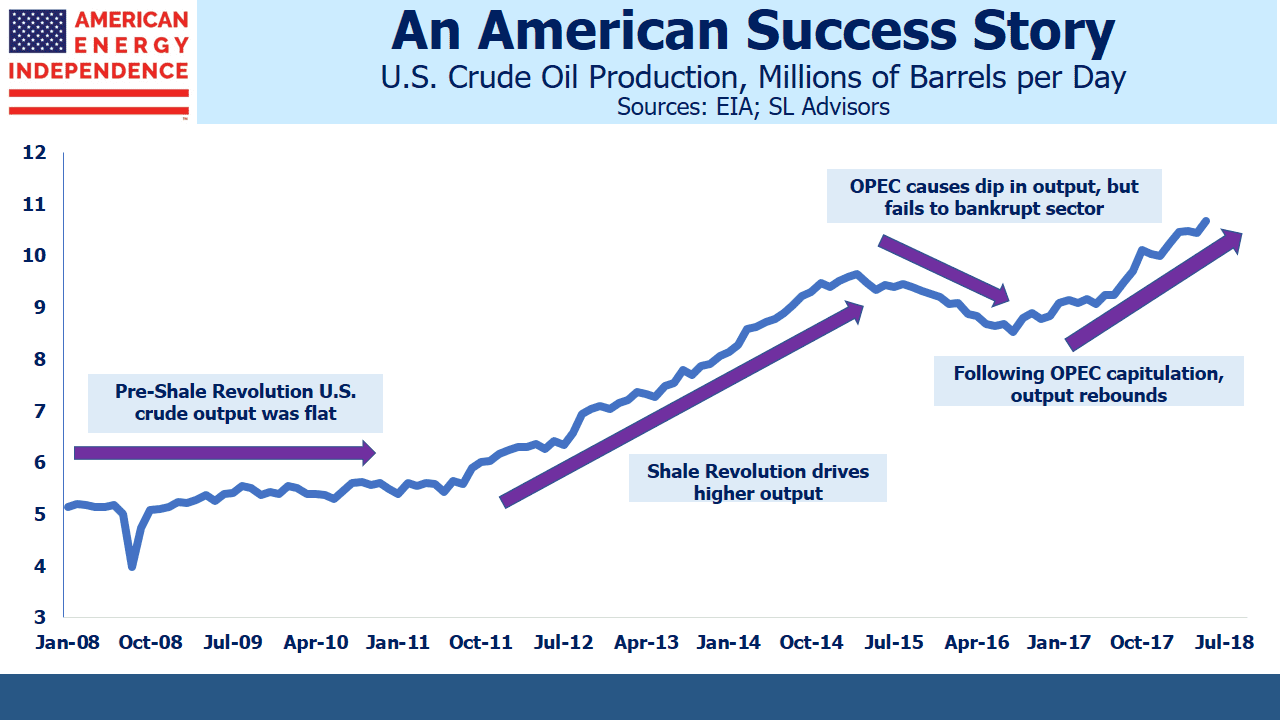
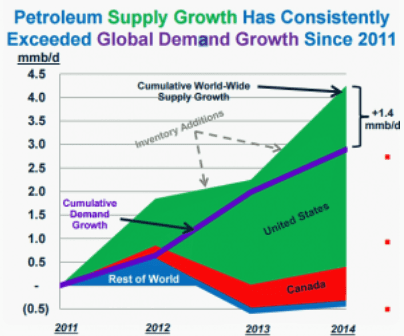
This represents a milestone in the path towards American Energy Independence. Only 10 years ago, U.S. output was 5 Million Barrels per Day (MMB/D) and was in decline. Today it’s reached 11MMB/D and is growing rapidly. Horizontal drilling and hydraulic fracturing unlocked the huge reserves in shale formations, and the decline was arrested. Over the next several years U.S. output grew sufficiently to more than meet global demand growth.
In 2014 Plains All American (PAGP) produced a powerful chart showing how North American crude was gaining market share. OPEC finally tired of their commensurate lost share which they believed was hurting their revenues. The subsequent 2014-16 energy sector collapse was OPEC’s attempt to bankrupt America’s nascent shale industry, to blunt the growth of this new oil producer. Although the financial pain was widespread, the industry didn’t break. American capitalism responded – costs were slashed, productivity enhanced and a leaner, stronger shale industry emerged.
OPEC relented (see OPEC Blinks), concluding low prices were damaging their members more than the shale upstarts. U.S. production began rising again. It passed its 2014 high last year, and last week took the world’s top oil producer spot, well ahead of many forecasts.
It’s an epic story, with significant consequences across geopolitics, trade and the environment. America’s improved energy security is underwriting a more robust approach to Iran. In the 1970s, support for Israel in its wars against Arab states led to gas lines as OPEC’s flexed its muscle and imposed an oil embargo.
American exports of Liquified Natural Gas (LNG) are creating new trade opportunities with Asia, where South Korea, China and Japan are among our biggest buyers. In spite of the escalating tariffs with China, they recently exempted U.S. crude oil imports from a list of items subject to new tariffs. Germany’s plan to buy more natural gas from Russia via Nord Stream 2 is more easily criticized when U.S. LNG is available. Trump’s tweet, “What good is NATO if Germany is paying Russia billions of dollars for gas and energy?” is hard to fault.
American Shale gas has contributed to the world’s biggest reduction in CO2 emissions (see Guess Who’s Most Effective at Combating Global Warming). It’s made possible the shift from coal to natural gas in electricity generation. The Shale Revolution has been positive in so many ways.
Although few stop to think about it, the Shale Revolution reflects the success of American capitalism. Oil and gas originate in porous rock all over the world, but it’s taken a unique combination of advantages for the U.S. to emerge as virtually the only shale player on the planet. In America Is Great! we list the many attributes whose presence was necessary, such as a skilled energy sector labor force, existing infrastructure, access to capital, advanced technology and so on. Apart from the geology, they’re all the results of America’s capitalist system. The least appreciated is privately-owned mineral rights. All over the world, an individual’s property ownership is limited to the surface, with the government owning what’s beneath. By contrast, American landowners have been able to profit from their mineral rights. This has created private sector wealth in a way that a government claiming eminent domain of a lucrative property never could.
All this means that the Shale Revolution was not luck; if it was going to happen anywhere, it was going to be in America.
The energy infrastructure sector has been lethargic over the past few weeks. 2Q18 earnings were strong, but investor positivity was fleeting. Since early August, flows have been light and buyers cautious. The Alerian MLP ETF (AMLP) has seen outflows on most days, although that may be because people are becoming aware of its flawed tax structure (see Uncle Sam Helps You Short AMLP).
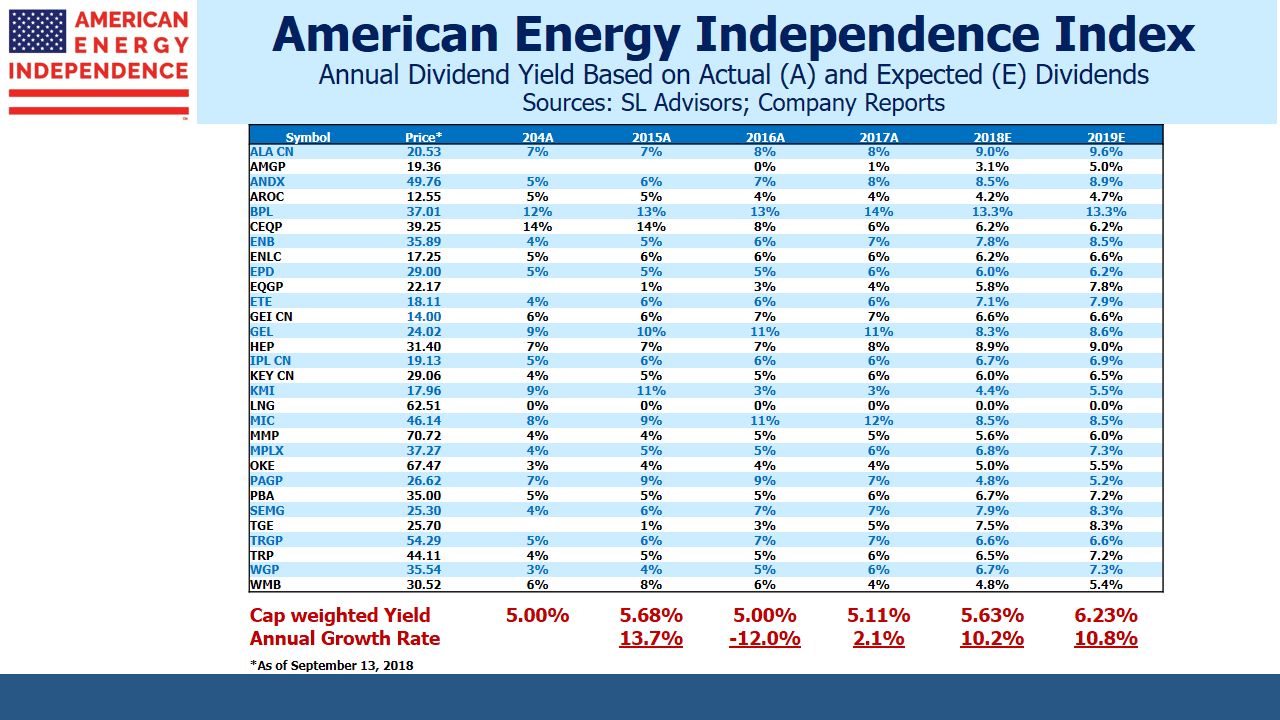
Record U.S. oil production should serve as a reminder that pipeline companies are the vital enablers of our energy success. Cash flow yields on the American Energy Independence Index are 8.75% and we expect 15-20% annual cash flow growth this year and next. The dividend yield is 5.6% and growing 10%/year. Hydrocarbons have to be processed, stored and moved; record volumes should support 3Q18 profits when they start being reported next month.
We are long PAGP.
We are short AMLP.
Important Disclosures
The information provided is for informational purposes only and investors should determine for themselves whether a particular service, security or product is suitable for their investment needs. The information contained herein is not complete, may not be current, is subject to change, and is subject to, and qualified in its entirety by, the more complete disclosures, risk factors and other terms that are contained in the disclosure, prospectus, and offering. Certain information herein has been obtained from third party sources and, although believed to be reliable, has not been independently verified and its accuracy or completeness cannot be guaranteed. No representation is made with respect to the accuracy, completeness or timeliness of this information. Nothing provided on this site constitutes tax advice. Individuals should seek the advice of their own tax advisor for specific information regarding tax consequences of investments. Investments in securities entail risk and are not suitable for all investors. This site is not a recommendation nor an offer to sell (or solicitation of an offer to buy) securities in the United States or in any other jurisdiction.
References to indexes and benchmarks are hypothetical illustrations of aggregate returns and do not reflect the performance of any actual investment. Investors cannot invest in an index and do not reflect the deduction of the advisor’s fees or other trading expenses. There can be no assurance that current investments will be profitable. Actual realized returns will depend on, among other factors, the value of assets and market conditions at the time of disposition, any related transaction costs, and the timing of the purchase. Indexes and benchmarks may not directly correlate or only partially relate to portfolios managed by SL Advisors as they have different underlying investments and may use different strategies or have different objectives than portfolios managed by SL Advisors (e.g. The Alerian index is a group MLP securities in the oil and gas industries. Portfolios may not include the same investments that are included in the Alerian Index. The S & P Index does not directly relate to investment strategies managed by SL Advisers.)
This site may contain forward-looking statements relating to the objectives, opportunities, and the future performance of the U.S. market generally. Forward-looking statements may be identified by the use of such words as; “believe,” “expect,” “anticipate,” “should,” “planned,” “estimated,” “potential” and other similar terms. Examples of forward-looking statements include, but are not limited to, estimates with respect to financial condition, results of operations, and success or lack of success of any particular investment strategy. All are subject to various factors, including, but not limited to general and local economic conditions, changing levels of competition within certain industries and markets, changes in interest rates, changes in legislation or regulation, and other economic, competitive, governmental, regulatory and technological factors affecting a portfolio’s operations that could cause actual results to differ materially from projected results. Such statements are forward-looking in nature and involves a number of known and unknown risks, uncertainties and other factors, and accordingly, actual results may differ materially from those reflected or contemplated in such forward-looking statements. Prospective investors are cautioned not to place undue reliance on any forward-looking statements or examples. None of SL Advisors LLC or any of its affiliates or principals nor any other individual or entity assumes any obligation to update any forward-looking statements as a result of new information, subsequent events or any other circumstances. All statements made herein speak only as of the date that they were made. r
Certain hyperlinks or referenced websites on the Site, if any, are for your convenience and forward you to third parties’ websites, which generally are recognized by their top level domain name. Any descriptions of, references to, or links to other products, publications or services does not constitute an endorsement, authorization, sponsorship by or affiliation with SL Advisors LLC with respect to any linked site or its sponsor, unless expressly stated by SL Advisors LLC. Any such information, products or sites have not necessarily been reviewed by SL Advisors LLC and are provided or maintained by third parties over whom SL Advisors LLC exercise no control. SL Advisors LLC expressly disclaim any responsibility for the content, the accuracy of the information, and/or quality of products or services provided by or advertised on these third-party sites.
All investment strategies have the potential for profit or loss. Different types of investments involve varying degrees of risk, and there can be no assurance that any specific investment will be suitable or profitable for a client’s investment portfolio.
Past performance of the American Energy Independence Index is not indicative of future returns.


Leave a Reply
Want to join the discussion?Feel free to contribute!