MLP Distributions Through the Looking Glass

Alerian’s page showing annual distribution growth for the Alerian MLP Index (AMZ) contains their most popular chart (it’s the 4th one down under “Figures and Tables”). It’s no wonder – the steadily growing distributions it portrays should be enough to calm any income seeking, excitement-averse investor. Since it’s their most viewed page, many investors must have drawn comfort from the reliability it presents. The turmoil endured by MLP investors since 2014 appears incongruous when such steady growth in payouts is considered.

Oddly, investors who hold securities linked to the index (such as the JPMorgan Alerian MLP Index ETN: AMJ) have not enjoyed the distribution growth presented by the index. It’s because of Alerian’s curious method of calculation.

The components of the index are updated periodically based on criteria set by Alerian. The growth figure they calculate takes the index members at the end of the year, and looks back to calculate the year-over-year growth rate they experienced. Some of those names may not have been in the index over the prior two years, and perhaps more importantly those names that have been dropped (often because they cut their payout) are excluded.

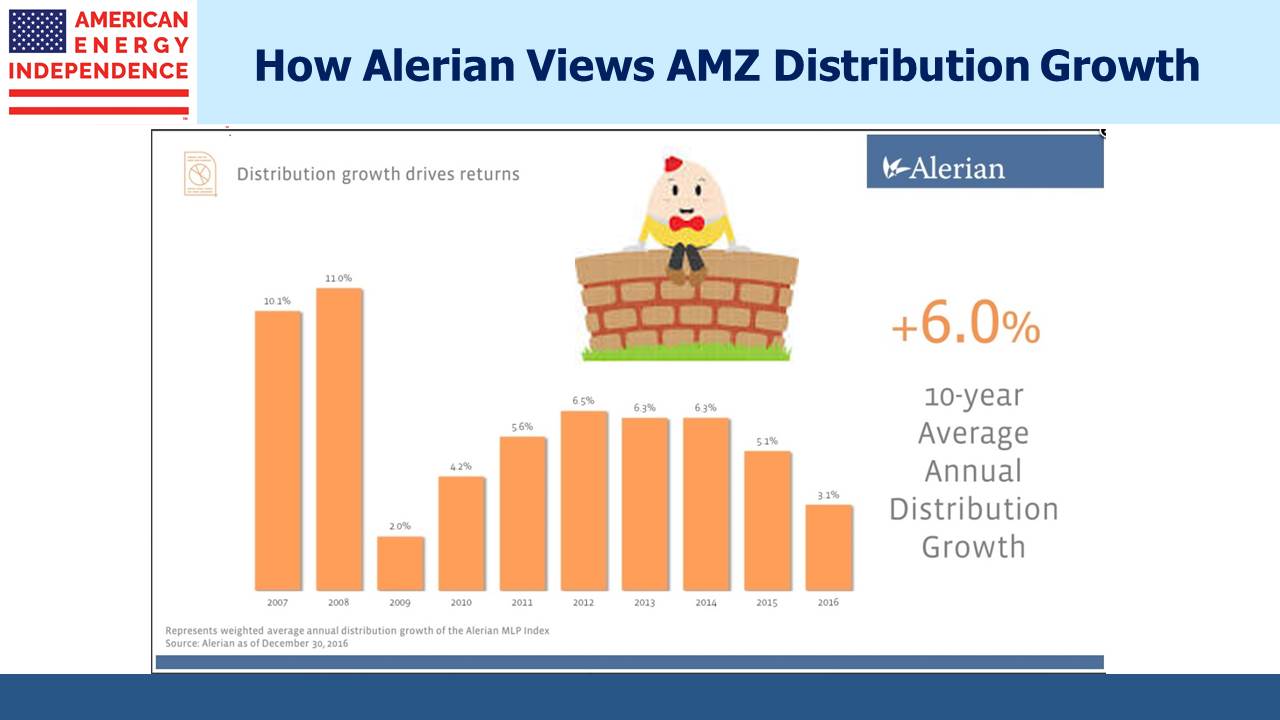
The distribution growth rate therefore reflects what today’s index members are growing at. This may be useful information, but it’s not the same as calculating the growth rate of distributions received by investors in the index. Moreover, it creates an upward bias to the calculation, because poorly performing names who cut their payouts are dropped while recently IPO’d high fliers are included. During the 2015-16 MLP collapse Alerian relaxed the requirement that any AMZ member cutting their distribution be excluded, probably because it would have led to an overly concentrated index.

“When I use a word,” Humpty Dumpty said, in rather a scornful tone, “it means just what I choose it to mean—neither more nor less.” It’s Growth Through the Looking Glass.

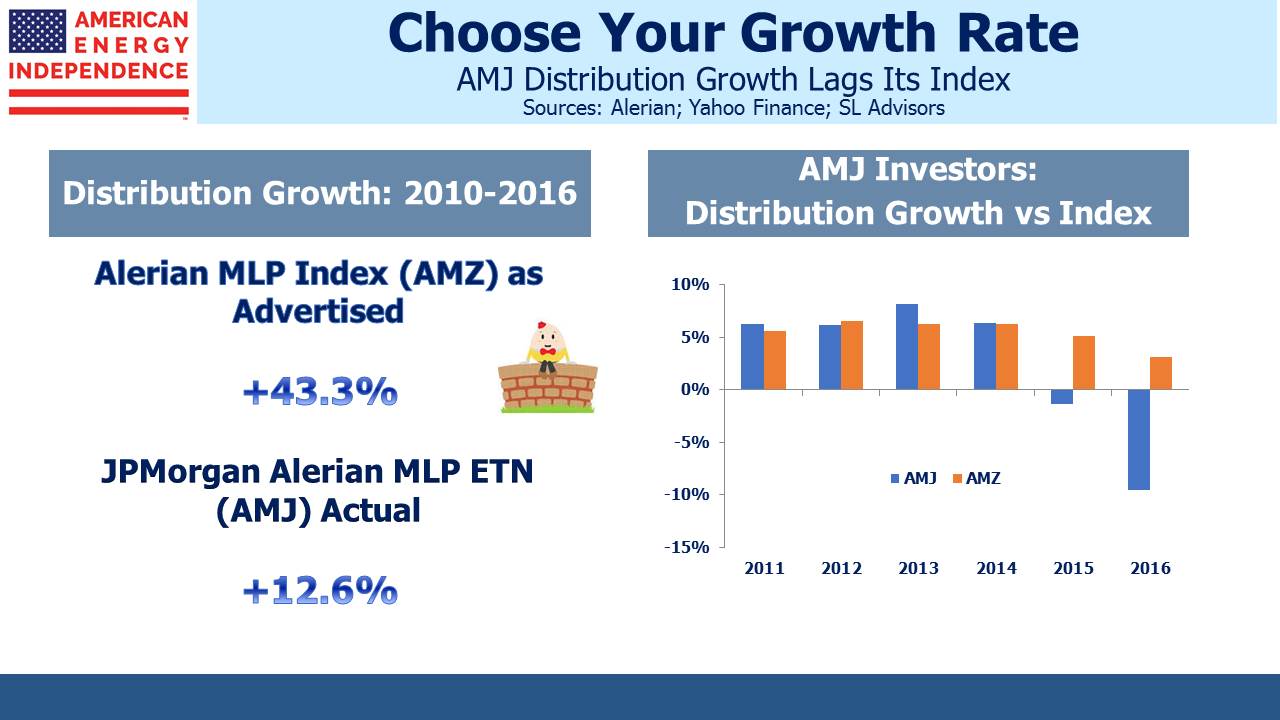
The distribution history of AMJ, which is benchmarked to AMZ, shows that actual payouts have been falling since 2015. MLPs have been cutting payouts. Investors know this. The miserably tax-burdened ETF AMLP (seven year since inception return 2.8%, roughly half its index benchmark. See Some MLP Investors Get Taxed Twice), cut its distribution by 15.6% in 2017 following a 13.8% cut in 2016. AMJ’s 2017 dividends are 8% lower than the prior year. The AMZ distribution growth chart suggests a more positive history, and will presumably show better 2017 growth versus its linked investment products when it’s updated.

“But have distributions been growing or shrinking?” asked Alice. “Yes”, replied Humpty Dumpty.

Alerian is very open about their process. In February 2016 Alerian’s Karyl Patredis explained the procedure behind the chart. I know Alerian’s CEO Kenny Feng. He’s smart and has built a fine business. I’m sure there’s absolutely no intent to mislead people.

But this look-back methodology is not intuitive. It clearly doesn’t align with how investors actually experience dividend growth. If investors infer from the chart that MLP distributions have been growing steadily, they’re more likely to buy an Alerian-linked product such as AMJ or AMLP.

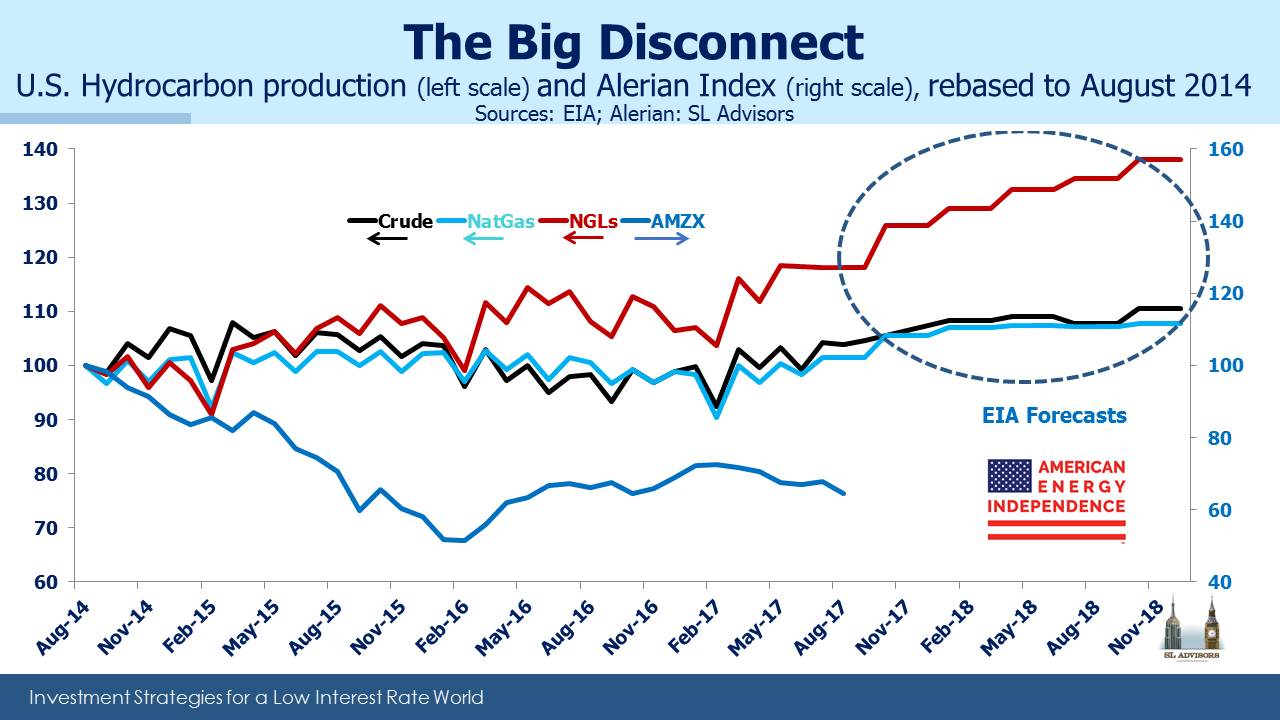
MLPs are redirecting more of their cash flow into new projects, and many of the larger ones have become C-corps so as to access a far wider set of investors. As a result, MLPs represent a shrinking piece of the energy infrastructure sector. To be a pure MLP investor today is to miss out on many of the biggest companies that are supporting America’s drive to Energy Independence.

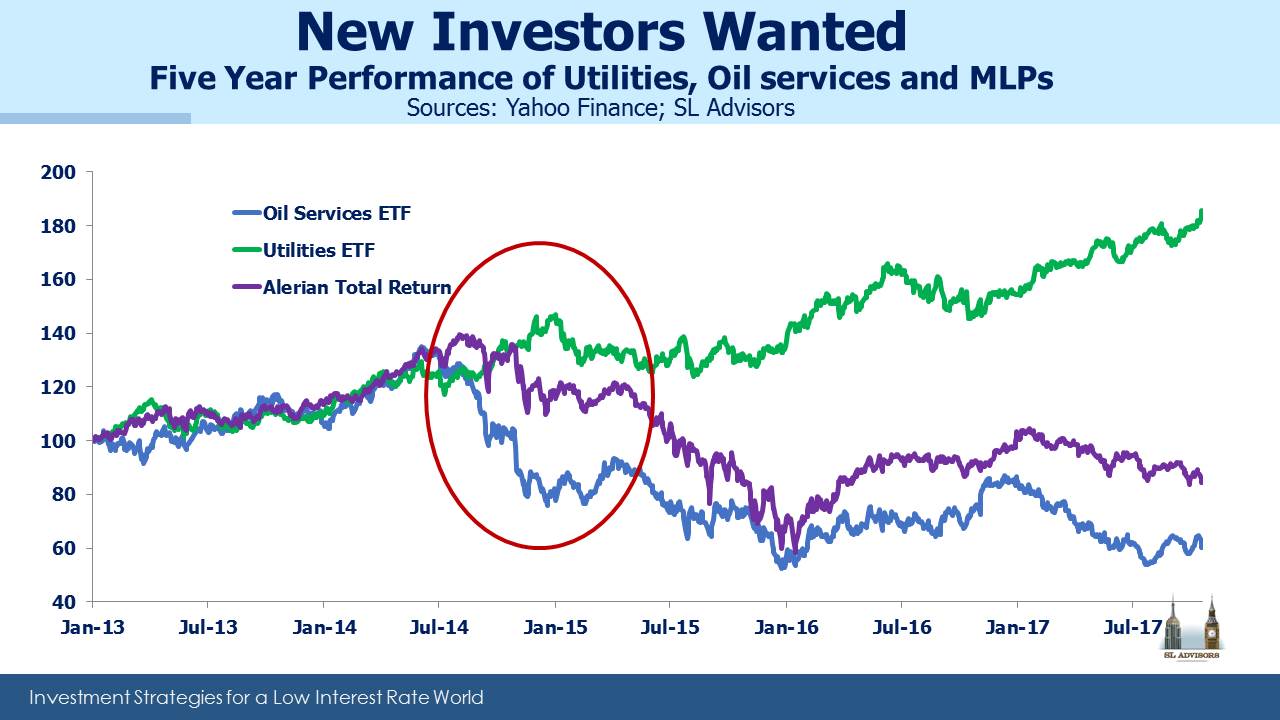
This is why we created the American Energy Independence Index (up 6.5% in December), and its investable ETF, to better reflect what’s happening in energy infrastructure. As we’ve noted before (see The Changing MLP Investor), yield is less relevant to today’s investors. Stable businesses are reinvesting for growth, which is attracting total-return buyers. MLP payouts have been falling to allow for reinvestment back in their businesses and to reduce leverage. To believe MLP distributions have been growing is to follow a white rabbit down a hole.

MLPs Glimpse Daylight

Tromso, Norway, sits 215 miles inside the Arctic Circle. It is one of the planet’s most northerly human settlements. Around January 25th at lunchtime, its inhabitants drop what they’re doing and gather outside for their first glimpse of the sun in two months. It’s only visible for four minutes, but the first natural shadows after interminable darkness are a welcome confirmation of Spring’s approach. One resident told a visitor, “If you haven’t lived through a winter like ours you can’t imagine what it’s like.”

This Fall our church welcomed a new rector. He’s English, which allows us to discuss Premier League football at a depth inaccessible to other congregants. His beautifully written sermons are delivered with humor and grace. A recent homily opened with Tromso’s dawn, and led to a discussion of maintaining religious faith during spiritual darkness. I hope our rector isn’t disappointed that for me, emerging from Tromso’s dark winter also evoked the secular feelings of an MLP investor maintaining conviction in the profitable path to American Energy Independence. If you haven’t lived through a bear market in energy when stocks are making new highs all year, you can’t imagine what it’s like. Sunlight can’t be far away. Even in Tromso, winter ends.

At their darkest, MLP fund outflows during 4Q17 were comparable to the worst of late 2015 and drove valuations relentlessly lower, creating a negative feedback loop. As income-seeking investors left the sector (see The Changing MLP Investor), the consequent selling has tested the conviction of others. Some just gave up – the relentless slipping of prices during a rip-roaring bull market in almost everything has eroded the confidence of many.

However, it’s looking as if December may be the dawn for battered energy infrastructure investors, with the late-year seasonal pattern once again playing out (see November MLP Fund Flows Overwhelm Fundamentals). The most recent data shows that the fund outflows have virtually finished. Taxes are probably the catalyst. In November (often the weakest month), uncertainty about what the GOP tax bill would ultimately mean for MLPs further damaged already fragile sentiment. Bloomberg’s  The Senate Tax Plan Sets a Trapdoor for MLPs in late November epitomized the concerns some had about adverse tax changes.

Tax-loss selling has been another big influence. Most investors have realized gains this year and selling energy losers offers a way to reduce taxable gains. Moreover, winners are more plentiful than losers, leaving investors with few places to find losses other than among their energy infrastructure holdings.

But taxes also provided support more recently, because the final legislation was beneficial to MLPs. The tax-deferred portion of distributions is typically taxed at ordinary income rates, but that will now benefit from the 20% discount for pass-through businesses. There was some further good news for General Partners (GPs), in that Incentive Distribution Rights payments will also receive preferential pass-through treatment rather than being taxed as ordinary income. In spite of initial concerns, given a few days to assess the final bill it’s clear it provides a welcome boost to the after-tax income of both MLP and GP investors. Bloomberg’s trapdoor wasn’t triggered. The table below reflects the final legislation passed by Congress last week.

The American Energy Independence Index (AEITR) is +4.5% so far in December. After a torrid few months, MLP returns are improving. Although the sector is still negative for the year, the AEITR has bounced +7.3% since the late November Bloomberg story mentioned above. For investors, it just might signal the start of sunny days once more.

American Energy Security

This morning CNBC had ClipperData’s Matt Smith as a guest. He noted that U.S. net imports of crude oil and petroleum products are below 3.44 Million Barrels a Day (MMB/D), a level last seen in February 1985.

OPEC, the International Energy Agency (IEA), and the U.S. Energy Information Administration are all forecasting U.S. crude oil production to increase next year: 1.05 MMB/D (OPEC),  1.1MMB/D (IEA) and 0.8 MMB/D (EIA) respectively. All three forecasts would mean record U.S. oil production.

As a result, the U.S. is becoming a more significant exporter of both crude oil and natural gas. It’s worth remembering that a substantial portion of global supplies of hydrocarbons come from countries that are far less reliable trade partners. The closure of the Forties oil and gas pipeline in the North Sea has contributed to a spike in UK natural gas prices. One consequence is that the UK is preparing to welcome imports of Liquified Natural Gas (LNG) from a Russian LNG export facility even while the U.S. and EU  have imposed sanctions designed to impede the financing of such projects. American Energy Independence is to our benefit but will increasingly help extend energy security to others.

Falling Taxes and Valuations Boost Energy Infrastructure Outlook

Tax reform removed the uncertainty surrounding treatment of MLPs, in that both House and Senate plans provide some additional benefit. Although the final bill will require negotiations to reconcile the different Senate and House versions, we’ve updated the table below to reflect a 22% corporate tax rate and the Senate treatment of pass-through income for MLP investors, which is less attractive than the House. Investors in both C-corps and MLPs will be better off, and if the House’s pass-through treatment prevails MLP investors will benefit further.

The 2017 Wells Fargo Pipeline and Utility Symposium held last week included the slide below. Energy infrastructure investors need little reminder – 2017 is turning out to be a forgettable year, which has reduced valuations to the levels shown in the chart. Tax loss selling continues, since most investors have substantial investment gains and unloading some energy losers mitigates the tax bill. There’s little other justification for such moves.

People often associate breakthroughs in energy research with electric vehicles (EVs) and use of renewables to provide power. But traditional energy businesses are also the subject of considerable research and development. NET Power, based in Houston, TX, has built a pilot power plant that uses natural gas but captures the resulting CO2. They claim to have built a zero-emission natural gas power plant. Investors have provided $150MM to develop the business. It’s obviously early, but if the technology turns out to be successful on a large scale, given the abundance of natural gas in the U.S., it could be a significant solution to fossil-fuel based carbon emissions. It could even provide a legitimate clean energy alternative to windmills and solar panels. It would represent yet another dimension to the benefits to America of the Shale Revolution. New technology is often exciting, and interesting energy research isn’t limited to wind and solar.

The “Duck Curve” represents the demand for electricity during a typical day. The version from California’s Independent System Operator (ISO) highlights that peak electricity demand occurs at breakfast time when people are getting ready for work or school, and at dinner time when they return home. Although solar-generated electricity is growing, it’s worth noting that demand is highest when the sun is low in the sky or it’s dark. Therefore, traditional power plants such as natural gas are critical to providing power when it’s most needed. A speaker at a recent conference organized by R.W. Baird noted the potential problem this presents for the green credentials of EV owners, in that the obvious time to charge them is in the evening when renewables are less likely to be the source of electricity.

Regular readers will not expect us to be bullish on Bitcoin. Its recent take-off has been spectacular to watch, rather like a rocket that will inevitably crash even while its ascent is riveting. We’re reaching the stage where comparative valuations are startling: on Wednesday aggregate crypto-currency valuation exceeded the market capitalization of JPMorgan for example. CEO Jamie Dimon has called Bitcoin a fraud. You could own all the bitcoins that exist, or approximately half the publicly held energy infrastructure in the U.S. The correct choice isn’t obvious to everyone. The CME and CBOE’s proposed Bitcoin futures contracts must be the strongest evidence yet that parts of the U.S. finance industry have completely lost the plot, oblivious to their ostensible role of helping savers fund retirement in favor of creating gambling products.

What receives less attention than Bitcoin’s price is the energy consumed to “mine” new units. The computing power required to solve the increasingly complex algorithms that allow cryptocurrency units to be manufactured now consumes 29 Terrawatt Hours of electricity annually. This is more than the consumption of 159 countries. One analyst estimates that this costs $1.5BN, based on using cheap electricity in places such as China. Using recent growth rates, by next Summer crypto-currency production will consume the equivalent of America’s electricity output, and by 2020 the entire world’s. Somewhere, something will give. We’ll be spectators.


November MLP Fund Flows Overwhelm Fundamentals

In a single week in mid-November, from 15th to 22nd, $317MM flowed out of MLP mutual funds. It was an extraordinary exit over such a short period, second only in recent history to the first week of December 2015, when $340MM bolted. That was a time when every seller was motivated while buyers were scarce. Within two months the sector bottomed and began the glorious 2016 rally.

Nonetheless, the collective mutual fund exit in mid-November represented fully 1.5% of the $20BN in such funds.  In its way it was a run on the bank, punctuated by the apparent absence of a crisis anywhere else. Over that same time period, the S&P500 rose 0.7%, the S&P Energy Sector ETF (XLE) rose 0.5% and the Oil Services ETF (OIH) rose 1.5%. MLPs underperformed all of these, as they usually did in November, dropping 0.2%. For the month as a whole, redemptions totaled $473MM, more than 2% of the assets held by MLP mutual funds.

Earnings season had passed. Big fundamental news was sparse. Oil jumped from $55.50 to $58 on hopes of an extension to OPEC’s production cuts, further confusing MLP investors who learned to fear oil’s moves when it was falling and find the recent rally especially galling. Most notable that week was the announcement by Norway’s $1TN sovereign wealth fund of plans to divest from oil and gas stocks by the end of 2018 – a wholly sensible idea given the source of their wealth is natural gas. Most parts of the energy sector rose in the days following this announcement, whereas MLPs reacted as if Norway’s entire divestiture was going to fall on them. For this and other reasons, 1.5% of the capital in MLP mutual funds saw enough to exit. Oil and energy stocks were higher but MLPs weren’t, challenging equity analysts to explain the inexplicable. Understanding the 2017 performance of energy infrastructure stocks so clearly lies with the investors, not the operating companies.

Some investors are selling to create tax losses with which to offset gains elsewhere in their portfolios – it’s been a good year if you’ve had any kind of diversification away from energy. The progress through Congress of tax reform has created some uncertainty. With little sensitivity to PTSD-suffering MLP investors, Bloomberg ran an article unhelpfully titled The Senate Tax Plan Sets a Trapdoor for MLPs. Corporate taxes are coming down; while Congress deliberated, it was unclear whether MLP investor tax liabilities might benefit from pass-through treatment (a lower rate), or  not. But there never was a plan to increase taxes paid by MLP holders, although Bloomberg had a good headline.  Nevertheless, for much of November MLPs faced some uncertainty about their ultimate tax treatment. Such is current sentiment that many potential buyers were inclined to wait for clarification while sellers often opted for immediate action. In this sector but few others, those holding securities hold greater conviction about their disposal than do holders of cash about its deployment. Late Friday night, Republicans passed the Senate Tax Bill and included a 23% deduction for pass-through entities. With a big pass-through cut in the House bill as well, MLP investors can now be optimistic they’ll receive a favorable tax outcome.

MLPData had some interesting figures supporting the gradual exit of traditional MLP investors from the sector. They report that last year 9MM K-1s were issued, down from 11.1MM in 2009. Moreover, in 2016 only 27% of those went to individuals compared with 33% the prior year. There are fewer MLPs as we’ve noted before (see The American Energy Independence Index), since most of the big ones have concluded they’re not a good source of growth capital. Increasingly, energy infrastructure is owned by regular corporations (“C-corps”).

Some people interpret this shift as demonstrating greater institutionalization of MLP ownership via ETFs and mutual funds. But we disagree – the money those funds are investing is still largely retail. These funds widened the investor base by providing MLP exposure without a K-1, albeit usually with dreadful tax inefficiencies (see Some MLP Investors Get Taxed Twice). The big difference is that 1099 investors don’t possess the long term perspective of a K-1 investor, because ’40 Act funds don’t come with the same tax deferral opportunity. The resulting broader investor base is less tax-motivated, and therefore more inclined to trade their positions. Energy infrastructure used to be the exception – the transition away from traditional, K-1 tolerant investors with long holding periods has created one of the market’s most volatile sectors.

If you need to experience extreme schadenfreude before buying, energy infrastructure provides a target-rich environment. The rally late last week was long overdue and shows some signs of improving sentiment although valuations remains depressed. The positive fundamentals are exceptionally well known to current holders, starting with America’s march to Energy Independence powered by the Shale Revolution (see Energy Production Supports MLP Outlook). It represents American capitalism at its very best (see America Is Great!). Fundamentals are improving, leverage is coming down and valuations reflect excessive pessimism. Many current investors are confused. It was a volume business but higher volumes no longer help. It became a crude-oil linked business until oil rose.  OPEC uncertainty, pass-through tax treatment concerns, MLP seasonals, tax loss harvesting, price technicals, and fund flows all weighed on sentiment. For quite a few in mid-November, confusion overwhelmed conviction. Those sales looked smart at the time. As tax loss selling abates, the calendar turns and the U.S. breaks more records in hydrocarbon production, the good feelings will be fleeting.  Aleviating concerns, on Thursday, OPEC extended production cuts until the end of 2018 and signaled a strong commitment to cooperation among leading members. Passage of tax reform has further provided much improved clarity as well as a boost to after-tax returns. Sentiment and prices have every reason to continue improving.

Limited Partners, Limited Rights

Investors in Master Limited Partnerships (MLPs) have more limited rights than most equity investors in corporations. They’re called Limited Partners (LPs) for a reason. There’s often a General Partner (GP) who runs the business on behalf of the LPs. GPs have preferential economics, governance and information rights, and we concluded many years ago that the GP/MLP relationship looks a lot like the one between a hedge fund manager and his hedge fund (see MLPs and Hedge Funds Are More Alike Than You Think). GPs earn Incentive Distribution Rights (IDRs) rather than the ubiquitous “2 & 20” that has financed so many hedge fund and private equity fortunes. But the result is similar, since IDRs pay the GP more as the profits of the MLP grow.

Most of the big MLPs have simplified their structure in recent years. IDRs have come to be viewed as an unnecessary drag on LP returns, and it’s turned out that MLP investors aren’t a great source of capital (see Why the Shale Revolution Hasn’t Yet Helped MLPs). Simplification usually results in a collapsing of the GP/MLP dual entity into a single one. In such cases the result is often a corporation with no IDRs. The objective is to gain access to a far wider investor base in order to fund growth. Kinder Morgan began this trend in 2014 (see What Kinder Morgan Tells Us About MLPs).

Energy Transfer Partners (ETP) is the largest of the remaining MLPs that retains the old structure, with Energy Transfer Equity (ETE) as its GP. CEO Kelcy Warren understands better than most how lucrative the GP/MLP structure is, since it’s created the bulk of his personal wealth which is in invested in ETE. The market price of ETP reflects some skepticism that the current arrangement will persist, as reflected in ETP’s 13% yield. Consistent with Kelcy’s swaggering posture on such issues, ETP recently raised its payout so as to convey just how confident they are in the safety of the distribution. A merger of the two entities with ETE as the surviving entity would result in ETP LPs receiving ETE units which yield “only” 7%. ETP’s high yield presumably reflects the view of many that such a transaction is possible. And yet, we calculate that ETE’s 2018 Distributable Cash Flow will jump from $1BN to over $1.8BN, due to the expiry of previously granted IDR waivers and contribution from two major projects being moved into production. This could support a substantial jump in ETE’s cash available for payouts, so ETP investors have less to fear in a combination of the two.

One analyst recently suggested that ETP’s owners could band together and fire ETE as the GP, thereby unlocking substantial value for themselves at the expense of ETE. Kelcy is not a sympathetic character, and has demonstrated before that he has no fiduciary obligation to ETP, nor even to other ETE investors. The convertible preferreds that ETE issued to insiders in early 2016 are the subject of an ongoing legal challenge in Delaware court (see Is Energy Transfer Quietly Fleecing Its Investors?). This transaction showed that even investing directly alongside management in ETE carries some risk of self-dealing.

In fact, investing with Kelcy is like sitting at a high-stakes poker game with a good hand drawn from a deck of marked cards. You have valuable, well-positioned assets run by a talented management team, and have to balance those against the possibility of Kelcy screwing you if he can get away with it. All these factors need to be considered in sizing your stake. ETP yields 13% because investors don’t trust the dealer.

Although the notion of ETP LPs rising up in rebellion and overthrowing their monarch holds some understandable appeal, it faces some substantial challenges. Apart from the requirement that 2/3rds of the ETP LPs vote to fire the GP, a recent ETP registration statement included this language:

Our partnership agreement authorizes us to issue an unlimited number of additional partnership securities and options, rights, warrants and appreciation rights relating to the partnership securities for any partnership purpose at any time and from time to time to such persons, for such consideration and on such terms and conditions as our general partner determines, all without the approval of any limited partners.

ETE can always dilute a hostile group of LPs below the threshold. ETP’s attempted regicide would likely trigger a debilitating response.

Such language is not uncommon across the industry. A 2016 prospectus filed by NuStar (NS) is similar:

NuStar Energy’s partnership agreement authorizes NuStar Energy to issue an unlimited number of additional partnership securities for the consideration and on the terms and conditions established by the general partner in its sole discretion without the approval of any limited partners.

In The Limited Rights of Some MLP Investors last year we listed further examples of this type of GP protection.

Relatively weak governance rights are by no means unique to that portion of the $300BN publicly traded MLP sector that retains the GP/MLP structure. Around $3TN of capital invested in hedge funds has few rights and certainly worse liquidity. At least you can sell your MLP units if you’re unhappy. Hedge funds often respond to adversity by further limiting withdrawals. Private equity offers even less liquidity than hedge funds. Investor attempts to fire such managers are rare because they’re futile (see The Hedge Fund Mirage, Chapter 7: The Hidden Costs of Being Partners).

Alphabet (GOOG) has long had three share classes, with super-voting powers attached to founders’ shares that have the practical result of ensuring minority control even if a substantial majority of aggregate shares are voted in a certain manner. Facebook, Alibaba, Volkswagen and even Berkshire Hathaway are among the large global companies that have multiple classes of equity investor. The Economist recently opined on this (see How tech giants are ruled by control freaks).

The GP/MLP structure can be thought of as providing a preferred return to the LPs with the GP class sitting below them in the capital structure from an economic perspective. This is because the GP’s IDR take is linked to distributions paid to LPs, and starts out at 2%. So if distributions to LPs are cut, that can disproportionately lower the GP’s IDR take as they fall back down to the lower % splits. Moreover, recent history includes many examples of GP’s temporarily waiving IDRs, which benefits LPs over the GP at least in the near. We prefer to own GP’s because we believe their superior governance rights translate into better long term value creation, a view widely shared by their management teams. But investors routinely commit capital to equity vehicles that afford them junior rights, from MLPs to the large public companies listed above as well as the entire hedge fund and private equity sectors. It’s an imbalance that isn’t going away.

We are invested in ETE, and NuStar GP Holdings (NSH, GP of NS)


Oil and Gas Output to Reach Records Next Year

Seasonal patterns can be interesting when there’s some plausible substance driving the relationship. For several years we’ve noted the persistence of November to be weak, with the best returns occurring early in the calendar year (see Why MLPs Make a Great Christmas Present). The predominance of individual investors (rather than institutions) in the sector accounts for much of this. Most of us probably take stock of our investments around year-end, perhaps enjoying a welcome break from overindulgence at the dinner table. Any resulting portfolio shifts therefore take place shortly after.

K-1s are another factor; if you’re thinking of selling a publicly traded partnership, why wait until January when you’ll receive another K-1 for the partial year. Similarly, if you’re contemplating buying, you might as well delay until January so as to avoid a K-1 for the last part of the year. In both cases this leads to more sellers than buyers late in the year and the reverse in January.

Every year there are reasons to suppose that the seasonals won’t work. We’ve written many times that MLPs have lost the support of their traditional investor base, and that energy infrastructure corporations (“C-corps) are now as big as MLPs (see The American Energy Independence Index). So that may dilute the impact of individual tax-driven decisions over time. Anecdotally though, there has certainly been some individual tax-loss selling recently. Returns ex-energy have been strong, and some investors are booking losses in MLPs to offset other taxable gains.

But it’s also true that those not invested in energy infrastructure are far more numerous than those who are. As despondent as today’s investors may be, we have regular conversations with others with capital to commit who see potential opportunity in attractive valuations and the beaten down sentiment of existing holders.

The second chart captures the common refrain of investors frustrated by growing U.S. hydrocarbon production that so far hasn’t raised stock prices for the energy infrastructure businesses that support it. They’re right. Since the August 2014 peak in the sector, production levels have recovered and are now higher than they were three years ago. A recent report from the Energy Information Administration (EIA) forecasts record output next year in crude oil, natural gas and Natural Gas Liquids (NGLs). The Alerian Index has disconnected from this volume growth, in part because traditional investors were alienated by the distribution cuts to fund growth and reduce leverage that many businesses undertook (see Why the Shale Revolution Hasn’t Yet Helped MLPs). But the volumes are certainly coming. Today’s investors are getting paid with attractive distributions to wait for new investors to respond to the opportunity. The seasonal pattern may yet provide the catalyst.

On a different note, long-time readers will be aware of our disparaging comments about non-traded REITs, a nasty little security with no legitimate place in a retail investor’s portfolio because of the exorbitant fees charged (up to 15% of an investor’s money). Three years ago in one warning blog about the sector, we referenced American Realty Capital Properties founded by Nick Schorsch (see A Scandal That Should Shock Nobody). Former CFO Brian Block was recently sentenced to 18 months in prison for six counts of fraud. If your advisor recommends non-traded REITs, it may be because they’re more in his interests than yours.

Why the Shale Revolution Hasn't Yet Helped MLPs

MLP investors must wish they’d never heard of the Shale Revolution. The consequent growth in volumes of crude oil and natural gas seemed a fairly simple thesis for owners of volume-driven infrastructure assets. Increased demand for pipeline and storage capacity, for gathering and processing networks, ought to be good for the sector. But so far, a dramatically more productive domestic energy industry has driven MLP stock prices relentlessly lower. Moreover, the divergence between the energy sector and the broader averages is a common investor complaint  – the truism that MLPs are a volume business and therefore rising volumes should be good isn’t reflected in recent returns.

Early last week the International Energy Agency (IEA) published World Energy Outlook 2017 which forecasts that the U.S. will become the world’s biggest Liquified Natural Gas (LNG) exporter by the mid-2020s, and a net oil exporter by the end of that decade. Other long term forecasts, including those from the Energy Information Administration, Exxon Mobil and Goldman Sachs are broadly consistent with the IEA. MLPs slumped anyway, perhaps oblivious to the report or maybe because of it.

The Shale Revolution, the paradigm driving America to Energy Independence, has not done much for investors. It’s pressured cashflows and balance sheets of formerly stable businesses. Few management teams seem able to pass up growth opportunities, and the consequent redirection of Distributable Cash Flow (DCF) from distributions to growth projects has alienated those wealthy Americans who accepted K-1s in exchange for steady, growing, tax-deferred income. The evidence of this is most clearly seen in the defiantly high yields of some securities. Energy Transfer Partners (ETP), with its 14% payout, reflects investor disbelief that payments will continue.

Since yield no longer convinces, consider Duke Energy Corp (DUK) which delivers electricity and natural gas to over 9 million customers across the southern and Midwest U.S. It operates a highly regulated, capital intensive business.  Kinder Morgan (KMI) transports, treats and stores natural gas (including now LNG), natural gas liquids and crude oil in a highly regulated, capital intensive business. Debt:Equity at DUK is 5.6X and KMI is 5.3X, so they’re similarly leveraged. But KMI’s multiple to its Distributable Cash Flow (DCF, or Free Cash Flow less growth capex) is 8.8X. The analogous cash flow multiple for DUK is 13.2X (Net Income plus D&A minus maintenance CapEx). DUK is 50% more expensive on a cash flow per share basis.  Furthermore, the value of the land and easements acquired for pipelines appreciates over time whereas power plants eventually depreciate to zero. In this regard, DUK’s $7B/year (11% of it’s market cap) in growth CapEx becomes much more concerning.

The Utilities sector has been strong this year, which has stretched valuations while energy, including infrastructure, has lagged. The question is why investors in DUK and other similar names don’t make what looks like a substantial valuation upgrade by switching from one highly regulated business to another. KMI long ago broke its contract with the original Kinder Morgan Partners investors. When you remove a slide titled “Promised Made, Promises Kept” (see What Kinder Morgan Tells Us About MLPs) there are consequences. Redirecting cashflow from distributions to growth projects necessitated the revision to its investor presentation and took them in search of new investors.

MLPs are a shrinking part of the energy infrastructure landscape. The Shale Revolution is leading us towards Energy Independence, increasingly through C-corps (hence our new American Energy Independence Index). But the sector moves nowadays with the Oil Services sector whose biggest names are struggling with a global slump in spending on conventional oil and gas projects, whereas in the U.S. the strength in volumes and spending continues. The close relationship between oil services and energy infrastructure is not likely to sustain over the long term given their substantially different business models (cyclical versus regulated; global versus domestic).

Recent weakness may also be due to concerns that tax reform could result in lower corporate tax rates with no improvement in rates charged on passive investment income from pass-through vehicles. This would benefit C-corps over MLPs — although details on the plan continue to change, there’s probably less certainty about the ultimate tax treatment for MLPs which could be causing potential buyers to wait for clarity. The news that Norway’s $1TN sovereign wealth fund is planning to divest its oil and gas holdings certainly didn’t help sentiment either.

Returning to the chart, it shows that as growth plans took hold through 2014-15, increasing secondary offerings (how you finance growth if you pay out all your cashflow in distributions) revealed the reluctance of traditional MLP investors to reinvest those payouts. This drove yields up and hurt sector performance. Although they got there in different ways, most big MLPs concluded that the growth capital wasn’t available and so cut payouts, redirecting cash to fund projects instead. Traditional MLP investors felt betrayed and are clearly not rushing to invest in the sector, which has created today’s value opportunity.


Energy Production Supports MLP Outlook

U.S. energy production continues to grow, boosting exports and continuing our path towards Energy Independence. The most recent weekly production figures from the Energy Information Administration (EIA) show U.S. crude output reaching 9.62MMB/D (Millions of Barrels per Day) exceeding the previous recent peak in June 2015. Production has fully recovered from the dip following Hurricane Harvey.  The EIA projects that we’re on track to reach a daily average of 9.9MMB/D next year. This will eclipse the prior record of 9.6MMB/D set in 1970. Until the Shale Revolution few thought we’d ever see that figure again as crude output began a 40-year decline.

Natural gas production is expected to average 73.4 BCF/D (Billion Cubic Feet per Day) this year, up 0.6 BCF/D from 2016. Next year should see a big leap to almost 79 BCF/D. As we noted last week (see The U.S. Lowers Oil Volatility), exports of Liquified Natural Gas are set to more than quadruple over the next three years.

Electricity generation from renewables is also growing. Ex-hydro power, renewables will increase their share of generation from 8% this year to 10% by 2019. Since it’s not always sunny and windy, this growth in renewables is often supported by baseload power from natural gas plants that can vary output as needed. Natural gas and renewables have a symbiotic relationship.

A financial advisor asked me the other day what variables he should watch most closely as near-term drivers of MLP performance. As current investors know too well, crude oil sometimes moves the sector (as was the case in the first half of the year) but sometimes doesn’t (the case since June). The fundamental link between the two is tenuous — volume growth must surely be a more important driver of returns, since the financial link with cash flows is there.

The security of our domestic energy supplies is in marked contrast to other parts of the world. Saudi Arabia (10 MMB/D) is tackling widespread corruption with dozens of arrests of princes. Iraq (4.35) is grappling with Kurdistan’s increasing independence. Iran (3.78) is engaged in a proxy war with Saudi Arabia via Yemen. Venezuela (1.95) is close to economic collapse. The list goes on. The President wants “Energy Dominance”, which sounds even better than energy independence if you’re invested in domestic energy assets.

Last week Bloomberg broadcast a really terrific 45-minute documentary on The Next Shale Revolution. It’s absolutely worth watching.

The American Energy Independence Total Return Index is now updated daily by S&P Dow Jones Indices.

MLPs have been reporting earnings which have generally been in-line. Sentiment and valuations remain depressed, but the shorts have found little ammunition in recent conference calls. Yields are attractive and in some cases defiantly high. Energy Transfer Partners (ETP) yields 13%, while its General Partner (GP) Energy Transfer Equity (ETE) yields half that. ETP results were in line with expectations but guided to higher growth capex next year than some were expecting– clearly, few investors expect ETP’s 13% yield to persist, in spite of the recent hike in payout and a promise to evaluate further hikes in the future. An acquisition of ETP assets in exchange for new ETE units would be a stealth distribution cut for ETP, but lacks repricing up of ETP assets to create a bigger depreciation charge since ETE is not a c-corp (they could create a c-corp first — if they do, a subsequent combination is likely). ETE CEO Kelcy Warren remains a deterrent for many potential ETE buyers given his history of self-dealing (see Is Energy Transfer Quietly Fleecing Its Investors?). In any event, ETP is unlikely to yield 13% a year from now. And it’s worth noting that when asked if there was any likelihood of ETE/ETP consolidation within the next two years, Kelcy Warren simply answered, “No”.

NuStar (NS) also yields over 13% and its GP NuStar GP Holdings (NSH) offers over 12%. Market skepticism oozes over both names, caused most notably by NS’s decision earlier this year to acquire crude oil gathering and processing assets (Navigator) in the Permian for almost $1.5BN. NS’s distribution is not covered by Distributable Cash Flow (DCF) and 1.0X coverage remains over a year away. Merging the two would improve things because the NSH distribution is fully covered by DCF. It would bring Debt/EBITDA down from 6.1X to 5.3X, still above the 4-5X generally targeted by MLPs. However, it would also cede the optionality inherent in the GP/MLP structure. NSH seems to appreciate this better than most, since the Navigator acquisition was funded by NS with a temporary waiver of IDRs to NSH. To apply our hedge fund analogy, the hedge fund (i.e. NS) issued debt and equity at the direction of its hedge fund manager (NSH) which ultimately creates increased cashflows to NSH. Another alternative is for NS to issue equity to NSH who would issue debt to finance it (NSH has almost no debt). They have a lot of levers to pull.

Nonetheless, NuStar’s consolidated debt is $3.7BN, and the Navigator assets cost $1.5BN. It’s another example of an MLP seeking growth funded by debt when its traditional, yield-seeking investors just want stability with no excitement. Wealthy, older K-1 tolerant American investors don’t find the Shale Revolution’s need for new infrastructure nearly as exciting as the management teams.

Hence you have this monologue from President and CEO Brad Barron, in response to a question about distribution coverage: “…I would have never dreamed past year and a half close to 20 MLPs that have either restructured or reset or cut their distribution in some way. …how do you value MLP, is it a dividend discount model, with (sic) the enterprise to EBITDA model. So what I think would be most helpful is for the space to in terms of the normalcies with the equity markets begin acting rational again. … the value of NuStar has not being recognized appropriately …we’re managing this business for the long term.” In fact, one analyst counts 56 MLP distribution cuts since 2014.

Since distribution cuts are no longer rare, UBS’s Shneur Gershuni asked NS why they don’t cut theirs by $200MM annually (in 3Q17 the distribution was $34MM in excess of DCF). This is why the yield is high. NS investors are clearly not scrambling to reinvest their distributions back into NS, even though management rates the opportunity highly and Chairman William Greehey regularly adds to his holdings of NS and NSH.  We appreciate Greehey’s perspective even if the market is skeptical. The admission by NS Treasurer Chris Russell that Navigator’s 3Q EBITDA was only $12MM didn’t help. But by 2020 NS expects Navigator to be generating $250MM of EBITDA. Until then, management forecasts a net cash outlay of around $100MM (EBITDA that is ramping up less debt expense and approximately $350MM in capex). That will leave NS having invested around $600MM in equity ($500MM at acquisition plus the $100MM since then),  supported with $1BN in debt. By 2020 they’ll own an asset valued at roughly 6-7X EBITDA (i.e. $1.6BN cost divided by $250MM), with Debt:EBITDA leverage of 4X. It’s the outlook of a private company whereas NS is public, and three years is a very long time for equity traders. But we see the logic in the transaction.

Investors are increasingly rejecting using dividends to value MLPs, because (as Barron notes) so many have cut dividends. The industry could have opted for more modest growth, but levered up instead, and can’t figure out why their dividends draw so little respect. We think NuStar’s leverage metrics will improve and it’ll all work out, but it’s been a challenging run for traditional MLP investors.

We are invested in ETE and NSH

image_pdfimage_print