MLP Distributions Through the Looking Glass
Alerian’s page showing annual distribution growth for the Alerian MLP Index (AMZ) contains their most popular chart (it’s the 4th one down under “Figures and Tables”). It’s no wonder – the steadily growing distributions it portrays should be enough to calm any income seeking, excitement-averse investor. Since it’s their most viewed page, many investors must have drawn comfort from the reliability it presents. The turmoil endured by MLP investors since 2014 appears incongruous when such steady growth in payouts is considered.
Oddly, investors who hold securities linked to the index (such as the JPMorgan Alerian MLP Index ETN: AMJ) have not enjoyed the distribution growth presented by the index. It’s because of Alerian’s curious method of calculation.
The components of the index are updated periodically based on criteria set by Alerian. The growth figure they calculate takes the index members at the end of the year, and looks back to calculate the year-over-year growth rate they experienced. Some of those names may not have been in the index over the prior two years, and perhaps more importantly those names that have been dropped (often because they cut their payout) are excluded.
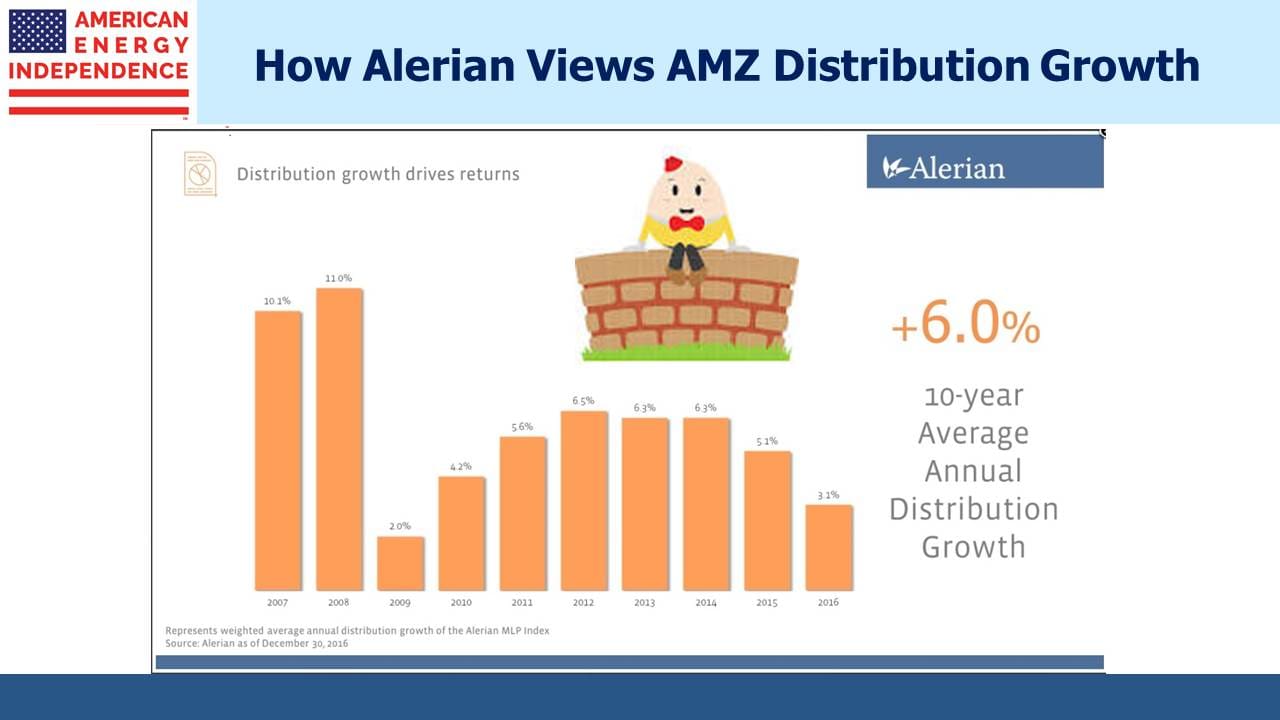
The distribution growth rate therefore reflects what today’s index members are growing at. This may be useful information, but it’s not the same as calculating the growth rate of distributions received by investors in the index. Moreover, it creates an upward bias to the calculation, because poorly performing names who cut their payouts are dropped while recently IPO’d high fliers are included. During the 2015-16 MLP collapse Alerian relaxed the requirement that any AMZ member cutting their distribution be excluded, probably because it would have led to an overly concentrated index.
“When I use a word,” Humpty Dumpty said, in rather a scornful tone, “it means just what I choose it to mean—neither more nor less.” It’s Growth Through the Looking Glass.
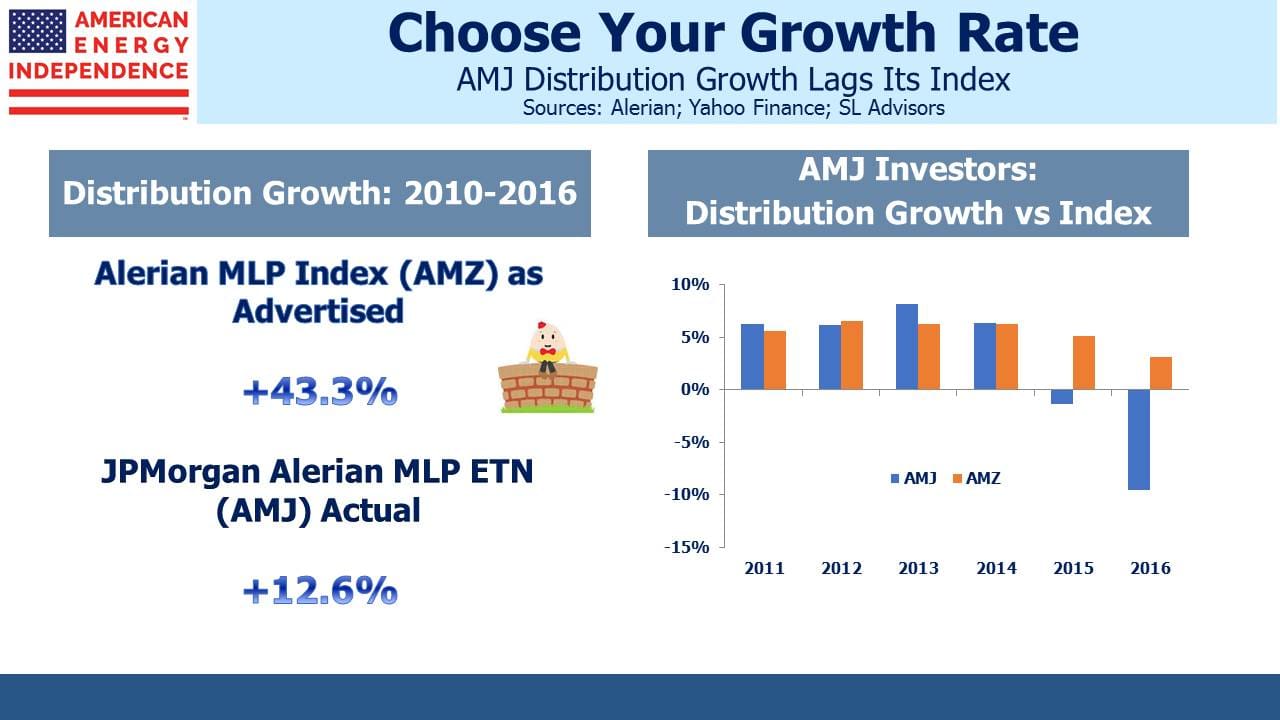
The distribution history of AMJ, which is benchmarked to AMZ, shows that actual payouts have been falling since 2015. MLPs have been cutting payouts. Investors know this. The miserably tax-burdened ETF AMLP (seven year since inception return 2.8%, roughly half its index benchmark. See Some MLP Investors Get Taxed Twice), cut its distribution by 15.6% in 2017 following a 13.8% cut in 2016. AMJ’s 2017 dividends are 8% lower than the prior year. The AMZ distribution growth chart suggests a more positive history, and will presumably show better 2017 growth versus its linked investment products when it’s updated.
“But have distributions been growing or shrinking?” asked Alice. “Yes”, replied Humpty Dumpty.
Alerian is very open about their process. In February 2016 Alerian’s Karyl Patredis explained the procedure behind the chart. I know Alerian’s CEO Kenny Feng. He’s smart and has built a fine business. I’m sure there’s absolutely no intent to mislead people.
But this look-back methodology is not intuitive. It clearly doesn’t align with how investors actually experience dividend growth. If investors infer from the chart that MLP distributions have been growing steadily, they’re more likely to buy an Alerian-linked product such as AMJ or AMLP.
MLPs are redirecting more of their cash flow into new projects, and many of the larger ones have become C-corps so as to access a far wider set of investors. As a result, MLPs represent a shrinking piece of the energy infrastructure sector. To be a pure MLP investor today is to miss out on many of the biggest companies that are supporting America’s drive to Energy Independence.
This is why we created the American Energy Independence Index (up 6.5% in December), and its investable ETF, to better reflect what’s happening in energy infrastructure. As we’ve noted before (see The Changing MLP Investor), yield is less relevant to today’s investors. Stable businesses are reinvesting for growth, which is attracting total-return buyers. MLP payouts have been falling to allow for reinvestment back in their businesses and to reduce leverage. To believe MLP distributions have been growing is to follow a white rabbit down a hole.![]()

Important Disclosures
The information provided is for informational purposes only and investors should determine for themselves whether a particular service, security or product is suitable for their investment needs. The information contained herein is not complete, may not be current, is subject to change, and is subject to, and qualified in its entirety by, the more complete disclosures, risk factors and other terms that are contained in the disclosure, prospectus, and offering. Certain information herein has been obtained from third party sources and, although believed to be reliable, has not been independently verified and its accuracy or completeness cannot be guaranteed. No representation is made with respect to the accuracy, completeness or timeliness of this information. Nothing provided on this site constitutes tax advice. Individuals should seek the advice of their own tax advisor for specific information regarding tax consequences of investments. Investments in securities entail risk and are not suitable for all investors. This site is not a recommendation nor an offer to sell (or solicitation of an offer to buy) securities in the United States or in any other jurisdiction.
References to indexes and benchmarks are hypothetical illustrations of aggregate returns and do not reflect the performance of any actual investment. Investors cannot invest in an index and do not reflect the deduction of the advisor’s fees or other trading expenses. There can be no assurance that current investments will be profitable. Actual realized returns will depend on, among other factors, the value of assets and market conditions at the time of disposition, any related transaction costs, and the timing of the purchase. Indexes and benchmarks may not directly correlate or only partially relate to portfolios managed by SL Advisors as they have different underlying investments and may use different strategies or have different objectives than portfolios managed by SL Advisors (e.g. The Alerian index is a group MLP securities in the oil and gas industries. Portfolios may not include the same investments that are included in the Alerian Index. The S & P Index does not directly relate to investment strategies managed by SL Advisers.)
This site may contain forward-looking statements relating to the objectives, opportunities, and the future performance of the U.S. market generally. Forward-looking statements may be identified by the use of such words as; “believe,” “expect,” “anticipate,” “should,” “planned,” “estimated,” “potential” and other similar terms. Examples of forward-looking statements include, but are not limited to, estimates with respect to financial condition, results of operations, and success or lack of success of any particular investment strategy. All are subject to various factors, including, but not limited to general and local economic conditions, changing levels of competition within certain industries and markets, changes in interest rates, changes in legislation or regulation, and other economic, competitive, governmental, regulatory and technological factors affecting a portfolio’s operations that could cause actual results to differ materially from projected results. Such statements are forward-looking in nature and involves a number of known and unknown risks, uncertainties and other factors, and accordingly, actual results may differ materially from those reflected or contemplated in such forward-looking statements. Prospective investors are cautioned not to place undue reliance on any forward-looking statements or examples. None of SL Advisors LLC or any of its affiliates or principals nor any other individual or entity assumes any obligation to update any forward-looking statements as a result of new information, subsequent events or any other circumstances. All statements made herein speak only as of the date that they were made. r
Certain hyperlinks or referenced websites on the Site, if any, are for your convenience and forward you to third parties’ websites, which generally are recognized by their top level domain name. Any descriptions of, references to, or links to other products, publications or services does not constitute an endorsement, authorization, sponsorship by or affiliation with SL Advisors LLC with respect to any linked site or its sponsor, unless expressly stated by SL Advisors LLC. Any such information, products or sites have not necessarily been reviewed by SL Advisors LLC and are provided or maintained by third parties over whom SL Advisors LLC exercise no control. SL Advisors LLC expressly disclaim any responsibility for the content, the accuracy of the information, and/or quality of products or services provided by or advertised on these third-party sites.
All investment strategies have the potential for profit or loss. Different types of investments involve varying degrees of risk, and there can be no assurance that any specific investment will be suitable or profitable for a client’s investment portfolio.
Past performance of the American Energy Independence Index is not indicative of future returns.
Leave a Reply
Want to join the discussion?Feel free to contribute!