Why You Should Follow The Money In Pipelines
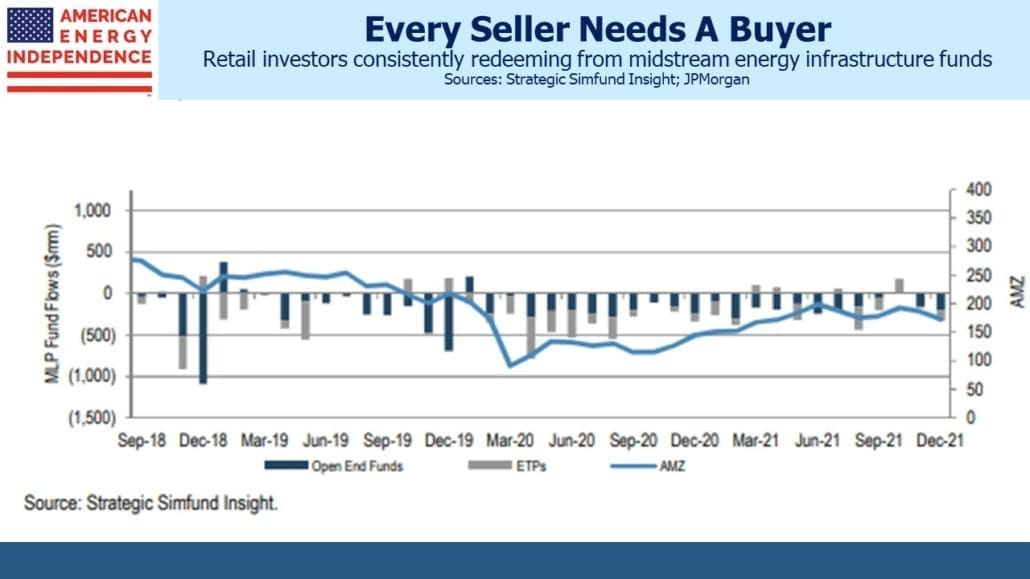
Last year fund outflows totaled $1.94BN for the midstream energy infrastructure sector (still often referred to as the MLP sector even though most of the market cap is corporations) according to JPMorgan. October was the only positive month, at a modest $6MM. 2021 was the third straight year that fund outflows exceeded $1.9BN. The last full year of inflows was in 2016.
It would seem hard to find much positive in those statistics – so read on.
Commentators often refer to money flowing into or out of a market – a description that often betrays intellectual laziness. Since for every buyer there’s a seller, trading flows rarely result in net flows of money. The notable exceptions are (1) IPOs, when new money is invested to purchase shares, and (2) buybacks, when a company retires shares leaving the sellers with net cash taken out from the market.
Ordinarily, the $1.94BN in sales from pipeline sector funds would have been bought by other investors – institutions, high net worth or retail investors – and would simply represent a change of ownership.
But in recent years MLPs and midstream corporations have been announcing buybacks. It’s another example of the industry’s continuing desire to demonstrate financial discipline and return capital to shareholders. When the MLP model prevailed, buybacks were rare since the MLP was always intended to be a funding vehicle, issuing equity when directed by its General Partner (GP) in order to build or buy assets – often from the GP itself in “drop-down” transactions. It’s why we believed GPs were always a better bet than the MLPs they controlled (see The Power of the MLP GP from 2014).
For an MLP to repurchase its own shares would be contrary to its raison d’etre.
Poor capital allocation decisions during the Shale Revolution led to many big MLPs converting to corporations. This was so they could access more traditional investors rather than the US taxable, K-1 tolerant high net worth buyers that had become disillusioned with serial distribution cuts, as well as for various tax advantages for the GP.
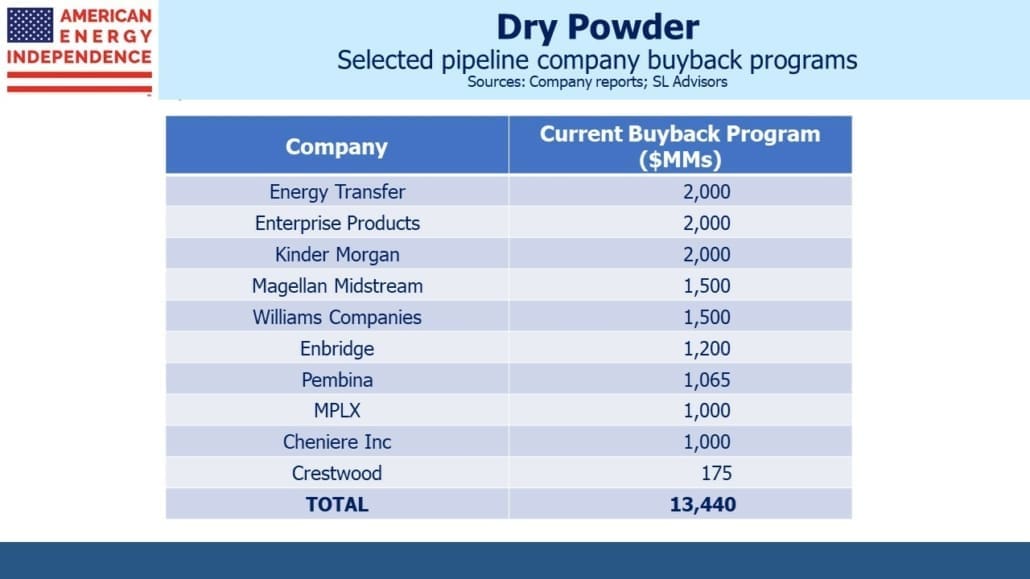
This led to a shift to more traditional performance metrics including total shareholder return (dividends plus buybacks). A selection of the biggest companies shows over $13BN in announced buyback programs. These only impact flows when they’re implemented though – but three companies’ actual 2021 buybacks executed in the open market equal 43% of the $1.94BN in net fund outflows from the sector. They are Enterprise Products Partners, Magellan Midstream and MPLX.
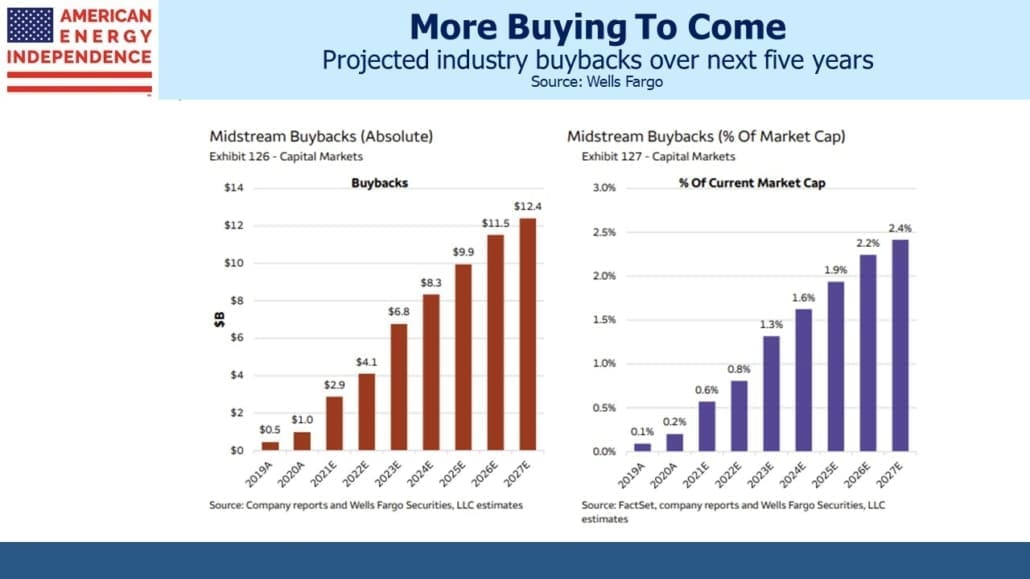
Most companies have yet to announce full year earnings with 4Q21 buybacks – of the three, only the EPD figure is for all of 2021. Wells Fargo estimates that midstream companies in their coverage repurchased $2.9BN of stock in 2021 and see that number steadily increasing in the coming years.
In the first of two privately negotiated transactions, Hess Midstream (HESM) repurchased $750MM in LP units from its parent and investor Global Infrastructure Partners, which also resulted in a commensurate sharecount reduction and increased ownership of HESM by its shareholders. The second private deal saw Crestwood buy out their general partner and investor First Reserve for $400MM.
What it means is that when all the figures are added up for last year, all the fund redemptions by retail investors were easily absorbed by the operating companies themselves. Once FY 2021 reports are published this figure will move higher.
The last five years have been emotionally draining for anyone with an overweight to the energy sector. Your blogger can attest that equal measures of resilience and stubbornness were necessary to maintain holdings through early 2020, so as to participate in the strong recovery that followed. Some of the retail sellers were just weary.
Energy executives are genetically engineered to spend on new projects – new oil and gas output for E&P companies, and new infrastructure for midstream. Thousands of executives have made their careers by putting money into the ground. All these companies and others have rejected internally generated capex proposals, some with optimistic IRRs, in favor of buying back stock. Given the energy sector’s culture, CFOs must show that reducing the share count by returning cash to shareholders to be exceptionally attractive to compete with the desire of some colleagues to spend the money on building projects instead. Also thank environmental extremists for throwing up so many roadblocks that capex has become less attractive.
In other words, in 2021 the less-informed sellers were taken out by better informed buyers.
It’s why net fund outflows didn’t visibly hurt performance. The broadly representative American Energy Independence Index (AEITR) was up 38.6% for the year, beating the S&P500 by almost 10%.
Given the size of the announced buyback programs, any sustained weakness in the sector is likely to be countered with more companies buying back their stock. There are also signs that funds outflows are ending – we’ve been seeing steady inflows into our products for some time, and interest to set up calls by existing and new clients has never been stronger. As the sector switches to experiencing fund inflows, it’s likely to propel prices sharply higher.
We have three funds that seek to profit from this environment:
Please see important Legal Disclosures.
Important Disclosures
The information provided is for informational purposes only and investors should determine for themselves whether a particular service, security or product is suitable for their investment needs. The information contained herein is not complete, may not be current, is subject to change, and is subject to, and qualified in its entirety by, the more complete disclosures, risk factors and other terms that are contained in the disclosure, prospectus, and offering. Certain information herein has been obtained from third party sources and, although believed to be reliable, has not been independently verified and its accuracy or completeness cannot be guaranteed. No representation is made with respect to the accuracy, completeness or timeliness of this information. Nothing provided on this site constitutes tax advice. Individuals should seek the advice of their own tax advisor for specific information regarding tax consequences of investments. Investments in securities entail risk and are not suitable for all investors. This site is not a recommendation nor an offer to sell (or solicitation of an offer to buy) securities in the United States or in any other jurisdiction.
References to indexes and benchmarks are hypothetical illustrations of aggregate returns and do not reflect the performance of any actual investment. Investors cannot invest in an index and do not reflect the deduction of the advisor’s fees or other trading expenses. There can be no assurance that current investments will be profitable. Actual realized returns will depend on, among other factors, the value of assets and market conditions at the time of disposition, any related transaction costs, and the timing of the purchase. Indexes and benchmarks may not directly correlate or only partially relate to portfolios managed by SL Advisors as they have different underlying investments and may use different strategies or have different objectives than portfolios managed by SL Advisors (e.g. The Alerian index is a group MLP securities in the oil and gas industries. Portfolios may not include the same investments that are included in the Alerian Index. The S & P Index does not directly relate to investment strategies managed by SL Advisers.)
This site may contain forward-looking statements relating to the objectives, opportunities, and the future performance of the U.S. market generally. Forward-looking statements may be identified by the use of such words as; “believe,” “expect,” “anticipate,” “should,” “planned,” “estimated,” “potential” and other similar terms. Examples of forward-looking statements include, but are not limited to, estimates with respect to financial condition, results of operations, and success or lack of success of any particular investment strategy. All are subject to various factors, including, but not limited to general and local economic conditions, changing levels of competition within certain industries and markets, changes in interest rates, changes in legislation or regulation, and other economic, competitive, governmental, regulatory and technological factors affecting a portfolio’s operations that could cause actual results to differ materially from projected results. Such statements are forward-looking in nature and involves a number of known and unknown risks, uncertainties and other factors, and accordingly, actual results may differ materially from those reflected or contemplated in such forward-looking statements. Prospective investors are cautioned not to place undue reliance on any forward-looking statements or examples. None of SL Advisors LLC or any of its affiliates or principals nor any other individual or entity assumes any obligation to update any forward-looking statements as a result of new information, subsequent events or any other circumstances. All statements made herein speak only as of the date that they were made. r
Certain hyperlinks or referenced websites on the Site, if any, are for your convenience and forward you to third parties’ websites, which generally are recognized by their top level domain name. Any descriptions of, references to, or links to other products, publications or services does not constitute an endorsement, authorization, sponsorship by or affiliation with SL Advisors LLC with respect to any linked site or its sponsor, unless expressly stated by SL Advisors LLC. Any such information, products or sites have not necessarily been reviewed by SL Advisors LLC and are provided or maintained by third parties over whom SL Advisors LLC exercise no control. SL Advisors LLC expressly disclaim any responsibility for the content, the accuracy of the information, and/or quality of products or services provided by or advertised on these third-party sites.
All investment strategies have the potential for profit or loss. Different types of investments involve varying degrees of risk, and there can be no assurance that any specific investment will be suitable or profitable for a client’s investment portfolio.
Past performance of the American Energy Independence Index is not indicative of future returns.


“…equal measures of resilience and stubbornness were necessary to maintain holdings through early 2020.” You can say that again. Even greater resilience and stubbornness were necessary to add to those holdings, in those darkest of hours. But oh boy did it pay off!
I am pleased that I am resilient and stubborn.