The Hidden Cost of Renewables
Renewables receive a disproportionate share of media coverage given their still small size. In 2019, less than 9% of America’s power came from solar and wind. Fossil fuels (mainly coal and natural gas) are over 62%. Moreover, electric power is only 37% of our total energy use. Renewables receive outsized attention because of the hope they will lead to lower emissions. A look at recent daily data on U.S. power generation illustrates the challenges we’ll face in relying on intermittent, low-density sources of energy.
California is a leader in moving away from fossil fuels. We should hope the rest of America doesn’t seek to emulate them, because Californians pay the most for the least (see California Dreamin’ of Reliable Power).
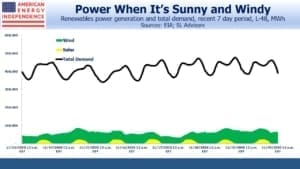
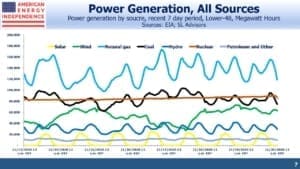
The first four charts draw on hourly electricity generation across the lower-48. Solar and wind are both intermittent – solar is fairly predictable, and wind less so. The challenge for grid operators is matching demand with supply.
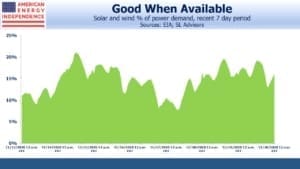
Over a recent seven day period, solar and wind provided 15% of our electricity, but the range was between 8% and 21%. Because their share is still small, this variability is easily managed by dialing other power sources up or down as needed. Natural gas combined cycle (NGCC) plants have the advantage of being easily recalibrated to accommodate fluctuations in nature’s power output. Their flexibility enables increased use of renewables – a benefit Californians are denied because of a purist dogma that has seen them phase out even natural gas power plants.
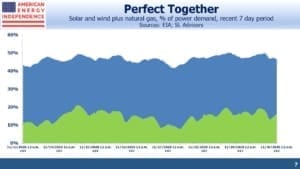
In combination, solar, wind and natural gas provided almost half our electricity over a recent seven-day period. What’s especially interesting is that natural gas output is strongly negatively correlated with the intermittent sources. This highlights the symbiotic relationship between the two.
Power demand isn’t constant – it’s higher during the day and peaks around dinner time. So we need variable sources of power. For example, if we used nuclear power exclusively, its constant output would require either storage or supplementary power to match demand.
Cost estimates of intermittent power sources need to include either complimentary natural gas power or battery back-up. Breathless media coverage of the topic rarely considers the fully-loaded costs.
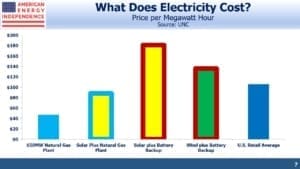
The chart below is from a paper published by the University of North Carolina which compared the cost of electricity from an NGCC with different combinations of renewables and back-up to achieve the same output for the 85% of the time such plants typically run. Solar and wind generally product at about 25% of capacity.
None of the alternatives are cheaper than an NGCC, although solar with NGCC back-up is the cheapest of the three alternatives considered.
In recent years natural gas has been the biggest contributor to falling U.S. emissions, and is enabling increased use of renewables. Continuing this success is our best path to combating climate change.
We are invested in all the components of the American Energy Independence Index via the ETF that seeks to track its performance.
Important Disclosures
The information provided is for informational purposes only and investors should determine for themselves whether a particular service, security or product is suitable for their investment needs. The information contained herein is not complete, may not be current, is subject to change, and is subject to, and qualified in its entirety by, the more complete disclosures, risk factors and other terms that are contained in the disclosure, prospectus, and offering. Certain information herein has been obtained from third party sources and, although believed to be reliable, has not been independently verified and its accuracy or completeness cannot be guaranteed. No representation is made with respect to the accuracy, completeness or timeliness of this information. Nothing provided on this site constitutes tax advice. Individuals should seek the advice of their own tax advisor for specific information regarding tax consequences of investments. Investments in securities entail risk and are not suitable for all investors. This site is not a recommendation nor an offer to sell (or solicitation of an offer to buy) securities in the United States or in any other jurisdiction.
References to indexes and benchmarks are hypothetical illustrations of aggregate returns and do not reflect the performance of any actual investment. Investors cannot invest in an index and do not reflect the deduction of the advisor’s fees or other trading expenses. There can be no assurance that current investments will be profitable. Actual realized returns will depend on, among other factors, the value of assets and market conditions at the time of disposition, any related transaction costs, and the timing of the purchase. Indexes and benchmarks may not directly correlate or only partially relate to portfolios managed by SL Advisors as they have different underlying investments and may use different strategies or have different objectives than portfolios managed by SL Advisors (e.g. The Alerian index is a group MLP securities in the oil and gas industries. Portfolios may not include the same investments that are included in the Alerian Index. The S & P Index does not directly relate to investment strategies managed by SL Advisers.)
This site may contain forward-looking statements relating to the objectives, opportunities, and the future performance of the U.S. market generally. Forward-looking statements may be identified by the use of such words as; “believe,” “expect,” “anticipate,” “should,” “planned,” “estimated,” “potential” and other similar terms. Examples of forward-looking statements include, but are not limited to, estimates with respect to financial condition, results of operations, and success or lack of success of any particular investment strategy. All are subject to various factors, including, but not limited to general and local economic conditions, changing levels of competition within certain industries and markets, changes in interest rates, changes in legislation or regulation, and other economic, competitive, governmental, regulatory and technological factors affecting a portfolio’s operations that could cause actual results to differ materially from projected results. Such statements are forward-looking in nature and involves a number of known and unknown risks, uncertainties and other factors, and accordingly, actual results may differ materially from those reflected or contemplated in such forward-looking statements. Prospective investors are cautioned not to place undue reliance on any forward-looking statements or examples. None of SL Advisors LLC or any of its affiliates or principals nor any other individual or entity assumes any obligation to update any forward-looking statements as a result of new information, subsequent events or any other circumstances. All statements made herein speak only as of the date that they were made. r
Certain hyperlinks or referenced websites on the Site, if any, are for your convenience and forward you to third parties’ websites, which generally are recognized by their top level domain name. Any descriptions of, references to, or links to other products, publications or services does not constitute an endorsement, authorization, sponsorship by or affiliation with SL Advisors LLC with respect to any linked site or its sponsor, unless expressly stated by SL Advisors LLC. Any such information, products or sites have not necessarily been reviewed by SL Advisors LLC and are provided or maintained by third parties over whom SL Advisors LLC exercise no control. SL Advisors LLC expressly disclaim any responsibility for the content, the accuracy of the information, and/or quality of products or services provided by or advertised on these third-party sites.
All investment strategies have the potential for profit or loss. Different types of investments involve varying degrees of risk, and there can be no assurance that any specific investment will be suitable or profitable for a client’s investment portfolio.
Past performance of the American Energy Independence Index is not indicative of future returns.


5 thoughts:
1) I totally agree with the idea that natural gas will be around for a long time.
2) It’s a shame we can not figure out nuclear and nuclear fuel recycling as an adjunct to this whole equation.
3) I’d like some attention paid to what happens to, say, solar when its’ capacity is doubled from here and it is built in lesser and lesser sites.
4) Full cycle costs can be funky. Sometimes they penalize carbon fuels with an effective carbon tax but not, say, solar with the $, energy consumption, and heavy metal cost of recycling an old solar field. So I distrust some of those numbers to give us a complete picture.
5) The heightened focus on solar/wind I think gets people to pay less attention to what could be done immediately to meet most 20 year global goals of GHG emission reductions — conservation. We don’t hear anything about that anymore. Meanwhile, the steady, innocuous, insidious increase in power rates will be like the frog in hot water — the frog being most people with below-median incomes and the water being an inability to ever get any breathing room in their family budget. All these things are related but the general media seems to be extremely narrow in its understanding of systems and context.
Hope all is well,
Tom
Simon,
Are you a member of Cash Flow Kingdom or a follower on Seeking Alpha? You seem to be writing the same things I do.
No, and I don’t look at SA very often. We must be kindred spirits!