The Ethane Standoff

/
All over the world plastics are manufactured using derivatives of crude oil. Along with cement, steel and fertilizer these are what Vaclav Smil refers to as the four pillars of civilization. Modern life couldn’t exist without them. Renewables are largely irrelevant to their production. Anybody who studies how we use hydrocarbons must conclude, as we have, that they are irreplaceable.
The American shale revolution (and it is uniquely American) unleashed new supplies of oil, gas and Natural Gas Liquids (NGLs). Methane, or natural gas, is the simplest hydrocarbon with a chemical formula of CH4, combining a single carbon atom with four of hydrogen.
Where pure methane is extracted it’s called “dry gas”. It’s often found with other more complex hydrocarbons referred to as NGLs, as in the Marcellus shale in Appalachia. This is “wet gas.” Most of our ethane is now produced in the Permian in west Texas and New Mexico where it is part of the “associated gas” that comes up with crude oil.
Midstream companies separate out the individual NGLs because they’re more valuable, and in most cases can’t be left in the natural gas supplied to customers. Therefore, wet gas is generally more lucrative than dry gas. Ethane (C2H6) is the is the exception – if the price of ethane is low enough it may not be worth separating out and can remain around 10% of the gas we use for cooking, heating and power generation. This is called ethane rejection.
In recent years the US has become the global leader in ethane production. Its relative abundance here keeps the price around one third of most other industrial nations. The US petrochemical industry has grown its consumption of ethane as it’s become more available. While in most of the world plastic is manufactured using a crude oil derivative, in the US ethane is converted into ethylene and used to make plastics, chemicals and other synthetic materials.
US ethane production has tripled over the past decade, to around three Million Barrels per Day (MMB/D). Quantities of NGLs including ethane are typically measured using the energy equivalent of crude oil even though ethane is a gas and is handled like one. A “barrel” of ethane means a quantity containing 5.8 Million BTUs, the same amount of energy in a barrel of crude.
Last year US ethane exports averaged 0.49 MMB/D. China bought 46%, with Canada, India and Norway buying most of the balance. No other country exports ethane on large ships, called Very Large Ethane Carriers (VLECs). China gets virtually all its ethane from the US. Energy Transfer (ET), Enterprise Products Partners (EPD) and Targa Resources (TRGP) own the export infrastructure that facilitates ethane exports. All expect growth and have additional capacity.
Which brings us to tariffs.
Following Liberation Day in early April, investors worried that the 145% tariffs imposed by the US on China would lead to reciprocal tariffs on US exports, including ethane. However, China recognized that its petrochemical facilities set up to process ethane had no alternative supply and chose to exempt US ethane imports.
For a few weeks, this seemed to solve the problem. But last week ET disclosed that the US government had told it to obtain an export license before shipping ethane to China. EPD said they expected their request for emergency authorization to be denied, affecting three cargoes.
On the weekend there were at least seven ships loaded with ethane waiting near the Gulf coast for US approval to sail to China. For now, neither country has any obvious alternative to trading ethane with one another.
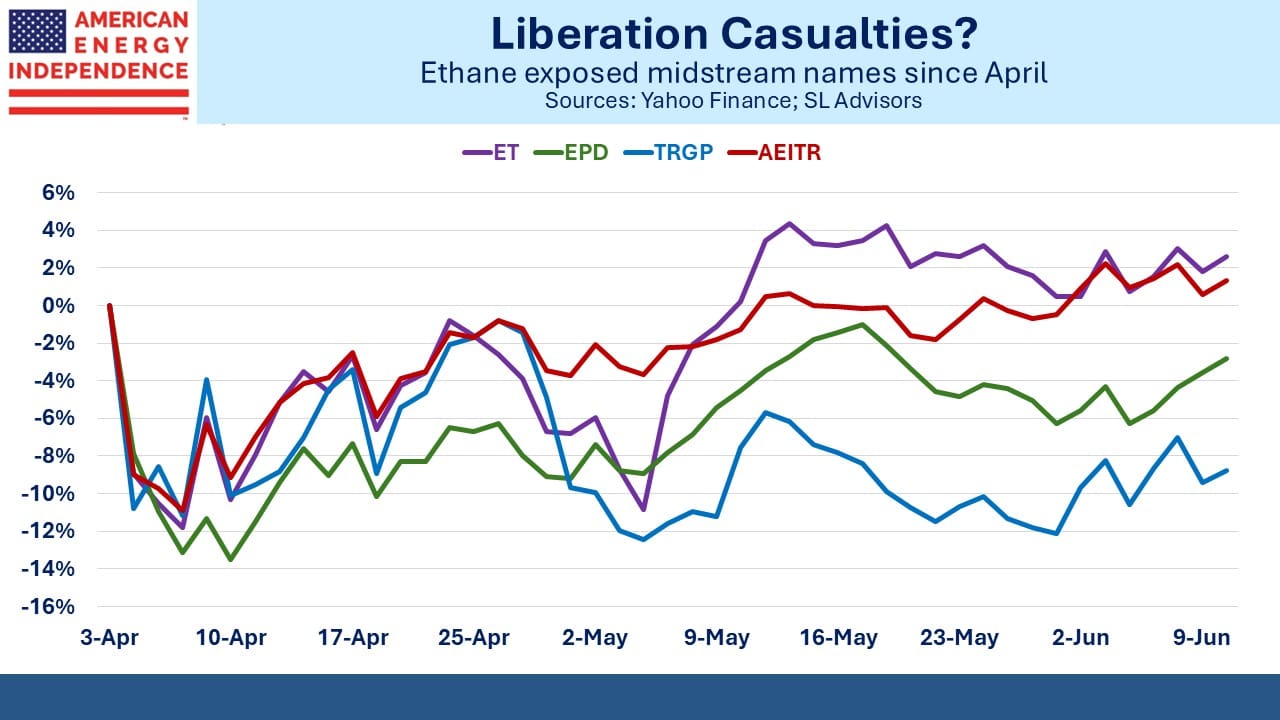
ET, EPD and TRGP, the midstream companies with the most exposure to ethane exports, all lagged the sector following April 2, although ET has since rebounded. None of them report ethane revenues separately. They include it within NGLs, which last year were around 25% (ET) and 40% (EPD) of revenues. Most of this activity was domestic so exports were a small portion. TRGP separates out NGL storage, terminaling and export, which was 3% of total revenues.
There are no winners from the disruption of US-China ethane trade. We think it’ll be resolved soon, perhaps as part of the bilateral talks currently taking place in London.
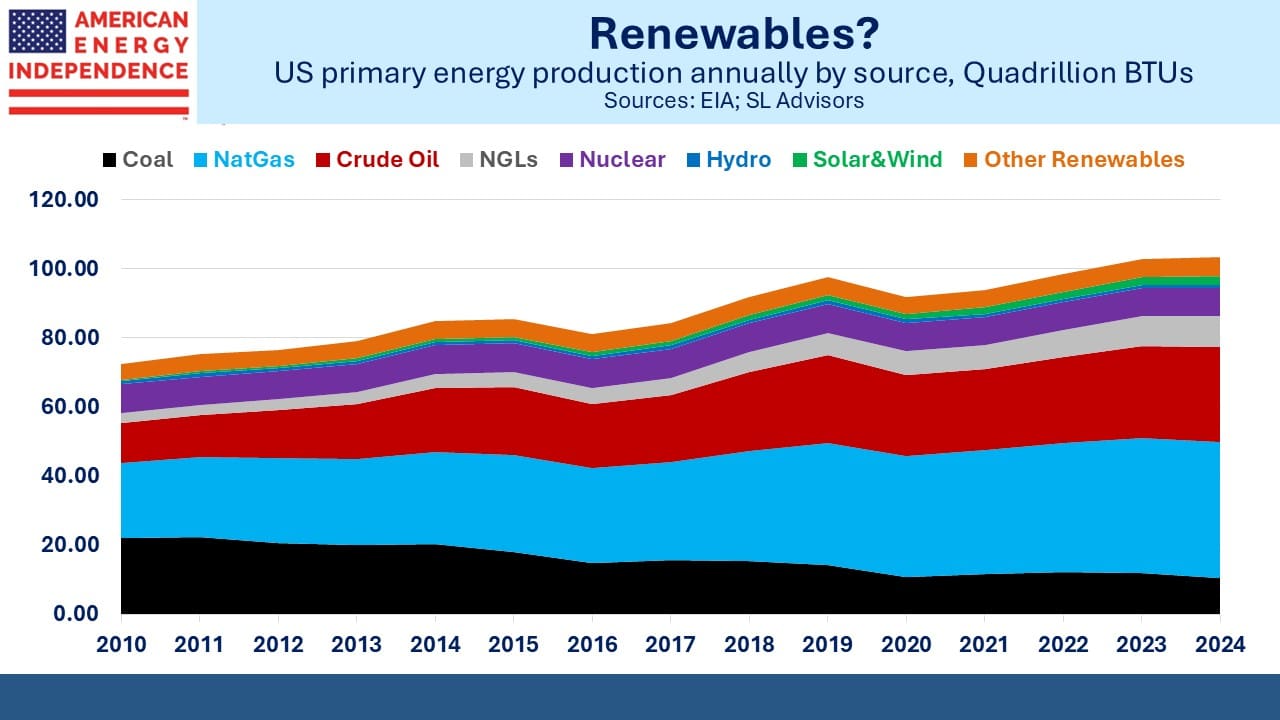
I’ll close by providing a chart of US energy production by source since 2010. We’ve added 17.4 Quadrillion BTUs (“Quads”) of natural gas and 2.25 Quads of solar plus wind, which were combined into a single category on the chart to render them visible. America’s most important energy story continues to be The Natural Gas Energy Transition.
We have two have funds that seek to profit from this environment:

Important Disclosures
The information provided is for informational purposes only and investors should determine for themselves whether a particular service, security or product is suitable for their investment needs. The information contained herein is not complete, may not be current, is subject to change, and is subject to, and qualified in its entirety by, the more complete disclosures, risk factors and other terms that are contained in the disclosure, prospectus, and offering. Certain information herein has been obtained from third party sources and, although believed to be reliable, has not been independently verified and its accuracy or completeness cannot be guaranteed. No representation is made with respect to the accuracy, completeness or timeliness of this information. Nothing provided on this site constitutes tax advice. Individuals should seek the advice of their own tax advisor for specific information regarding tax consequences of investments. Investments in securities entail risk and are not suitable for all investors. This site is not a recommendation nor an offer to sell (or solicitation of an offer to buy) securities in the United States or in any other jurisdiction.
References to indexes and benchmarks are hypothetical illustrations of aggregate returns and do not reflect the performance of any actual investment. Investors cannot invest in an index and do not reflect the deduction of the advisor’s fees or other trading expenses. There can be no assurance that current investments will be profitable. Actual realized returns will depend on, among other factors, the value of assets and market conditions at the time of disposition, any related transaction costs, and the timing of the purchase. Indexes and benchmarks may not directly correlate or only partially relate to portfolios managed by SL Advisors as they have different underlying investments and may use different strategies or have different objectives than portfolios managed by SL Advisors (e.g. The Alerian index is a group MLP securities in the oil and gas industries. Portfolios may not include the same investments that are included in the Alerian Index. The S & P Index does not directly relate to investment strategies managed by SL Advisers.)
This site may contain forward-looking statements relating to the objectives, opportunities, and the future performance of the U.S. market generally. Forward-looking statements may be identified by the use of such words as; “believe,” “expect,” “anticipate,” “should,” “planned,” “estimated,” “potential” and other similar terms. Examples of forward-looking statements include, but are not limited to, estimates with respect to financial condition, results of operations, and success or lack of success of any particular investment strategy. All are subject to various factors, including, but not limited to general and local economic conditions, changing levels of competition within certain industries and markets, changes in interest rates, changes in legislation or regulation, and other economic, competitive, governmental, regulatory and technological factors affecting a portfolio’s operations that could cause actual results to differ materially from projected results. Such statements are forward-looking in nature and involves a number of known and unknown risks, uncertainties and other factors, and accordingly, actual results may differ materially from those reflected or contemplated in such forward-looking statements. Prospective investors are cautioned not to place undue reliance on any forward-looking statements or examples. None of SL Advisors LLC or any of its affiliates or principals nor any other individual or entity assumes any obligation to update any forward-looking statements as a result of new information, subsequent events or any other circumstances. All statements made herein speak only as of the date that they were made. r
Certain hyperlinks or referenced websites on the Site, if any, are for your convenience and forward you to third parties’ websites, which generally are recognized by their top level domain name. Any descriptions of, references to, or links to other products, publications or services does not constitute an endorsement, authorization, sponsorship by or affiliation with SL Advisors LLC with respect to any linked site or its sponsor, unless expressly stated by SL Advisors LLC. Any such information, products or sites have not necessarily been reviewed by SL Advisors LLC and are provided or maintained by third parties over whom SL Advisors LLC exercise no control. SL Advisors LLC expressly disclaim any responsibility for the content, the accuracy of the information, and/or quality of products or services provided by or advertised on these third-party sites.
All investment strategies have the potential for profit or loss. Different types of investments involve varying degrees of risk, and there can be no assurance that any specific investment will be suitable or profitable for a client’s investment portfolio.
Past performance of the American Energy Independence Index is not indicative of future returns.


And don’t forget propane, which becomes propylene and that becomes polypropylene, also used in creating plastics.