Recapping Another Memorable Week for Energy
None of us will forget the past couple of weeks. Investors and money managers are grappling with collapsing markets, working remotely and the challenges of ever stricter controls on our movement.
Below we’ll highlight some information that investors may have missed, combined with what we’ve learned from multiple conversations.
Pipeline companies that said anything publicly were reassuring. Ten days ago and well into the market crisis, Oneok (OKE) cut growth capex by 20% and reaffirmed 2020 guidance. On Monday Enbridge (ENB) provided a reassuring assessment of their business prospects (see Enbridge Fireside Chat). Since then, Pembina (PBA) cut growth capex by 40% and reaffirmed EBITDA guidance, and Enterprise Products Partners (EPD) declared their normal quarterly distribution. Targa Resources (TRGP) slashed their distribution by 90% which was no great surprise, and lowered growth capex by 30%. Williams Companies (WMB) announced a poison pill lasting a year, to fend off any unscrupulous buyer seeking to acquire the company at a rock-bottom price.
MLP closed end funds and leveraged MLP exchange traded notes were almost wiped out by forced develeraging (see The Virus Infecting MLPs). Incredibly, many of these funds, run by well-known MLP managers such as Tortoise and Kayne Anderson, were leveraged up to 40% as recently as the end of February. In looking at the size of these funds and volume figures, it’s plausible that they were a significant portion of the selling in this sector earlier last week. While coronavirus was unpredictable, the arrogance of these fund managers in maintaining maximum leverage exposes a complete absence of risk management at their firms, and others like them. They have caused a steeper fall than would have happened otherwise. Their NAVs have shrunk far enough that they’re now too small to have much impact going forward.
Entering 2020, midstream energy infrastructure was set for a doubling of Free Cash Flow (FCF) (see Updating the Coming Pipeline Cash Gusher). The analysis was based on guidance all provided prior to the coronavirus outbreak, although recent updates have been encouraging. We had estimated 2020 growth capex at $37BN for the components of the American Energy Independence Index (AEITR). Average reductions of 20% would free up $7BN in FCF, and since we’re almost through 1Q20 they represent a bigger cut in previously planned spending for the remainder of 2020. We see the industry as broadly in pretty good shape to withstand the type of drop in energy demand that seems likely.
Making forecasts over the next year or two is reliant on the path that the virus takes, the success we have in defeating it and resolving the economic damage. In countless conversations with investors this week, we have stressed that while we can offer our insights on the sector we cover, we won’t pretend to be virus experts. We have a constructive view that the severe health threat posed by the virus will be met within a few months. Someone with a more negative view might infer, say, a severe drop in domestic energy consumption for a couple of years, and that would alter the outlook for pipelines. Our portfolio companies are >75% investment grade with customers that are around 80% investment grade. Exposure to crude oil, and gathering and processing networks, is small because stocks with that type of exposure have already fallen so far.
We have found investors are mostly sitting tight, regarding the drop as too sudden and sharp to warrant a hasty response. There are investors with cash looking for a good entry point. And to bring home the widespread economic damage, we’ve spoken to clients who anticipate providing financial support to children and other family members who have lost their jobs.
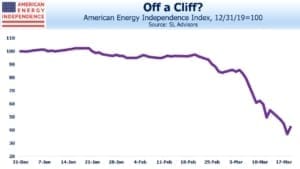
The AEITR is down 55.6% for the year, and the S&P500 is down 28.6%. From October 9, 2007 to March 6, 2009, the S&P500 fell 56%. On Friday, it was 32% off its high of February 19th, a very long month ago.
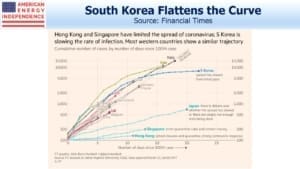
Finally, this chart caught our attention.
Outcomes vary widely by country. South Korea stands out as handling the health crisis as well as anybody. Germany is carrying out 160,000 tests a week, has 19K cases and 67 deaths (as of Friday 4:30pm NY time). The 0.3% fatality rate is still higher than flu, but contrasts with Italy’s 4,032 deaths and 8.6% fatality rate. Although there can be many reasons for the difference, infection numbers may be low depending on testing availability, while deaths are probably counted correctly. So Germany’s figures are likely more representative. U.S. infection numbers will increase as testing becomes more widespread. But if the curve eventually flattens to look more like South Korea, that would be the best news we’ve had in a while.
We are invested in ENB, EPD, OKE, PBA, TRGP and WMB.
Important Disclosures
The information provided is for informational purposes only and investors should determine for themselves whether a particular service, security or product is suitable for their investment needs. The information contained herein is not complete, may not be current, is subject to change, and is subject to, and qualified in its entirety by, the more complete disclosures, risk factors and other terms that are contained in the disclosure, prospectus, and offering. Certain information herein has been obtained from third party sources and, although believed to be reliable, has not been independently verified and its accuracy or completeness cannot be guaranteed. No representation is made with respect to the accuracy, completeness or timeliness of this information. Nothing provided on this site constitutes tax advice. Individuals should seek the advice of their own tax advisor for specific information regarding tax consequences of investments. Investments in securities entail risk and are not suitable for all investors. This site is not a recommendation nor an offer to sell (or solicitation of an offer to buy) securities in the United States or in any other jurisdiction.
References to indexes and benchmarks are hypothetical illustrations of aggregate returns and do not reflect the performance of any actual investment. Investors cannot invest in an index and do not reflect the deduction of the advisor’s fees or other trading expenses. There can be no assurance that current investments will be profitable. Actual realized returns will depend on, among other factors, the value of assets and market conditions at the time of disposition, any related transaction costs, and the timing of the purchase. Indexes and benchmarks may not directly correlate or only partially relate to portfolios managed by SL Advisors as they have different underlying investments and may use different strategies or have different objectives than portfolios managed by SL Advisors (e.g. The Alerian index is a group MLP securities in the oil and gas industries. Portfolios may not include the same investments that are included in the Alerian Index. The S & P Index does not directly relate to investment strategies managed by SL Advisers.)
This site may contain forward-looking statements relating to the objectives, opportunities, and the future performance of the U.S. market generally. Forward-looking statements may be identified by the use of such words as; “believe,” “expect,” “anticipate,” “should,” “planned,” “estimated,” “potential” and other similar terms. Examples of forward-looking statements include, but are not limited to, estimates with respect to financial condition, results of operations, and success or lack of success of any particular investment strategy. All are subject to various factors, including, but not limited to general and local economic conditions, changing levels of competition within certain industries and markets, changes in interest rates, changes in legislation or regulation, and other economic, competitive, governmental, regulatory and technological factors affecting a portfolio’s operations that could cause actual results to differ materially from projected results. Such statements are forward-looking in nature and involves a number of known and unknown risks, uncertainties and other factors, and accordingly, actual results may differ materially from those reflected or contemplated in such forward-looking statements. Prospective investors are cautioned not to place undue reliance on any forward-looking statements or examples. None of SL Advisors LLC or any of its affiliates or principals nor any other individual or entity assumes any obligation to update any forward-looking statements as a result of new information, subsequent events or any other circumstances. All statements made herein speak only as of the date that they were made. r
Certain hyperlinks or referenced websites on the Site, if any, are for your convenience and forward you to third parties’ websites, which generally are recognized by their top level domain name. Any descriptions of, references to, or links to other products, publications or services does not constitute an endorsement, authorization, sponsorship by or affiliation with SL Advisors LLC with respect to any linked site or its sponsor, unless expressly stated by SL Advisors LLC. Any such information, products or sites have not necessarily been reviewed by SL Advisors LLC and are provided or maintained by third parties over whom SL Advisors LLC exercise no control. SL Advisors LLC expressly disclaim any responsibility for the content, the accuracy of the information, and/or quality of products or services provided by or advertised on these third-party sites.
All investment strategies have the potential for profit or loss. Different types of investments involve varying degrees of risk, and there can be no assurance that any specific investment will be suitable or profitable for a client’s investment portfolio.
Past performance of the American Energy Independence Index is not indicative of future returns.


Here are some thoughts stimulated by the above worthwhile article:
1. Goldman Sachs’ overleveraged MLP fund had 5 million units of CEQP when the margin calls started. In the negative feedback loop that followed with the sale of probably 3 million or so CEQP units by that fund alone (and probably more from others as well), the price fell from the $21.28 I paid for some additional units on March 3rd to the $3.55 I paid on March 18th. My average price is $25, of which I was proud when the units traded near $40.
2. As to investors with cash looking for a good entry point, I have cash but in all candor I am reluctant to invest any of it until after after the forthcoming round of conference calls and maybe not thereafter, depending on the substance of the calls.
3. While EPD did declare its distribution, it did not make its usual quarterly enhancement, and the company is rethinking its growth plans. On the other hand there has been very significant insider buying in EPD units week after week. The Duncan family must have made a material increase in its previous one-third ownership of the EPD units.