Real Returns On Bonds Are Gone
A recent short term strategy outlook from a large buyside firm walked through market expectations for Fed policy, S&P earnings, the election and drew conclusions about the likely direction of stocks over the next six months. Such analysis is endlessly fascinating even if trading profits are unreliable.
The essay touched on, but didn’t examine, what must be the biggest force driving markets – persistently low interest rates.
The real return on ten year treasury notes going back almost a century is 2%. Given 2% inflation, a neutral Fed should cause long term yields to drift up towards 4%. The Fed has been manipulating rates lower for most of the past decade since the 2008-9 financial crisis, but last year the bond buying ended and short term rates began moving higher. Yet ten year note yields peaked at 3.3% in November before descending to 2% recently.
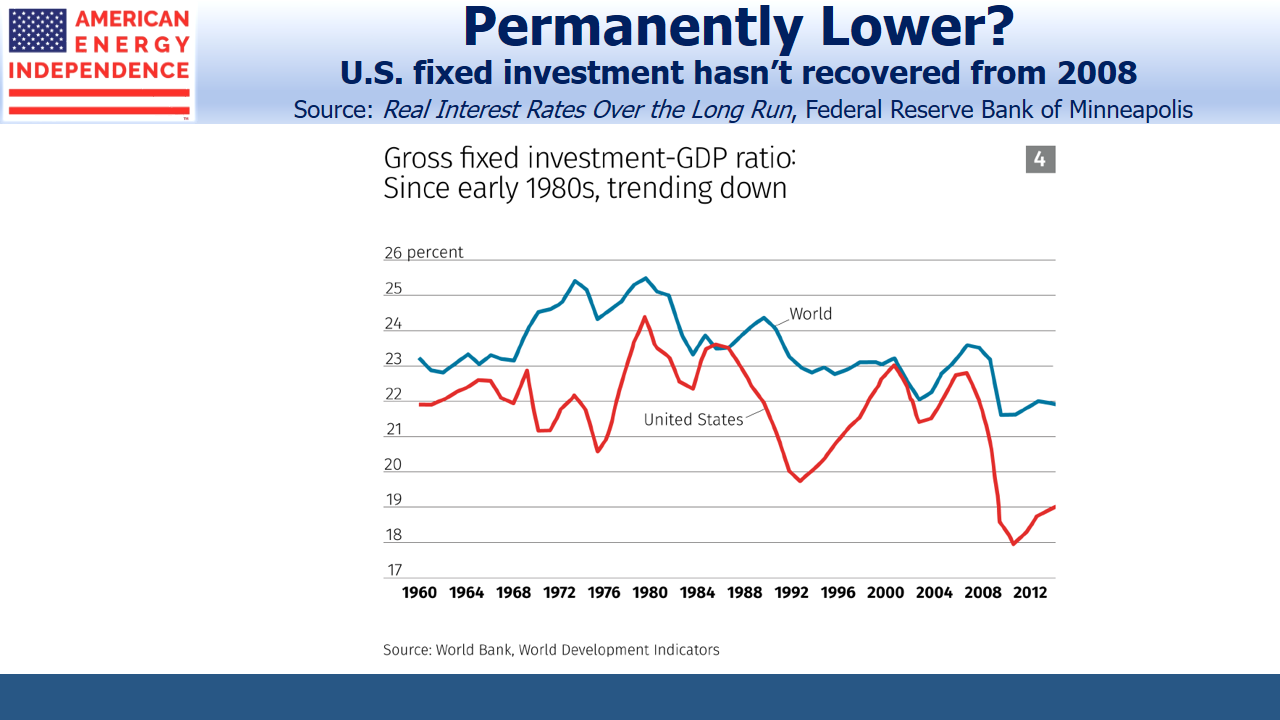
Clearly, the historic relationship has changed. The balance between demand for and supply of safe, long term assets has shifted. Bond investors collectively have accepted lower future returns. There is plenty of interesting academic research to explain why. Real interest rates have been in decline for thirty years, as shown in this chart from the Federal Reserve Bank of Minneapolis. They now appear to be negative, as defined by the average short term rate over the past decade.
Although many commentators fret over what they perceive as unsustainably high stock prices, the plausible explanations for low interest rates largely reflect reduced risk tolerance by investors. While the decline in real rates has been steady, gross fixed investment fell sharply in the U.S. during the financial crisis and has barely recovered. This implies companies have remained cautious, dampening the issuance of long term corporate debt.
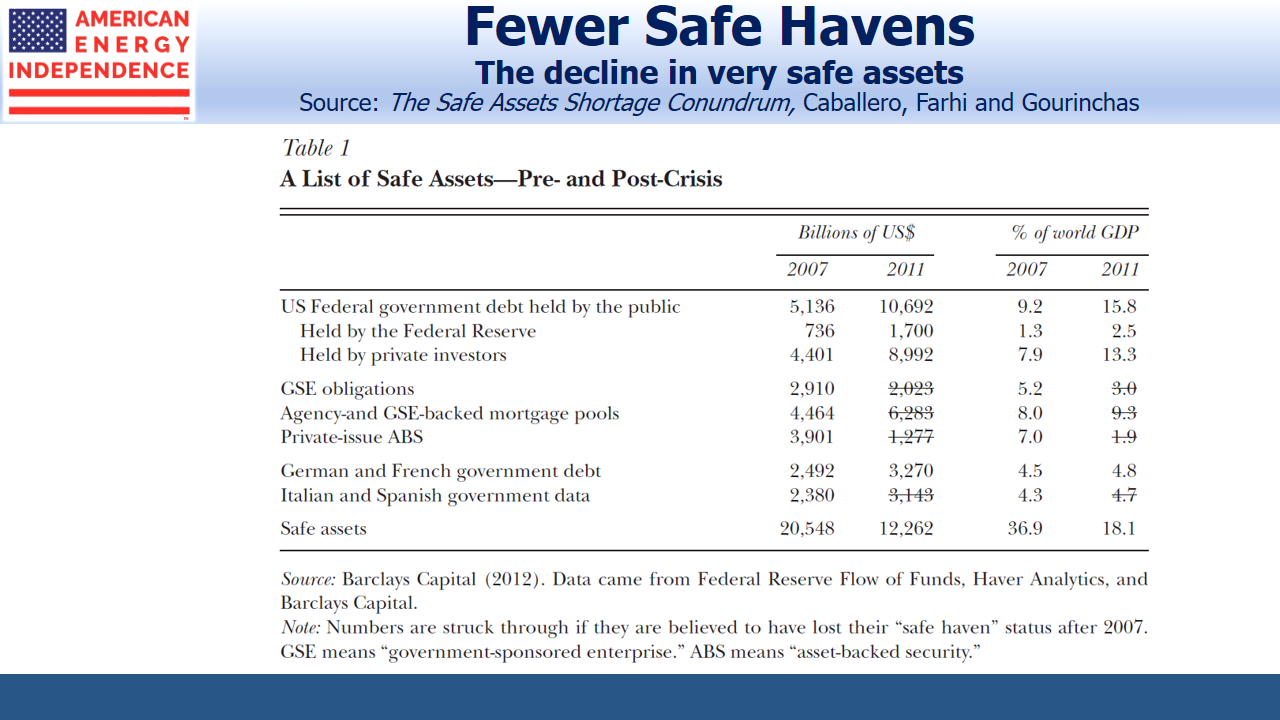
Another factor, highlighted in The Safe Asset Shortage (Caballero et al), notes that the financial crisis and subsequent Eurozone crisis led to a reassessment of which assets really were safe. Debt issued by FNMA and FHMC was assumed to be more risky following their conservatorship by the U.S. Unsatisfied demand for AAA debt instruments led Wall Street to produce Collateralized Debt Obligations (CDOs), which sought to pool riskier debt and repackage it into tranches of varying risk. But it turned out that the AAA tranche of a CDO retained some tail risk that sovereign debt did not. This perspective blames the 2008 crisis on unmet demand for safe assets.
Oddly, Caballero concludes that German and French sovereign debt similarly lost their allure. However, their yields are more than 2% lower than U.S. equivalents and solidly negative, which suggests ample holders willing to pay for what they perceive as highly safe investments.
Although memories of the financial crisis are receding, it seems to have permanently lowered risk tolerance. This, combined with a reduced supply of safe assets and perhaps the demographics of aging populations in wealthy countries have moved equilibrium long term rates lower. In recognition of this, the Fed has been adjusting their own long term equilibrium rate down in recent years.
A compelling solution is for a substantial increase in government funded infrastructure investment. This would take advantage of demand for long term debt and, assuming better infrastructure raised productivity, would not increase debt:GDP.
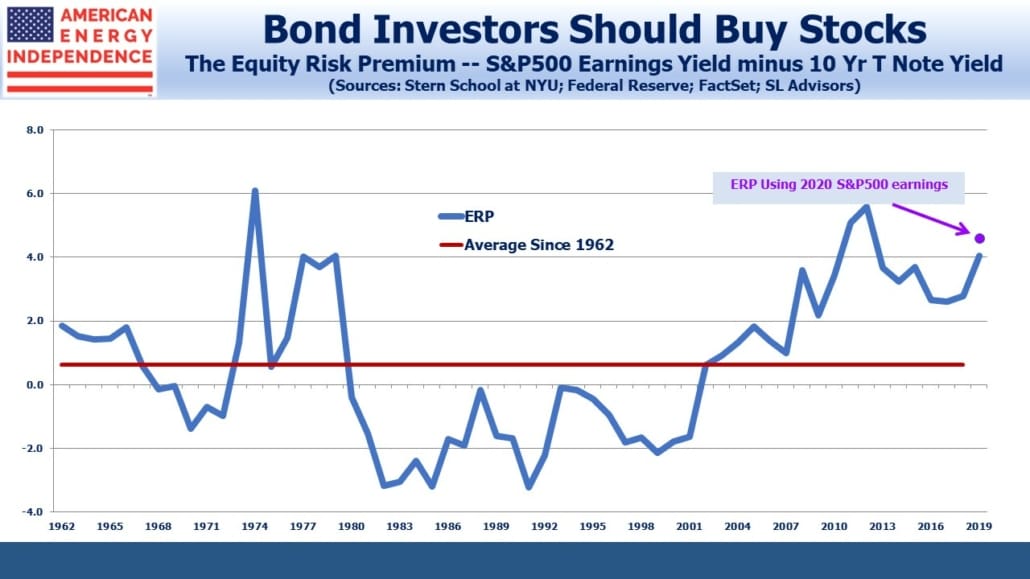
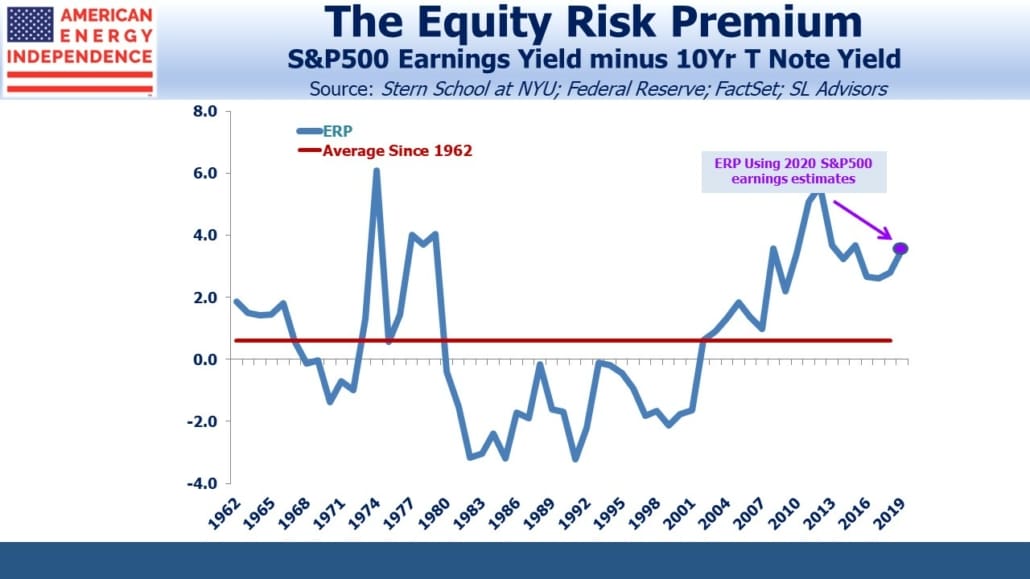
The shortage of safe assets is also reflected in the Equity Risk Premium (ERP), the difference between the earnings yield on the S&P500 and ten year treasury yields. It shows that stocks are cheap relative to bonds.
Since any investment is worth the net present value of its future cashflows, discounted at an appropriate interest rate, this has profound implications for stocks. Bond yields that are permanently lower suggest that stocks need to adjust substantially higher before fixed income can offer a competitive return.
The historically wide ERP underpins an investor’s choice to overweight equities. A return to its 50-year average of 0.6 (versus 3.6 today) isn’t imminent. But if next year it narrows halfway, to 2.1, and earnings grow by the 11% Factset bottom-up forecast, the S&P500 will be at around 4,400, nearly 50% higher than today.
U.S. energy infrastructure is an even better bet than the broader equity market. The shortage of high quality long term assets makes this sector especially attractive, as private equity funds seem to appreciate more readily than public markets.
Whatever the causes of permanently low interest rates, they strengthen the case for owning equities.
Join us on Thursday, July 11th at 1pm EST for a webinar. We’ll discuss the pipeline sector’s growing Free Cash Flow. To register, please click here.
SL Advisors is the sub-advisor to the Catalyst MLP & Infrastructure Fund. To learn more about the Fund, please click here.
SL Advisors is also the advisor to an ETF (USAIETF.com).


