Pipelines Shed Their Oil Sensitivity

/
Brent crude currently trades for around $4 per barrel less than a year ago. Back then Goldman Sachs published another highly convincing research report predicting higher oil driven by increasing demand and chronic underinvestment in new supply. Since then Jeff Currie has left the firm, hopefully not because of his not yet vindicated commodity super cycle thesis. Plenty of other firms were bullish. JPMorgan was cautiously looking for prices to be $6 higher. Few were loudly negative.
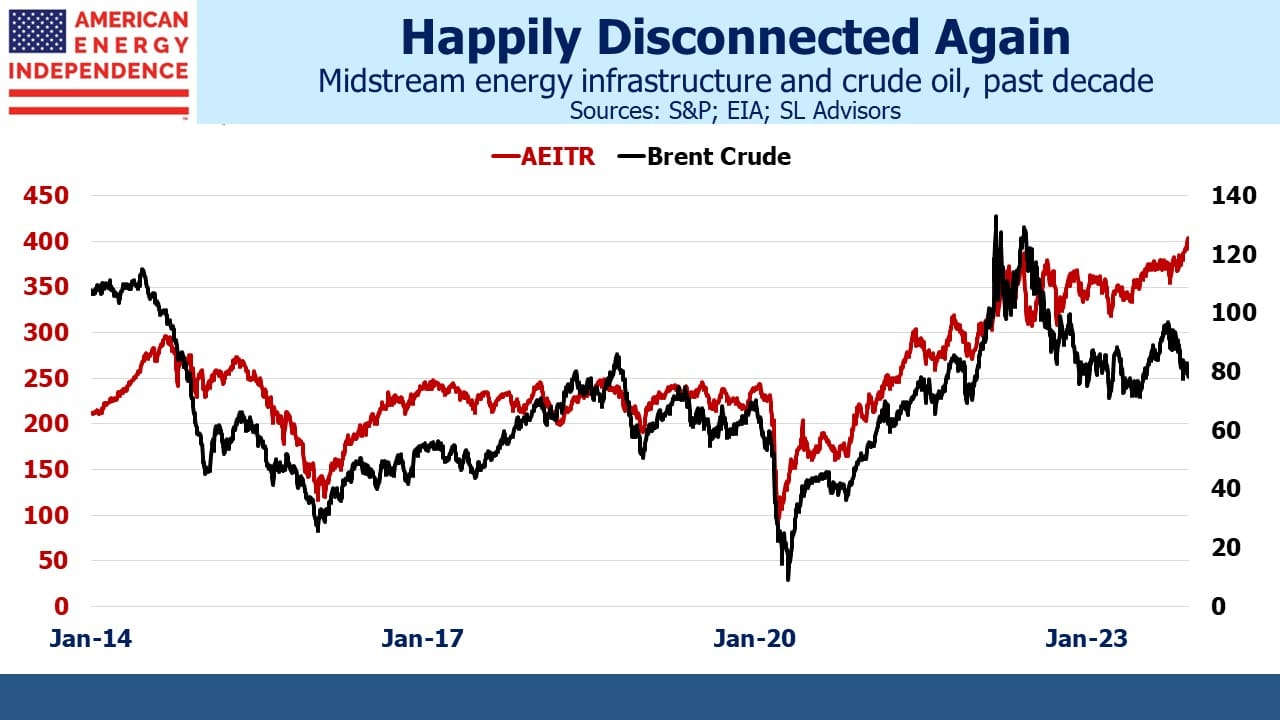
It’s therefore been an opportune moment for midstream energy infrastructure, as represented by the American Energy Independence Index (AEITR) to separate itself from oil and move higher.
The chart shows the two started to move more synchronously in 2015. This was roughly when the global oil market woke up to the increased supply provided by the US shale revolution. Pipeline companies had increased their capex to support higher volumes. This increased their sensitivity to oil prices, exacerbated by increasing leverage.
The “toll road” model of MLPs became deeply discredited. Distribution cuts followed. Corporations fared far better than MLPs. The current quarterly distribution of the Alerian MLP ETF (AMLP) remains 41% below its 2016 peak. This distribution is also now all classified as ordinary income, rather than as a return of capital which acts as a deferral of taxes (see AMLP Fails Its Investors Again).
The pandemic brought another co-ordinated swoon in oil prices and pipeline stocks, although both soon recovered, leaving only the hapless investors in closed end MLP funds with any lasting damage since they’d had to delever at the lows (see MLP Closed End Funds – Masters Of Value Destruction).
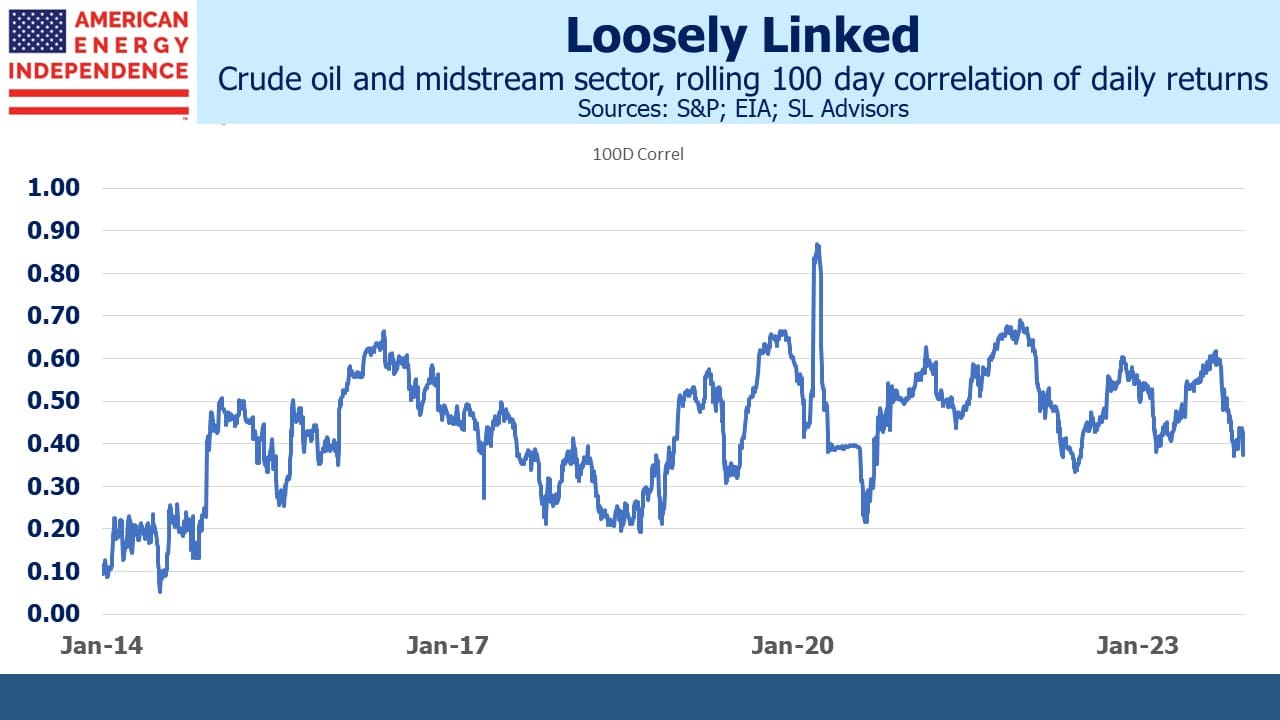
The most recent 100-day correlation of oil and pipelines is close to the lowest in five years. Midstream earnings have been reliably good every quarter this year, with companies regularly meeting or beating expectations and offering improved forward guidance. This is what’s behind the 14% YTD return, meaningfully ahead of the S&P Energy ETF (XLE) which is –3% YTD.
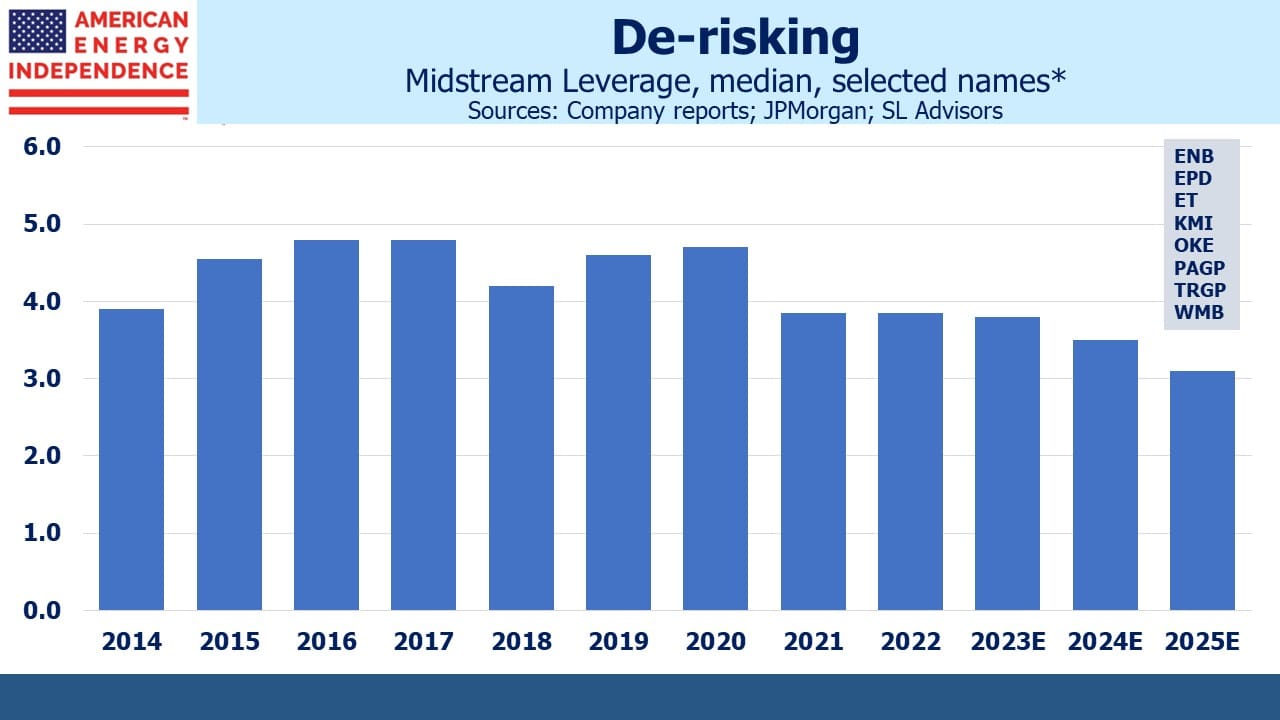
Although it’s not blindingly obvious from the correlation chart, the weaker recent relationship between crude prices and pipeline stocks has coincided with declining leverage. This makes sense – stronger balance sheets are better able to withstand fluctuations in throughput. We have always believed the sector’s sensitivity to commodity prices reflected the vagaries of investor sentiment more than revised expectations of cash flows. But as Debt:EBITDA has fallen back below 4.0X to 3.5X on its way towards 3.0X, the frustrating link with oil has moderated.
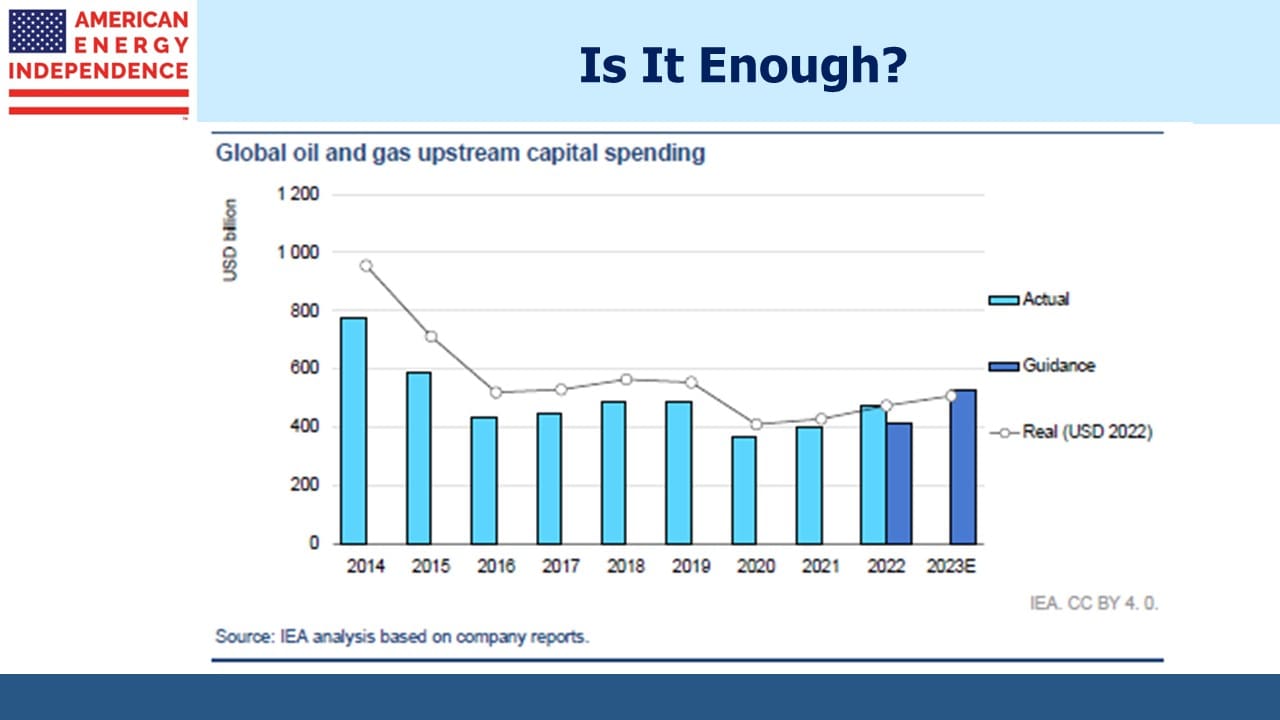
This has been accompanied by US crude output that recently set a new record of 13.2 Million Barrels per Day (MMB/D). Consensus early this year was that US production would grow slowly given the declining quality of undrilled shale wells and continued capital discipline. But E&P companies are demonstrating improved capital efficiency, producing more per dollar of capex. Chevron CEO Mike Wirth recently made this point on CNBC when Becky Quick asked why capex was lower than in recent years in spite of the recovery in prices and Administration pleas to pump more (for now, anyway).
Investors committing capital to the sector understand that current 6-7% yields are excessive given the declining risk profile. Infrastructure assets with visible, stable cashflows have drawn buyers this year even with the Fed raising rates.
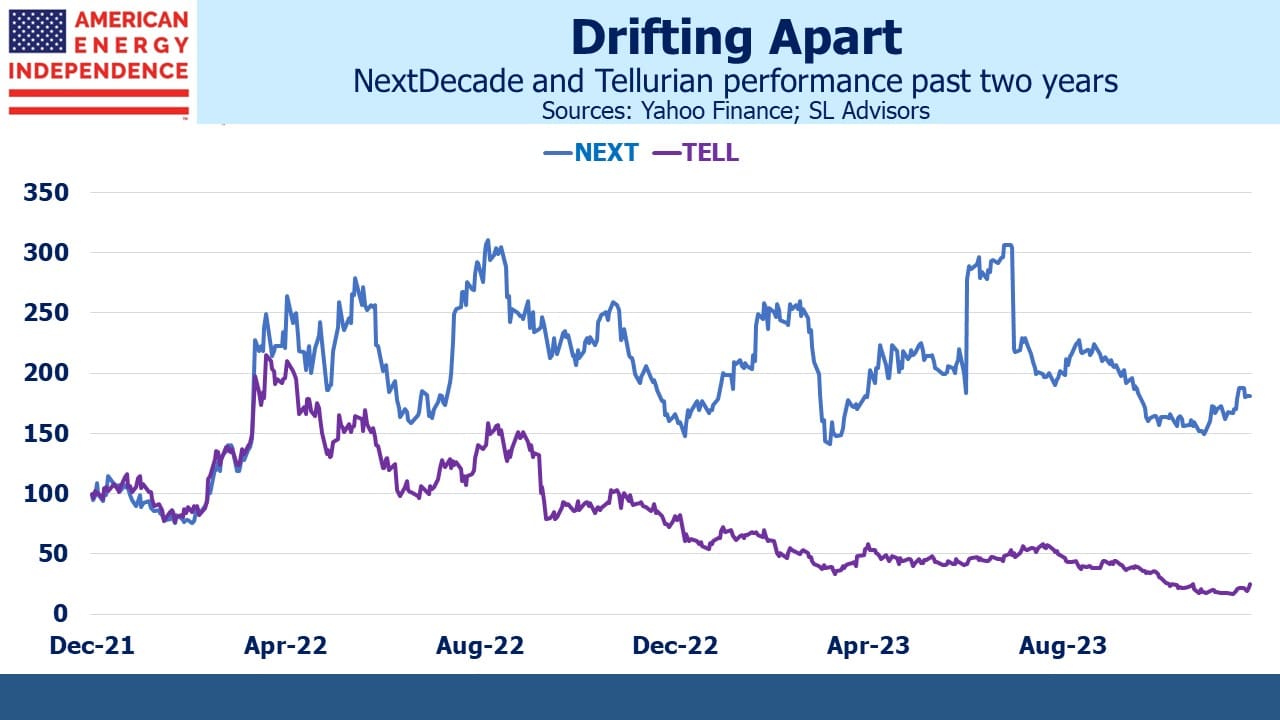
Tellurian (TELL) CEO Charif Souki was just ousted from Tellurian, the second time an LNG company he founded has given him the boot. TELL has struggled to get their Driftwood LNG facility started, in large part because Souki’s long term bullish view on global natural gas prices led to TELL retaining price risk on their liquefaction contracts. The consequent higher risk profile has made financing harder to obtain. Delays have allowed buyers to cancel contracts, further imperiling the company’s ability to raise capital.
The contrast with NextDecade (NEXT) is striking. Two years ago both companies were signing long term contracts to supply LNG and negotiating with investors for the capital to build their respective greenfield LNG terminals. Breakthroughs and disappointments caused sharp moves in both stocks. But NEXT achieved Final Investment Decision (FID) on their Rio Grande facility in the summer. The market has become steadily more skeptical that TELL will similarly reach FID on their Driftwood project.
Last month TELL warned investors there was substantial doubt about its ability to remain a going concern.
Carl Icahn figured long ago that Souki was a visionary but not the guy you want running the business, which led to Souki’s ouster from Cheniere in 2015. His compensation has been notoriously high and divorced from tangible results. He was recently paid $20 million (watch Tellurian Pays For Performance in Advance). The board finally had enough. Souki’s oversized risk appetite and compensation persuaded us and many others to invest elsewhere a long time ago.
We have three have funds that seek to profit from this environment:

Important Disclosures
The information provided is for informational purposes only and investors should determine for themselves whether a particular service, security or product is suitable for their investment needs. The information contained herein is not complete, may not be current, is subject to change, and is subject to, and qualified in its entirety by, the more complete disclosures, risk factors and other terms that are contained in the disclosure, prospectus, and offering. Certain information herein has been obtained from third party sources and, although believed to be reliable, has not been independently verified and its accuracy or completeness cannot be guaranteed. No representation is made with respect to the accuracy, completeness or timeliness of this information. Nothing provided on this site constitutes tax advice. Individuals should seek the advice of their own tax advisor for specific information regarding tax consequences of investments. Investments in securities entail risk and are not suitable for all investors. This site is not a recommendation nor an offer to sell (or solicitation of an offer to buy) securities in the United States or in any other jurisdiction.
References to indexes and benchmarks are hypothetical illustrations of aggregate returns and do not reflect the performance of any actual investment. Investors cannot invest in an index and do not reflect the deduction of the advisor’s fees or other trading expenses. There can be no assurance that current investments will be profitable. Actual realized returns will depend on, among other factors, the value of assets and market conditions at the time of disposition, any related transaction costs, and the timing of the purchase. Indexes and benchmarks may not directly correlate or only partially relate to portfolios managed by SL Advisors as they have different underlying investments and may use different strategies or have different objectives than portfolios managed by SL Advisors (e.g. The Alerian index is a group MLP securities in the oil and gas industries. Portfolios may not include the same investments that are included in the Alerian Index. The S & P Index does not directly relate to investment strategies managed by SL Advisers.)
This site may contain forward-looking statements relating to the objectives, opportunities, and the future performance of the U.S. market generally. Forward-looking statements may be identified by the use of such words as; “believe,” “expect,” “anticipate,” “should,” “planned,” “estimated,” “potential” and other similar terms. Examples of forward-looking statements include, but are not limited to, estimates with respect to financial condition, results of operations, and success or lack of success of any particular investment strategy. All are subject to various factors, including, but not limited to general and local economic conditions, changing levels of competition within certain industries and markets, changes in interest rates, changes in legislation or regulation, and other economic, competitive, governmental, regulatory and technological factors affecting a portfolio’s operations that could cause actual results to differ materially from projected results. Such statements are forward-looking in nature and involves a number of known and unknown risks, uncertainties and other factors, and accordingly, actual results may differ materially from those reflected or contemplated in such forward-looking statements. Prospective investors are cautioned not to place undue reliance on any forward-looking statements or examples. None of SL Advisors LLC or any of its affiliates or principals nor any other individual or entity assumes any obligation to update any forward-looking statements as a result of new information, subsequent events or any other circumstances. All statements made herein speak only as of the date that they were made. r
Certain hyperlinks or referenced websites on the Site, if any, are for your convenience and forward you to third parties’ websites, which generally are recognized by their top level domain name. Any descriptions of, references to, or links to other products, publications or services does not constitute an endorsement, authorization, sponsorship by or affiliation with SL Advisors LLC with respect to any linked site or its sponsor, unless expressly stated by SL Advisors LLC. Any such information, products or sites have not necessarily been reviewed by SL Advisors LLC and are provided or maintained by third parties over whom SL Advisors LLC exercise no control. SL Advisors LLC expressly disclaim any responsibility for the content, the accuracy of the information, and/or quality of products or services provided by or advertised on these third-party sites.
All investment strategies have the potential for profit or loss. Different types of investments involve varying degrees of risk, and there can be no assurance that any specific investment will be suitable or profitable for a client’s investment portfolio.
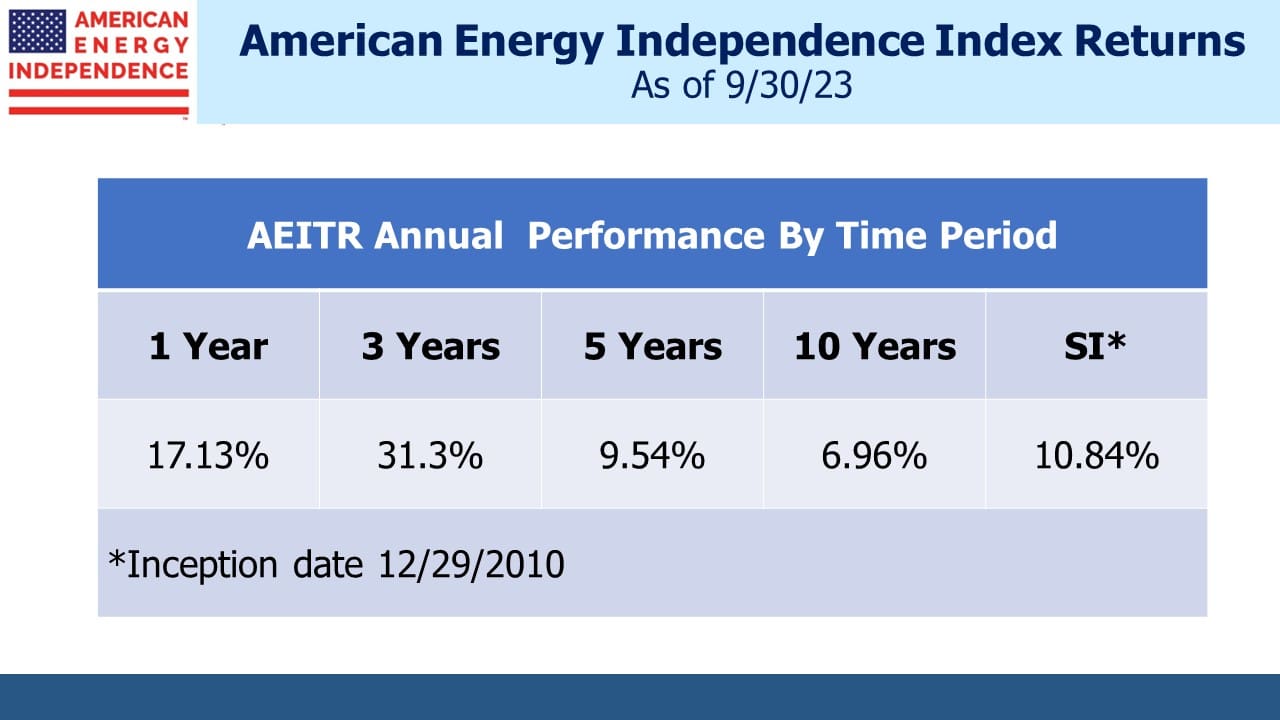
Past performance of the American Energy Independence Index is not indicative of future returns.


Leave a Reply
Want to join the discussion?Feel free to contribute!