Inflation – Back By Popular Demand
Inflation is probably the biggest known risk facing equity markets today. Last week’s CPI report was expected to be high and still exceeded expectations. The 4.2% year-on-year increase in the All Urban Consumers index (CPI-U) was boosted by comparisons with a year ago. The Fed, and many economists, have warned of the transitory base effects as weak readings from the start of lockdowns drop out. The CPI-U less food and energy is running at 3% p.a., although as is often pointed out eating and driving are not optional even if their costs are volatile. Most striking was the 0.9% monthly jump in CPI-U ex food and energy. Used cars and trucks were up 10% and contributed a third.
The Fed expects inflation to temporarily increase before supply constraints ease, moderating price hikes. Investors aren’t so sure, given the Fed’s stated willingness to tolerate higher inflation until they’re sure we’ve reached full employment. Under such circumstances, the term structure of interest rates should reflect a premium above the Fed’s guidance. The FOMC projects an unchanged policy rate through at least 2023, whereas eurodollar futures are priced for tightening at the start of 2023 and 0.75% by year’s end.
We’ve noted before the FOMC’s poor forecasting record, even of their own policy rate (see Bond Market Looks Past Fed). Markets are skeptical about the Fed’s resolve to maintain expansionary policies in the face of rising inflation. It’s analogous to when a central bank defends a currency peg. Credibility counts for much, and the 0.75% gap between market rates and FOMC projections measures the degree of investors’ disbelief.
Price hikes are visible everywhere. Many corporations report price pressures. Warren Buffett noted that suppliers were increasing costs to them which were being passed on and accepted by customers of Berkshire’s many operating businesses. Hiring is hard. The non-farm payroll report fell well short of the one million jobs expected, but rising hourly earnings suggest more labor tightness than the 6.1% unemployment rate implies. There’s reason to suspect that job growth was constrained by insufficient availability of qualified people.
Criticizing the Fed is a time-honored self-indulgence but not very profitable. More useful is to figure out how to act on it. Partial debt monetization synchronized with excessive fiscal stimulus is so obviously designed to cause inflation that investors should align themselves with the government’s actions, not their benign inflation forecast.
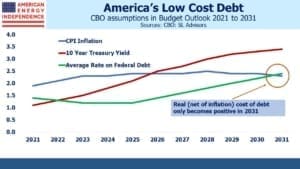
Total Federal debt is $28TN. Its cost of financing will increasingly drive America’s fiscal outlook. Many will be surprised to learn that the Congressional Budget Office (CBO) expects net interest expense as a % of GDP to fall over the next few years – a consequence of higher yielding securities maturing and being replaced. The average rate on government debt will fall from 2.1% last year to 1.2% in 2023 before climbing back up to 2.2% by 2030.
Fiscal conservatives will identify much of concern in this. Ten-year market-based inflation expectations are above 2.5%, a level the CBO doesn’t expect even in a single year. In March the CBO forecast the ten-year treasury will average 1.1% this year, whereas it’s already averaged 1.4% over the first four months or so.
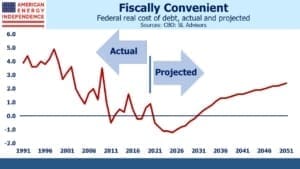
Moreover, the CBO forecasts that the Federal government’s real cost of debt, defined here as the average rate less CPI-U inflation, is about to go negative and remain there for the next decade. U.S. Debt:GDP is forecast to reach 107% by 2031, the highest in the nation’s history. Is it reasonable to expect that the U.S. will borrow at negative real rates with such a fiscal outlook?
As sobering as these charts are, the MMT crowd (see Modern Monetary Theory Goes Mainstream) will press to exploit the underutilized borrowing capacity negative real rates imply.
This is why the Fed’s continued bond buying is poorly advised. The risks to America’s fiscal outlook are skewed in one direction. It’s likely that the CBO’s projection of negative borrowing costs for the next decade will require continued growth in the Fed’s balance sheet. The Fed may be right that inflation will return to 2% next year, but they face asymmetric risks.
Prudent management should have prompted them to dial back as soon as it became clear that the stimulus checks were being distributed coincident with the vaccine. They should have withdrawn when there was no political pressure to continue. If fiscal profligacy drives rates higher, MMT proponents (i.e. progressive Democrats) in Congress will be quick to pressure the Fed back in.
But the Fed didn’t — and America’s fiscal outlook increasingly relies on negative real rates to fund its debt, which means higher inflation, more debt monetization, or both. As Washington pursues additional spending on infrastructure and welfare, further increases in borrowing are the path of least resistance.
Markets are adjusting to the new normal. Pipelines are cheap and may be one of the few sectors to offer inflation protection.
We are invested in all the components of the American Energy Independence Index via the ETF that seeks to track its performance.
Important Disclosures
The information provided is for informational purposes only and investors should determine for themselves whether a particular service, security or product is suitable for their investment needs. The information contained herein is not complete, may not be current, is subject to change, and is subject to, and qualified in its entirety by, the more complete disclosures, risk factors and other terms that are contained in the disclosure, prospectus, and offering. Certain information herein has been obtained from third party sources and, although believed to be reliable, has not been independently verified and its accuracy or completeness cannot be guaranteed. No representation is made with respect to the accuracy, completeness or timeliness of this information. Nothing provided on this site constitutes tax advice. Individuals should seek the advice of their own tax advisor for specific information regarding tax consequences of investments. Investments in securities entail risk and are not suitable for all investors. This site is not a recommendation nor an offer to sell (or solicitation of an offer to buy) securities in the United States or in any other jurisdiction.
References to indexes and benchmarks are hypothetical illustrations of aggregate returns and do not reflect the performance of any actual investment. Investors cannot invest in an index and do not reflect the deduction of the advisor’s fees or other trading expenses. There can be no assurance that current investments will be profitable. Actual realized returns will depend on, among other factors, the value of assets and market conditions at the time of disposition, any related transaction costs, and the timing of the purchase. Indexes and benchmarks may not directly correlate or only partially relate to portfolios managed by SL Advisors as they have different underlying investments and may use different strategies or have different objectives than portfolios managed by SL Advisors (e.g. The Alerian index is a group MLP securities in the oil and gas industries. Portfolios may not include the same investments that are included in the Alerian Index. The S & P Index does not directly relate to investment strategies managed by SL Advisers.)
This site may contain forward-looking statements relating to the objectives, opportunities, and the future performance of the U.S. market generally. Forward-looking statements may be identified by the use of such words as; “believe,” “expect,” “anticipate,” “should,” “planned,” “estimated,” “potential” and other similar terms. Examples of forward-looking statements include, but are not limited to, estimates with respect to financial condition, results of operations, and success or lack of success of any particular investment strategy. All are subject to various factors, including, but not limited to general and local economic conditions, changing levels of competition within certain industries and markets, changes in interest rates, changes in legislation or regulation, and other economic, competitive, governmental, regulatory and technological factors affecting a portfolio’s operations that could cause actual results to differ materially from projected results. Such statements are forward-looking in nature and involves a number of known and unknown risks, uncertainties and other factors, and accordingly, actual results may differ materially from those reflected or contemplated in such forward-looking statements. Prospective investors are cautioned not to place undue reliance on any forward-looking statements or examples. None of SL Advisors LLC or any of its affiliates or principals nor any other individual or entity assumes any obligation to update any forward-looking statements as a result of new information, subsequent events or any other circumstances. All statements made herein speak only as of the date that they were made. r
Certain hyperlinks or referenced websites on the Site, if any, are for your convenience and forward you to third parties’ websites, which generally are recognized by their top level domain name. Any descriptions of, references to, or links to other products, publications or services does not constitute an endorsement, authorization, sponsorship by or affiliation with SL Advisors LLC with respect to any linked site or its sponsor, unless expressly stated by SL Advisors LLC. Any such information, products or sites have not necessarily been reviewed by SL Advisors LLC and are provided or maintained by third parties over whom SL Advisors LLC exercise no control. SL Advisors LLC expressly disclaim any responsibility for the content, the accuracy of the information, and/or quality of products or services provided by or advertised on these third-party sites.
All investment strategies have the potential for profit or loss. Different types of investments involve varying degrees of risk, and there can be no assurance that any specific investment will be suitable or profitable for a client’s investment portfolio.
Past performance of the American Energy Independence Index is not indicative of future returns.


Leave a Reply
Want to join the discussion?Feel free to contribute!