Even After A 30% One Year Return, Pipelines Remain Cheap

/
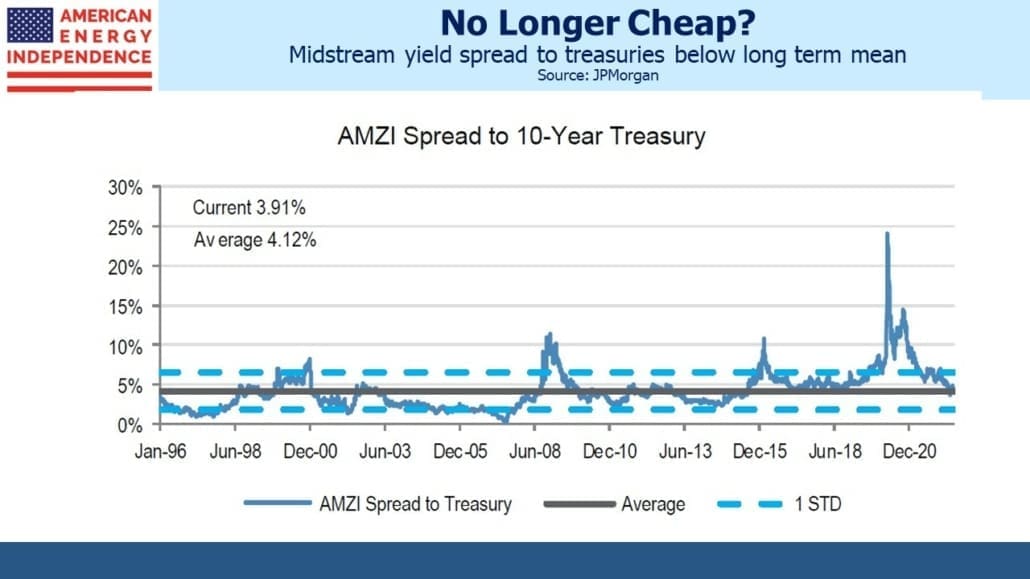
When the MLP structure dominated midstream energy infrastructure almost a decade ago, yield was a popular valuation metric. MLPs typically paid out 90% or more (sometimes over 100%) of their Distributable Cash Flow (DCF). Comparing MLP yields with the ten year treasury provided a measure of historic valuation.
By this metric, midstream isn’t cheap. The MLP spread is 0.20% narrower than 25 year average.
But much has changed for the sector in recent years. C-corps are the prevailing corporate form. Financial discipline has returned after the profligacy of a few during the Shale Revolution. Growth capex has declined, helped by opposition from climate extremists (hug one and offer a drive) whose success in stalling projects has given pipeline companies one less thing to do with their cash. It’s also increased the value of existing infrastructure. More recently, war in Europe has made energy security a political objective for the first time in living memory.
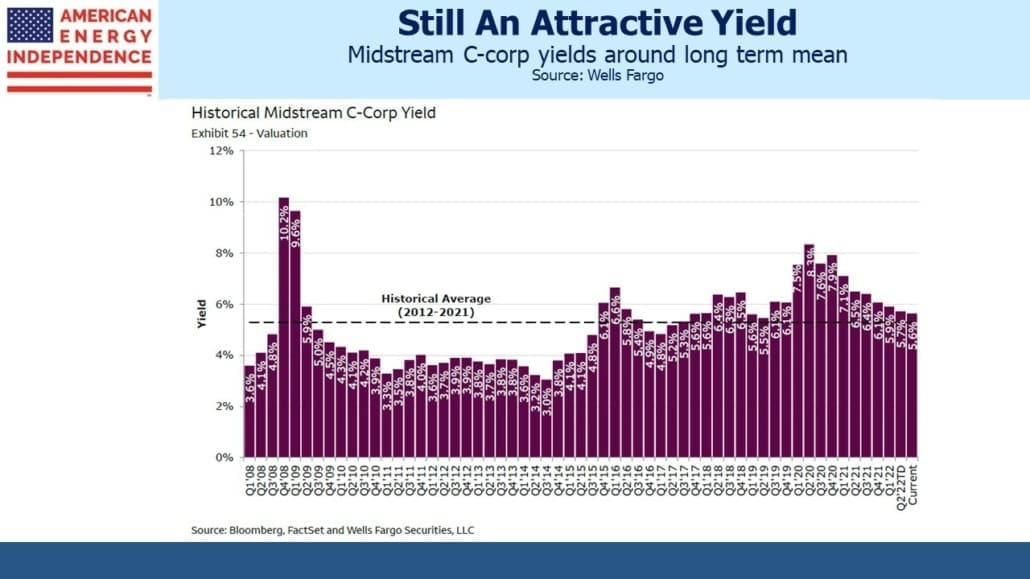
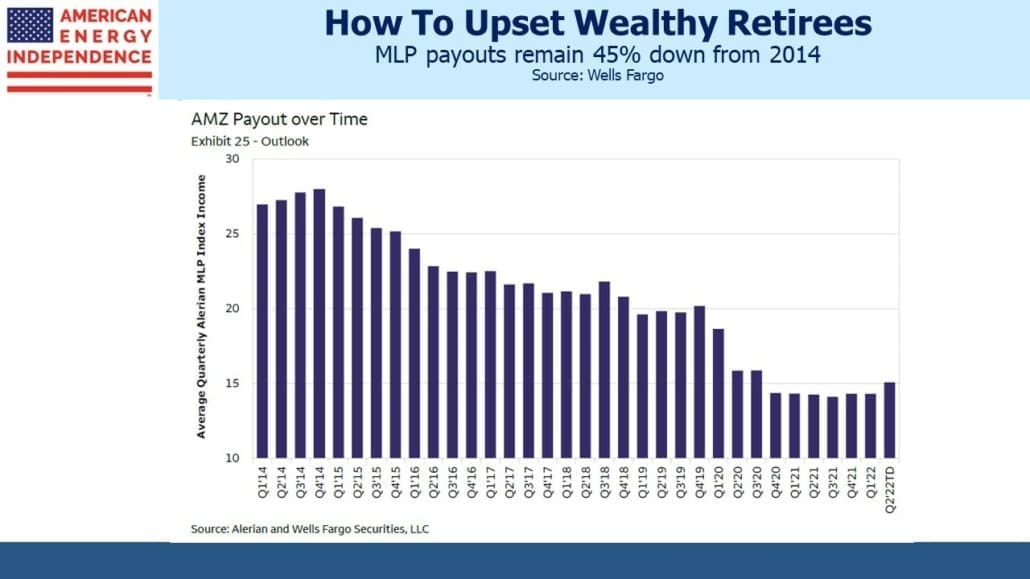
Midstream corporations tend to have lower yields than MLPs but have maintained dividends more reliably. MLP payouts have slid by almost half over the past eight years. There remains a valuation discount in retaining the MLP structure. Enterprise Products Partners, one of the best run MLPs, still yields 6.6% even though they maintained their distribution through the five year bear market that climaxed with Covid in 2020.
It’s also worth noting that, although sector indices show March 2020 was the lowest the sector has traded, c-corp yields never reached the highs of the 2008 financial crisis. We have often noted that forced selling by recklessly leveraged MLP closed end funds created the Covid low of 2020 (see MLP Closed End Funds – Masters Of Value Destruction). The chart of c-corp yields is another piece of evidence in support of our view.
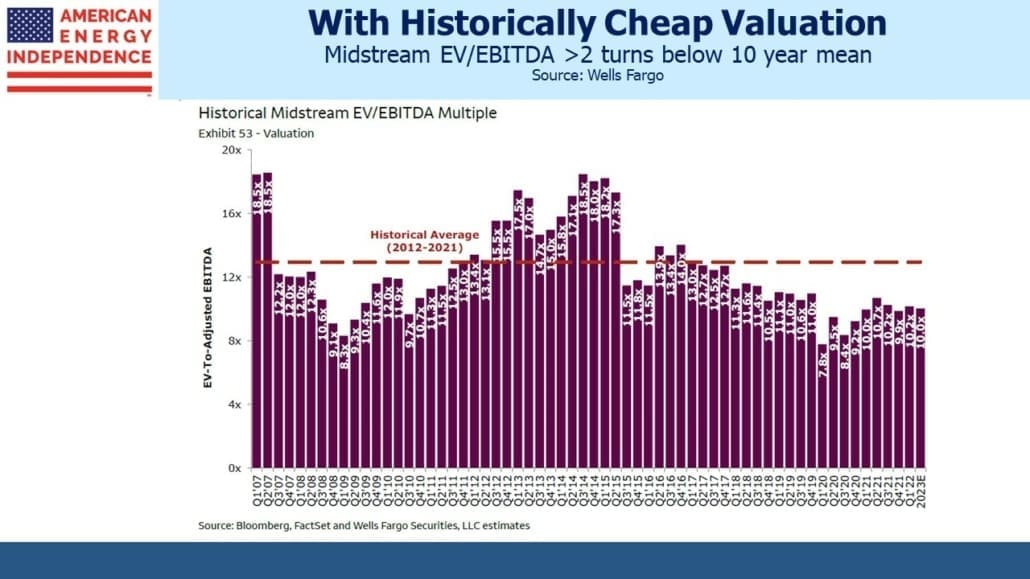
Using Enterprise Value to Earnings Before Interest, Taxes, Depreciation and Amortization (EV/EBITDA), the midstream sector is substantially cheaper than its average over the past decade. It’s also worth noting that today’s 10.2X multiple is barely changed from a year ago, even though the American Energy Independence Index (AEITR) has returned 38% since May 2021. The sector’s performance has tracked EBITDA growth.
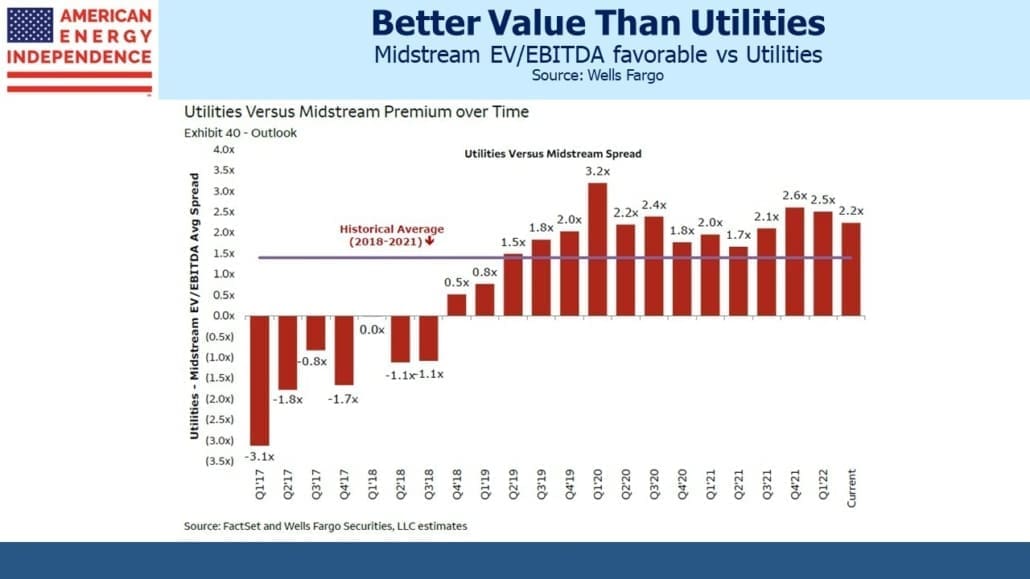
The pipeline sector is historically cheap versus utilities, often a point of comparison.
If the pipeline sector’s EV/EBITDA widens towards its ten year average of 12.5, this would trigger meaningful price appreciation. With the typical company funding about half its operations with debt, a 20% appreciation in enterprise value would translate into a 40% increase in equity. If such an adjustment took place over five years, this would imply an annual 7% capital appreciation. Add in a 5% dividend yield and you get a 12% total annual return over several years.
When investors ask us about our outlook for returns, this is the type of math we run through. The price history creates concern for some potential investors that after such a strong rally another drop is coming. But the math of valuations along with the evidence noted above that MLP closed end funds caused more trouble than they’re worth ought to assuage such worries.
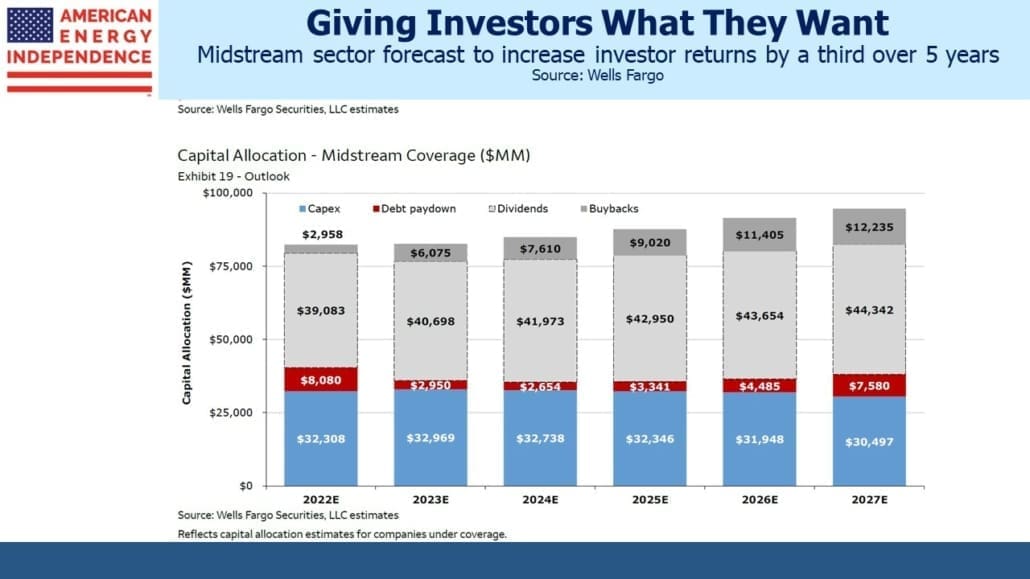
The capital allocation chart should provide further comfort about the pipeline sector’s long run prospects. Wells Fargo is projecting a 2.5% growth rate for dividends, and a 4X jump in buybacks. Capex is expected to stay flat, with roughly half dedicated to maintaining existing infrastructure (“sustaining capex”) and the balance for new growth projects. US energy executives show little inclination to push up spending initiatives. They recognize how fickle public policy is.
Democrats’ concern about gasoline prices has leavened somewhat their hostility to traditional energy – but few believe it’s anything more than political tactics prior to the midterms. Multi-year capital investments in oil, gas and related infrastructure still come with a highly uncertain IRR.
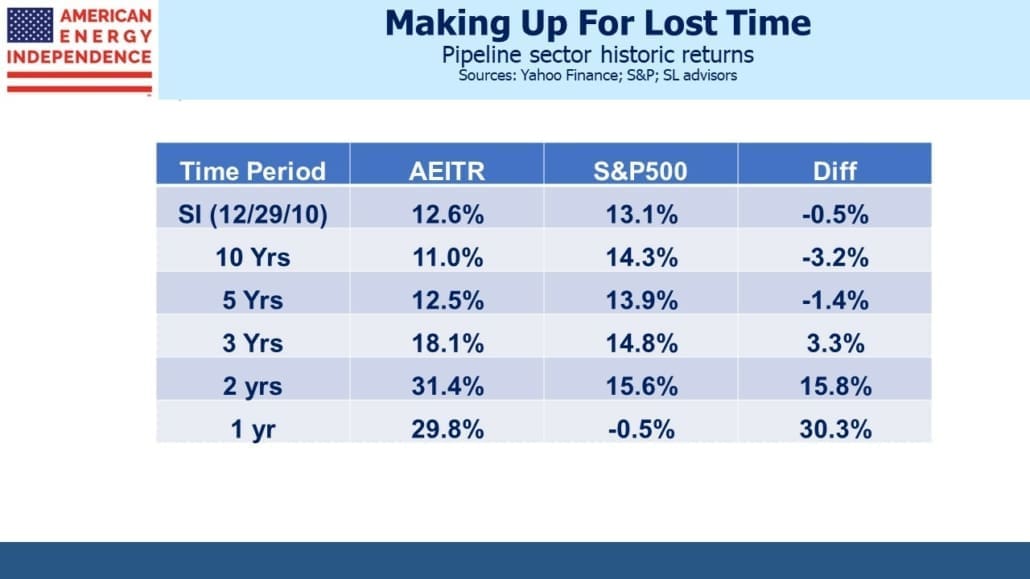
The 2.5% dividend growth rate can be added to the 12% projected return derived above. This is why a mid-teens, 14-15% pa total return is a reasonable bet even after recent strong performance. The AEITR’s long term returns versus the market no longer reflect substantial underperformance. Over the past one, two and three years pipelines have beaten the market. A few good days will make that true over the past five years as well.
Meanwhile Russia’s invasion of Ukraine can never be undone. Global energy trade is transitioning to reflect geopolitical and national security objectives, not simply commercial ones. Most countries either have energy independence or have no hope of attaining it. America is exceptional, in that we achieved it. US natural gas stands poised to provide secure energy supplies that often displace coal. The sector continues to offer fine prospects.
We have three funds that seek to profit from this environment:
Please see important Legal Disclosures.

Important Disclosures
The information provided is for informational purposes only and investors should determine for themselves whether a particular service, security or product is suitable for their investment needs. The information contained herein is not complete, may not be current, is subject to change, and is subject to, and qualified in its entirety by, the more complete disclosures, risk factors and other terms that are contained in the disclosure, prospectus, and offering. Certain information herein has been obtained from third party sources and, although believed to be reliable, has not been independently verified and its accuracy or completeness cannot be guaranteed. No representation is made with respect to the accuracy, completeness or timeliness of this information. Nothing provided on this site constitutes tax advice. Individuals should seek the advice of their own tax advisor for specific information regarding tax consequences of investments. Investments in securities entail risk and are not suitable for all investors. This site is not a recommendation nor an offer to sell (or solicitation of an offer to buy) securities in the United States or in any other jurisdiction.
References to indexes and benchmarks are hypothetical illustrations of aggregate returns and do not reflect the performance of any actual investment. Investors cannot invest in an index and do not reflect the deduction of the advisor’s fees or other trading expenses. There can be no assurance that current investments will be profitable. Actual realized returns will depend on, among other factors, the value of assets and market conditions at the time of disposition, any related transaction costs, and the timing of the purchase. Indexes and benchmarks may not directly correlate or only partially relate to portfolios managed by SL Advisors as they have different underlying investments and may use different strategies or have different objectives than portfolios managed by SL Advisors (e.g. The Alerian index is a group MLP securities in the oil and gas industries. Portfolios may not include the same investments that are included in the Alerian Index. The S & P Index does not directly relate to investment strategies managed by SL Advisers.)
This site may contain forward-looking statements relating to the objectives, opportunities, and the future performance of the U.S. market generally. Forward-looking statements may be identified by the use of such words as; “believe,” “expect,” “anticipate,” “should,” “planned,” “estimated,” “potential” and other similar terms. Examples of forward-looking statements include, but are not limited to, estimates with respect to financial condition, results of operations, and success or lack of success of any particular investment strategy. All are subject to various factors, including, but not limited to general and local economic conditions, changing levels of competition within certain industries and markets, changes in interest rates, changes in legislation or regulation, and other economic, competitive, governmental, regulatory and technological factors affecting a portfolio’s operations that could cause actual results to differ materially from projected results. Such statements are forward-looking in nature and involves a number of known and unknown risks, uncertainties and other factors, and accordingly, actual results may differ materially from those reflected or contemplated in such forward-looking statements. Prospective investors are cautioned not to place undue reliance on any forward-looking statements or examples. None of SL Advisors LLC or any of its affiliates or principals nor any other individual or entity assumes any obligation to update any forward-looking statements as a result of new information, subsequent events or any other circumstances. All statements made herein speak only as of the date that they were made. r
Certain hyperlinks or referenced websites on the Site, if any, are for your convenience and forward you to third parties’ websites, which generally are recognized by their top level domain name. Any descriptions of, references to, or links to other products, publications or services does not constitute an endorsement, authorization, sponsorship by or affiliation with SL Advisors LLC with respect to any linked site or its sponsor, unless expressly stated by SL Advisors LLC. Any such information, products or sites have not necessarily been reviewed by SL Advisors LLC and are provided or maintained by third parties over whom SL Advisors LLC exercise no control. SL Advisors LLC expressly disclaim any responsibility for the content, the accuracy of the information, and/or quality of products or services provided by or advertised on these third-party sites.
All investment strategies have the potential for profit or loss. Different types of investments involve varying degrees of risk, and there can be no assurance that any specific investment will be suitable or profitable for a client’s investment portfolio.
Past performance of the American Energy Independence Index is not indicative of future returns.


There are still solid and significant MLPs with irrationally high yields due to irrationally low unit prices. CEQP today yields 8.83% and MPLX today yields 8.57%. These are significant companies with excellent management and substantial operations. On a more aggressive and less financially solid basis USAC yields 11.25% and has never reduced its distribution notwithstanding its leverage ratio.