Do Pipelines Move With Crude?
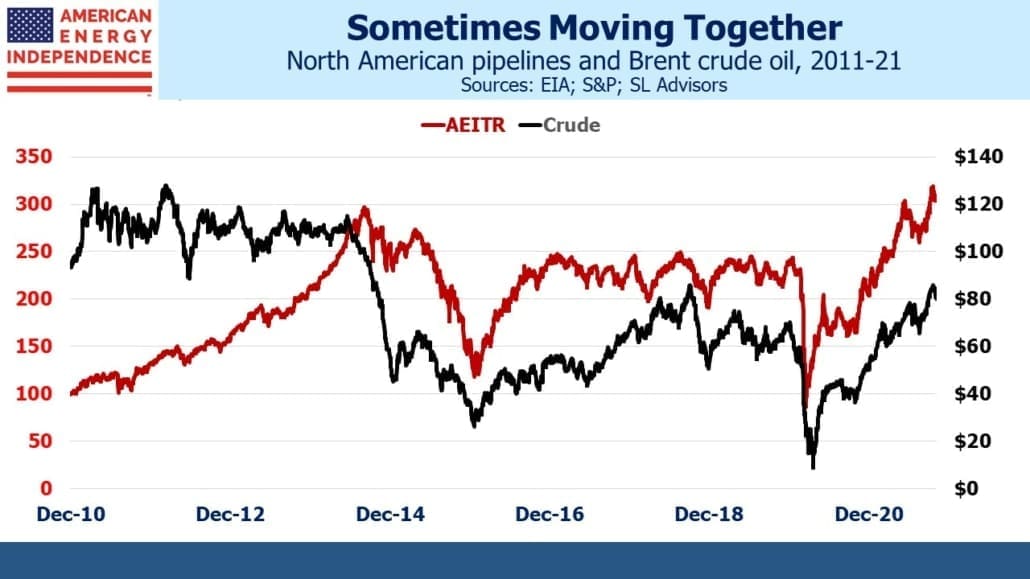
We often get questions on the correlation between pipeline stocks and crude oil. Most investors intuitively believe they are linked – and inconveniently they seem especially so when prices are falling. March of last year is a recent example.
Pipelines are a volume business — the “toll model” has often been used to describe the fact that it’s volumes passing through the pipelines, not the value of the commodity, that drive midstream economics. To the extent that high prices imply increased production it can appear that they should be related.
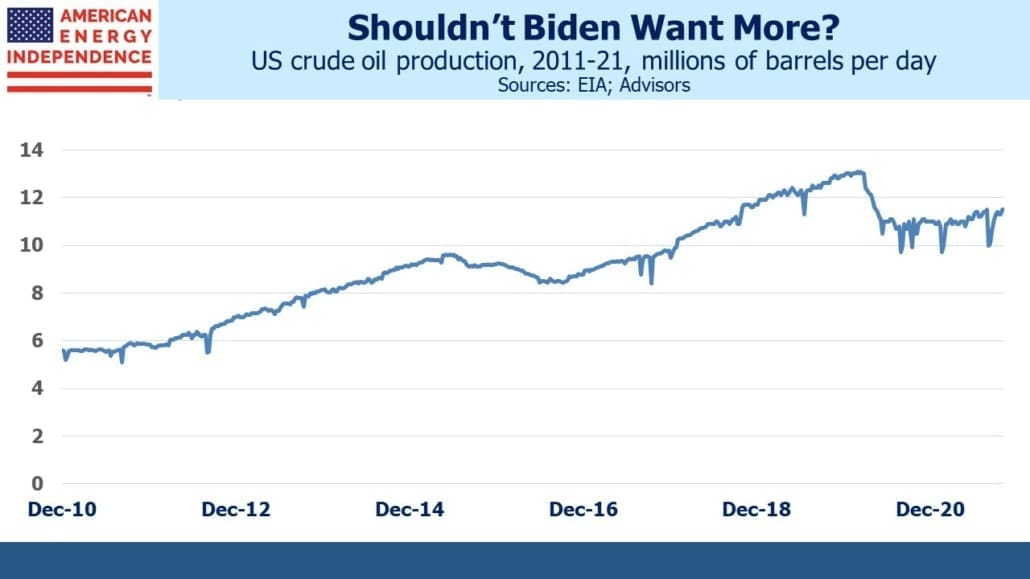
This year pipelines and crude oil have both marched higher, propelled by the strong economic recovery from covid and restrained investment in new output by energy companies. US oil production remains 1.5 Million Barrels per Day (MMB/D) below its pre-covid peak. The volume-driven pipeline industry ought to be suffering with less crude oil passing through its infrastructure – except that the industry’s new financial discipline has driven free cash flow higher.
Lower volumes are a result of constrained growth capex, both among the upstream customers of pipelines as well as the midstream sector itself.
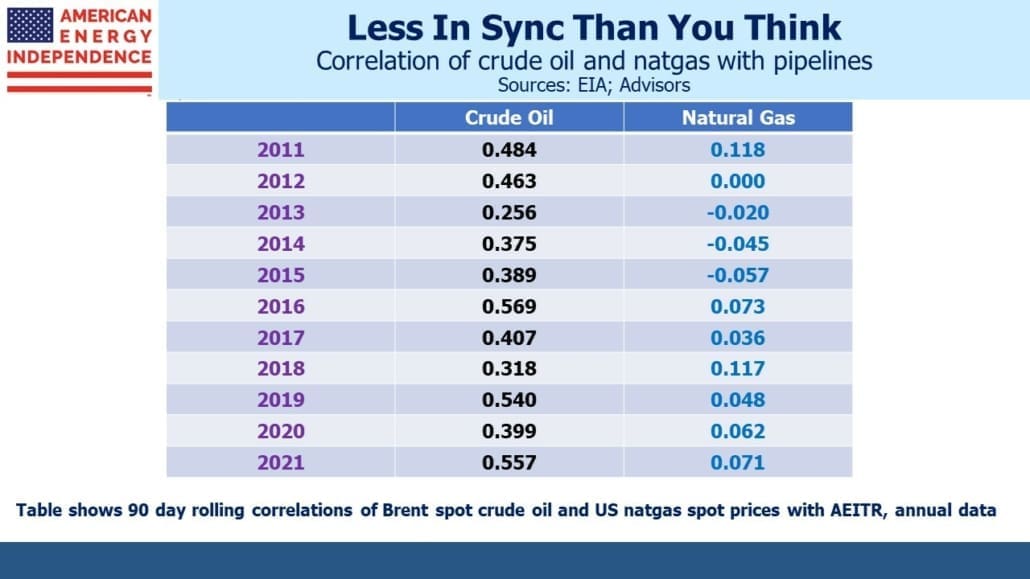
Although visually crude oil and pipelines (defined here as the American Energy Independence Index, AEITR) move together, the correlation isn’t that high. Over the past decade the average 90 day rolling correlation of daily returns is 0.41. As the table shows, year by year it doesn’t stray too far from that.
In 2015 when crude oil and pipeline stocks were falling, some clients asked us if we’d considered hedging by shorting crude oil futures. It was a reasonable question, since the sector seemed to follow oil prices relentlessly lower. But the correlation shows that it’s really a weak relationship. And the devil is in the details – any hedge would require a hedge ratio. How much crude oil should a portfolio short in order to hedge its equity exposure? The unstable relationship means that the choice of hedge ratio would depend on the past time period examined, revealing it to be a somewhat arbitrary choice.
Unable to identify a reliable hedging strategy we rejected the suggestion. In mid-2017 such a fund was launched (see Oil-Hedged MLP ETF Launches at Propitious Time) but it’s since closed, confirming how hard it is to get the hedge ratio right.
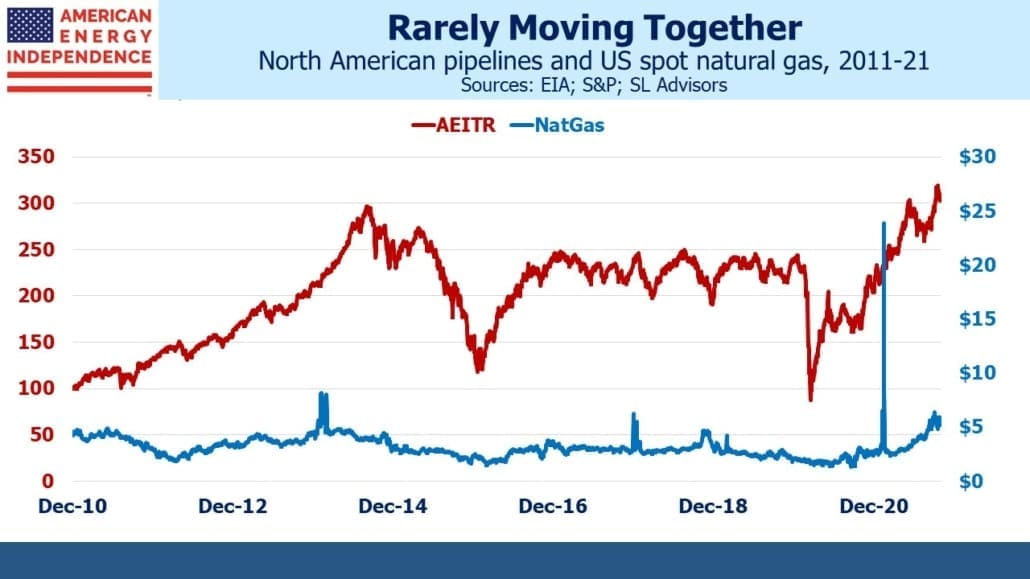
Natural gas is a more important source of cashflows for pipeline stocks than crude oil, but here the correlation is non-existent. The US is fortunate to possess decades worth of reserves of natural gas. Moreover, because exports of Liquified Natural Gas (LNG) are limited by the availability of specialized infrastructure to chill it down to 1/600th of its volume so it can be pumped onto an LNG tanker, US consumers have been mostly insulated from the energy crisis sweeping through Europe and Asia. EU governments and the UK have committed a series of policy errors in recent years. These include: becoming too reliant of intermittent solar and wind; cutting back local production and storage of natural gas; and relying too heavily on Russia’s capricious supply schedule.
Unexpectedly quiet weather in the normally blustery North Sea has once again cut electricity generation from windmills (see U.K. Power Prices Soar Above £2,000 on Low Winds). The £2,000 price per MWh cited should be compared with the $75-$140 range that US customers pay. Converted to US$, UK electricity is being sold for as much as $2,700, 20-36X times as much as American wholesale prices. Even the policymakers in California haven’t been able to screw up as badly. The UK government is subsidizing prices to avoid the political outcry that would quickly follow, so in effect the entire country is paying for past energy policy blunders.
Lowering CO2 emissions is a worthy goal, but examples of the folly of pursuing the agenda of climate extremists keep piling up.
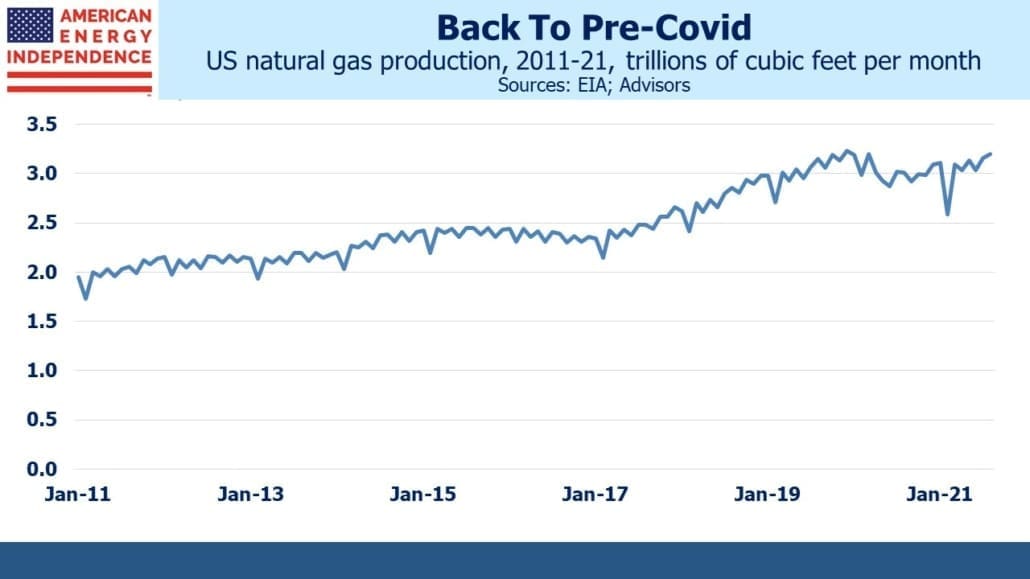
One of the most positive developments of the year for the pipeline sector has been the steady recovery in natural gas volumes. High crude prices have buoyed investor sentiment, but the return of domestic natural gas output to its pre-covid high represents a tangible benefit that has boosted earnings at companies such as Williams and Cheniere.
COP26 showed that emerging economies such as China and India continue to value raising living standards over reducing CO2 emissions. India’s per capita GDP is $1,900, compared with the US at $63K. Hundreds of millions of Indians live in poverty. Fighting global warming isn’t resonating with them or their government. The US can help by encouraging India and other countries to buy more natural gas and use less coal. That’s the pragmatic solution, and America is well positioned for it.
We have three funds that seek to profit from this environment:
Please see important Legal Disclosures.
Important Disclosures
The information provided is for informational purposes only and investors should determine for themselves whether a particular service, security or product is suitable for their investment needs. The information contained herein is not complete, may not be current, is subject to change, and is subject to, and qualified in its entirety by, the more complete disclosures, risk factors and other terms that are contained in the disclosure, prospectus, and offering. Certain information herein has been obtained from third party sources and, although believed to be reliable, has not been independently verified and its accuracy or completeness cannot be guaranteed. No representation is made with respect to the accuracy, completeness or timeliness of this information. Nothing provided on this site constitutes tax advice. Individuals should seek the advice of their own tax advisor for specific information regarding tax consequences of investments. Investments in securities entail risk and are not suitable for all investors. This site is not a recommendation nor an offer to sell (or solicitation of an offer to buy) securities in the United States or in any other jurisdiction.
References to indexes and benchmarks are hypothetical illustrations of aggregate returns and do not reflect the performance of any actual investment. Investors cannot invest in an index and do not reflect the deduction of the advisor’s fees or other trading expenses. There can be no assurance that current investments will be profitable. Actual realized returns will depend on, among other factors, the value of assets and market conditions at the time of disposition, any related transaction costs, and the timing of the purchase. Indexes and benchmarks may not directly correlate or only partially relate to portfolios managed by SL Advisors as they have different underlying investments and may use different strategies or have different objectives than portfolios managed by SL Advisors (e.g. The Alerian index is a group MLP securities in the oil and gas industries. Portfolios may not include the same investments that are included in the Alerian Index. The S & P Index does not directly relate to investment strategies managed by SL Advisers.)
This site may contain forward-looking statements relating to the objectives, opportunities, and the future performance of the U.S. market generally. Forward-looking statements may be identified by the use of such words as; “believe,” “expect,” “anticipate,” “should,” “planned,” “estimated,” “potential” and other similar terms. Examples of forward-looking statements include, but are not limited to, estimates with respect to financial condition, results of operations, and success or lack of success of any particular investment strategy. All are subject to various factors, including, but not limited to general and local economic conditions, changing levels of competition within certain industries and markets, changes in interest rates, changes in legislation or regulation, and other economic, competitive, governmental, regulatory and technological factors affecting a portfolio’s operations that could cause actual results to differ materially from projected results. Such statements are forward-looking in nature and involves a number of known and unknown risks, uncertainties and other factors, and accordingly, actual results may differ materially from those reflected or contemplated in such forward-looking statements. Prospective investors are cautioned not to place undue reliance on any forward-looking statements or examples. None of SL Advisors LLC or any of its affiliates or principals nor any other individual or entity assumes any obligation to update any forward-looking statements as a result of new information, subsequent events or any other circumstances. All statements made herein speak only as of the date that they were made. r
Certain hyperlinks or referenced websites on the Site, if any, are for your convenience and forward you to third parties’ websites, which generally are recognized by their top level domain name. Any descriptions of, references to, or links to other products, publications or services does not constitute an endorsement, authorization, sponsorship by or affiliation with SL Advisors LLC with respect to any linked site or its sponsor, unless expressly stated by SL Advisors LLC. Any such information, products or sites have not necessarily been reviewed by SL Advisors LLC and are provided or maintained by third parties over whom SL Advisors LLC exercise no control. SL Advisors LLC expressly disclaim any responsibility for the content, the accuracy of the information, and/or quality of products or services provided by or advertised on these third-party sites.
All investment strategies have the potential for profit or loss. Different types of investments involve varying degrees of risk, and there can be no assurance that any specific investment will be suitable or profitable for a client’s investment portfolio.
Past performance of the American Energy Independence Index is not indicative of future returns.


Leave a Reply
Want to join the discussion?Feel free to contribute!