Do Pipelines Move With Crude?
We often get questions on the correlation between pipeline stocks and crude oil. Most investors intuitively believe they are linked – and inconveniently they seem especially so when prices are falling. March of last year is a recent example.
Pipelines are a volume business — the “toll model” has often been used to describe the fact that it’s volumes passing through the pipelines, not the value of the commodity, that drive midstream economics. To the extent that high prices imply increased production it can appear that they should be related.
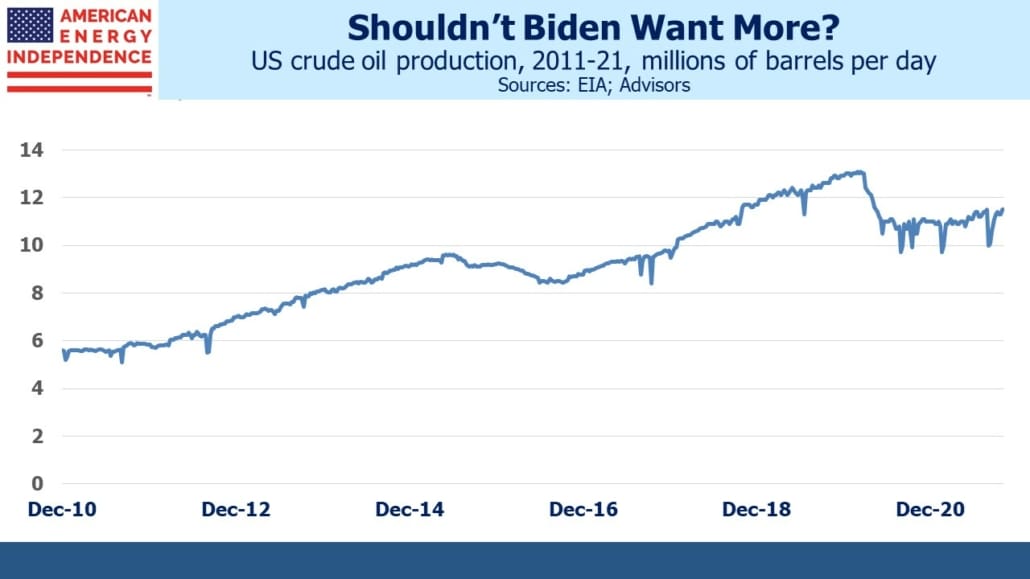
This year pipelines and crude oil have both marched higher, propelled by the strong economic recovery from covid and restrained investment in new output by energy companies. US oil production remains 1.5 Million Barrels per Day (MMB/D) below its pre-covid peak. The volume-driven pipeline industry ought to be suffering with less crude oil passing through its infrastructure – except that the industry’s new financial discipline has driven free cash flow higher.
Lower volumes are a result of constrained growth capex, both among the upstream customers of pipelines as well as the midstream sector itself.
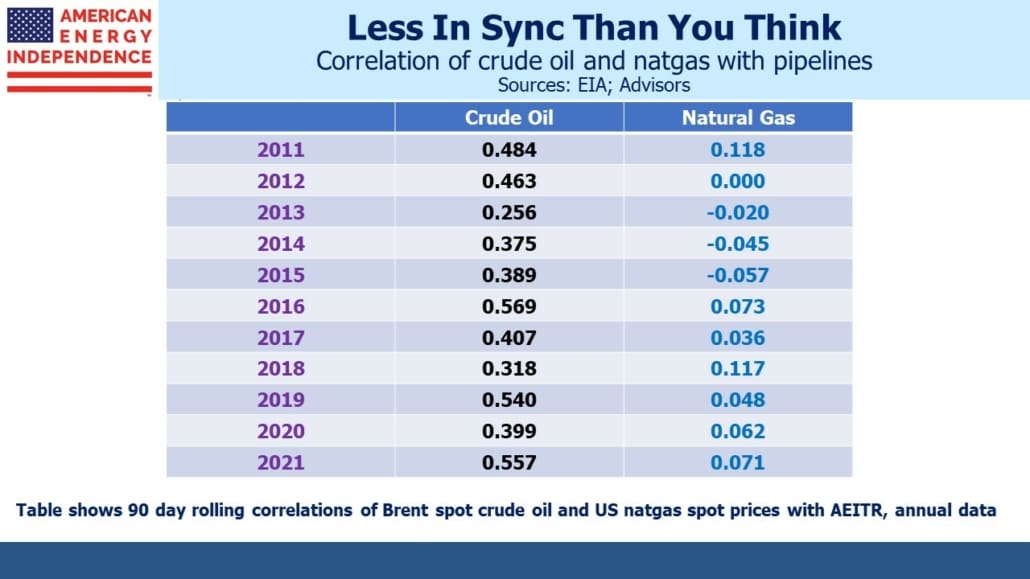
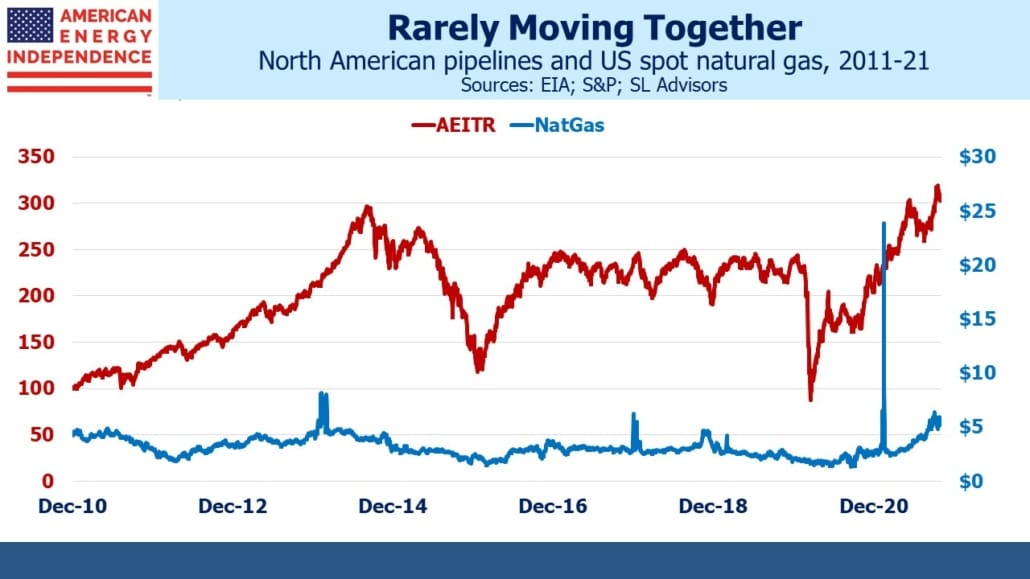
Although visually crude oil and pipelines (defined here as the American Energy Independence Index, AEITR) move together, the correlation isn’t that high. Over the past decade the average 90 day rolling correlation of daily returns is 0.41. As the table shows, year by year it doesn’t stray too far from that.
In 2015 when crude oil and pipeline stocks were falling, some clients asked us if we’d considered hedging by shorting crude oil futures. It was a reasonable question, since the sector seemed to follow oil prices relentlessly lower. But the correlation shows that it’s really a weak relationship. And the devil is in the details – any hedge would require a hedge ratio. How much crude oil should a portfolio short in order to hedge its equity exposure? The unstable relationship means that the choice of hedge ratio would depend on the past time period examined, revealing it to be a somewhat arbitrary choice.
Unable to identify a reliable hedging strategy we rejected the suggestion. In mid-2017 such a fund was launched (see Oil-Hedged MLP ETF Launches at Propitious Time) but it’s since closed, confirming how hard it is to get the hedge ratio right.
Natural gas is a more important source of cashflows for pipeline stocks than crude oil, but here the correlation is non-existent. The US is fortunate to possess decades worth of reserves of natural gas. Moreover, because exports of Liquified Natural Gas (LNG) are limited by the availability of specialized infrastructure to chill it down to 1/600th of its volume so it can be pumped onto an LNG tanker, US consumers have been mostly insulated from the energy crisis sweeping through Europe and Asia. EU governments and the UK have committed a series of policy errors in recent years. These include: becoming too reliant of intermittent solar and wind; cutting back local production and storage of natural gas; and relying too heavily on Russia’s capricious supply schedule.
Unexpectedly quiet weather in the normally blustery North Sea has once again cut electricity generation from windmills (see U.K. Power Prices Soar Above £2,000 on Low Winds). The £2,000 price per MWh cited should be compared with the $75-$140 range that US customers pay. Converted to US$, UK electricity is being sold for as much as $2,700, 20-36X times as much as American wholesale prices. Even the policymakers in California haven’t been able to screw up as badly. The UK government is subsidizing prices to avoid the political outcry that would quickly follow, so in effect the entire country is paying for past energy policy blunders.
Lowering CO2 emissions is a worthy goal, but examples of the folly of pursuing the agenda of climate extremists keep piling up.
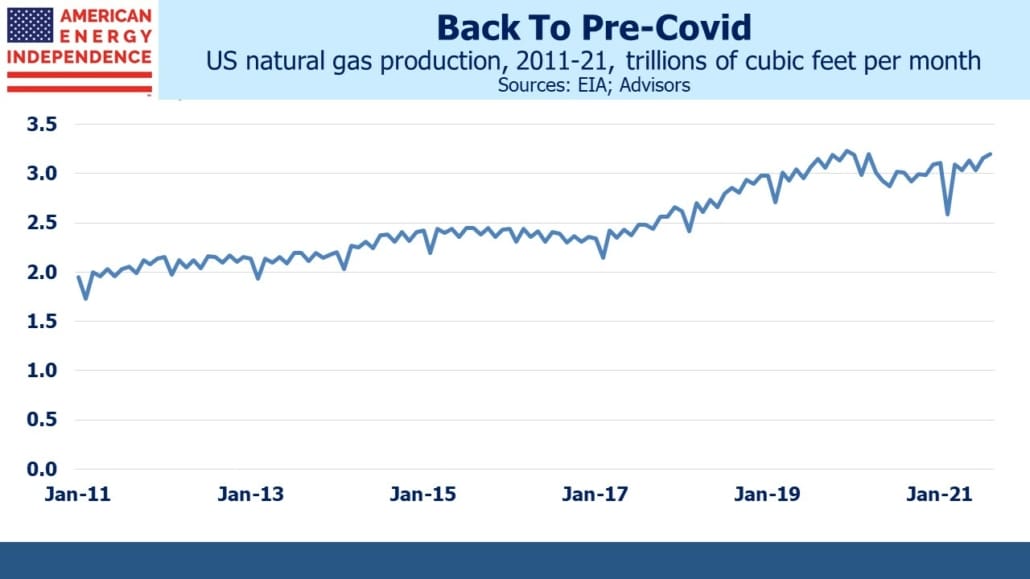
One of the most positive developments of the year for the pipeline sector has been the steady recovery in natural gas volumes. High crude prices have buoyed investor sentiment, but the return of domestic natural gas output to its pre-covid high represents a tangible benefit that has boosted earnings at companies such as Williams and Cheniere.
COP26 showed that emerging economies such as China and India continue to value raising living standards over reducing CO2 emissions. India’s per capita GDP is $1,900, compared with the US at $63K. Hundreds of millions of Indians live in poverty. Fighting global warming isn’t resonating with them or their government. The US can help by encouraging India and other countries to buy more natural gas and use less coal. That’s the pragmatic solution, and America is well positioned for it.
We have three funds that seek to profit from this environment:
Please see important Legal Disclosures.


