Bond Yields Reach Another Milestone
Recently, an important threshold was breached in terms of relative valuation between stocks and bonds. The yield on ten year U.S. treasuries drifted below the dividend yield on the S&P 500. It’s happened a couple of times in recent years but only because of a flight to quality and never for very long. This time looks different.
It’s worth examining this relationship over a very long period of time. The chart below goes back to 1871 and reminds us that for decades stock dividends were regarded as risky and uncertain. Little attention was paid to the possibility of dividend growth, and investors clearly placed greater value on the security of coupon payments from bonds.
This spread began to reverse in the late 1950s and since then, during the careers of a substantial percentage of today’s investors, bond yields have remained the higher of the two. Dividend growth (defined as the trailing five year annualized growth rate) was more variable prior to the 1950s with several periods when it was negative, so it’s understandable that investors of the day regarded dividends as quite uncertain. However, since the S&P500 dividend yield dipped below treasury yields, dividend growth has never been negative. The five year annualized growth rate since 1960 is 5.8%. Assessing a long term return target for equities is inevitably a combination of art and science, but adding a 5% growth rate to today’s 2% dividend yield suggests 7% is a defensible assumed return.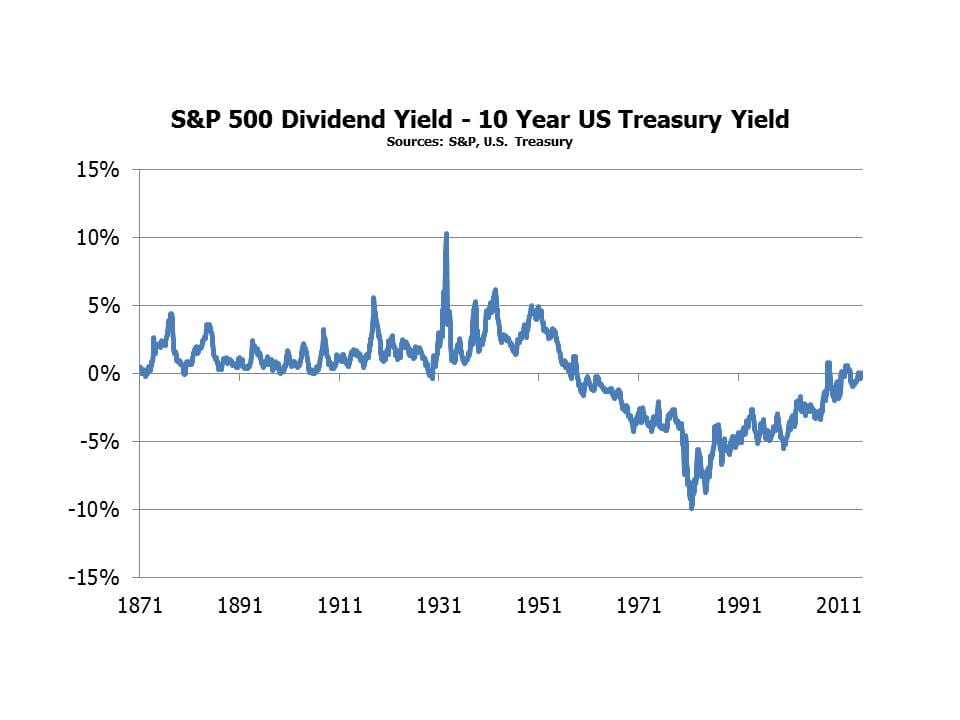
The trend of bond yields to decline towards dividend yields began a long time ago – back in 1981 when interest rates and inflation were peaking. It’s taken over 30 years, but the relationship is now back where it was during the Korean War. The investment outlook is, as always, uncertain with multiple areas of concern. However, the Federal Open Market Committee has made it abundantly clear that rates will rise slowly; recent earnings reports from Coke (KO), Dow Chemical (DOW), Microsoft (MSFT) and Amazon (AMZN) have all been good. These and many other stocks are near 52-week highs and in some cases all-time highs. FactSet projects earnings and dividends to grow mid to high single digits over the next year. These considerations are once again highlighting the inadequacy of fixed return securities as a source of after-tax real returns, and with one major asset class devoid of any value investors are again turning to stocks. The tumultuous markets of late August and September are receding; rather than portending a coming economic collapse, they simply represent additional evidence that far too much capital employs leverage.

The long term trend suggests that treasury yields will remain below dividend yields for the foreseeable future. We’re not forecasting such, simply noting that a 2% yield that is likely to grow on a diversified portfolio of stocks looks a whole lot more attractive than a 2% yield that’s fixed. It didn’t look so smart in recent weeks, but if you don’t use leverage and restrict yourself to companies with strong balance sheets you can watch such shenanigans from the sidelines.
Master Limited Partnerships (MLPs) have begun reporting earnings. Kinder Morgan (KMI) disappointed investors by trimming their 2016 dividend growth from 10% to 6-10%. KMI isn’t technically an MLP any more since they reorganized into a C-corp last year. However, they are squarely in the energy infrastructure business like midstream MLPs. Rather than issue equity to fund their growth projects, they plan to access an alternate, not yet disclosed source of capital through the middle of next year. Their free cashflow covers their distribution, and they access the capital markets to finance growth.
MLPs have had a torrid year, with the sector down far more (in our view) than lower crude oil would justify. As Rich Kinder said, “…we are insulated from the direct and indirect impacts of very low commodity environment, but we are not immune.” KMI owns pipelines and terminals; 54% of their cashflows come from natural gas pipelines; 11% come from a CO2 business that supports oil production; they transport about a third of the natural gas consumed in the U.S. 96% of their cashflows are fee-based or hedged: “insulated…but not immune”.
Selling energy infrastructure stocks is fashionable, and owning them is not. While bond yields are dipping below the S&P’s 2% dividend yield, KMI yields more than three times as much (7.25% on its 2016 dividend assuming the low end of the 6-10% growth range) and its dividend will grow at least as fast. Owning such securities will once more be fashionable.
We are invested in KO, DOW and KMI.

Important Disclosures
The information provided is for informational purposes only and investors should determine for themselves whether a particular service, security or product is suitable for their investment needs. The information contained herein is not complete, may not be current, is subject to change, and is subject to, and qualified in its entirety by, the more complete disclosures, risk factors and other terms that are contained in the disclosure, prospectus, and offering. Certain information herein has been obtained from third party sources and, although believed to be reliable, has not been independently verified and its accuracy or completeness cannot be guaranteed. No representation is made with respect to the accuracy, completeness or timeliness of this information. Nothing provided on this site constitutes tax advice. Individuals should seek the advice of their own tax advisor for specific information regarding tax consequences of investments. Investments in securities entail risk and are not suitable for all investors. This site is not a recommendation nor an offer to sell (or solicitation of an offer to buy) securities in the United States or in any other jurisdiction.
References to indexes and benchmarks are hypothetical illustrations of aggregate returns and do not reflect the performance of any actual investment. Investors cannot invest in an index and do not reflect the deduction of the advisor’s fees or other trading expenses. There can be no assurance that current investments will be profitable. Actual realized returns will depend on, among other factors, the value of assets and market conditions at the time of disposition, any related transaction costs, and the timing of the purchase. Indexes and benchmarks may not directly correlate or only partially relate to portfolios managed by SL Advisors as they have different underlying investments and may use different strategies or have different objectives than portfolios managed by SL Advisors (e.g. The Alerian index is a group MLP securities in the oil and gas industries. Portfolios may not include the same investments that are included in the Alerian Index. The S & P Index does not directly relate to investment strategies managed by SL Advisers.)
This site may contain forward-looking statements relating to the objectives, opportunities, and the future performance of the U.S. market generally. Forward-looking statements may be identified by the use of such words as; “believe,” “expect,” “anticipate,” “should,” “planned,” “estimated,” “potential” and other similar terms. Examples of forward-looking statements include, but are not limited to, estimates with respect to financial condition, results of operations, and success or lack of success of any particular investment strategy. All are subject to various factors, including, but not limited to general and local economic conditions, changing levels of competition within certain industries and markets, changes in interest rates, changes in legislation or regulation, and other economic, competitive, governmental, regulatory and technological factors affecting a portfolio’s operations that could cause actual results to differ materially from projected results. Such statements are forward-looking in nature and involves a number of known and unknown risks, uncertainties and other factors, and accordingly, actual results may differ materially from those reflected or contemplated in such forward-looking statements. Prospective investors are cautioned not to place undue reliance on any forward-looking statements or examples. None of SL Advisors LLC or any of its affiliates or principals nor any other individual or entity assumes any obligation to update any forward-looking statements as a result of new information, subsequent events or any other circumstances. All statements made herein speak only as of the date that they were made. r
Certain hyperlinks or referenced websites on the Site, if any, are for your convenience and forward you to third parties’ websites, which generally are recognized by their top level domain name. Any descriptions of, references to, or links to other products, publications or services does not constitute an endorsement, authorization, sponsorship by or affiliation with SL Advisors LLC with respect to any linked site or its sponsor, unless expressly stated by SL Advisors LLC. Any such information, products or sites have not necessarily been reviewed by SL Advisors LLC and are provided or maintained by third parties over whom SL Advisors LLC exercise no control. SL Advisors LLC expressly disclaim any responsibility for the content, the accuracy of the information, and/or quality of products or services provided by or advertised on these third-party sites.
All investment strategies have the potential for profit or loss. Different types of investments involve varying degrees of risk, and there can be no assurance that any specific investment will be suitable or profitable for a client’s investment portfolio.
Past performance of the American Energy Independence Index is not indicative of future returns.
Leave a Reply
Want to join the discussion?Feel free to contribute!