Is Natural Gas Turning?

/
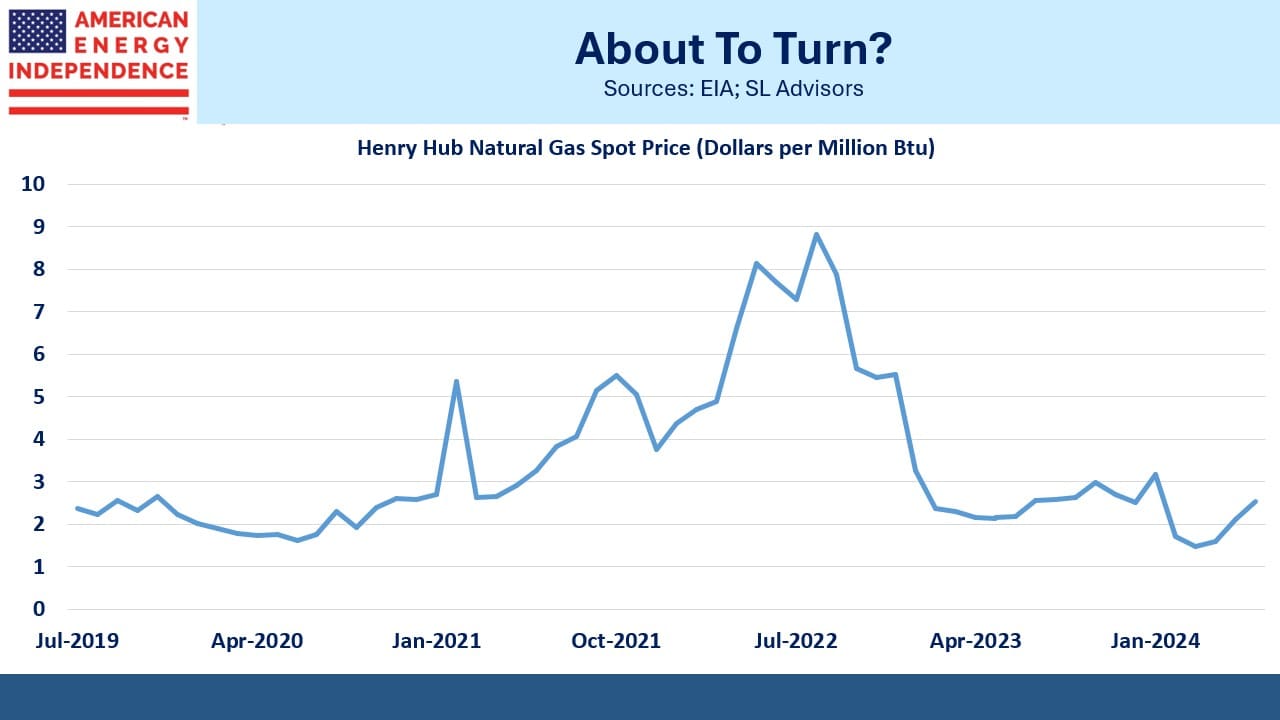
US natural gas is the cheapest in the world. December TTF futures on the European benchmark are $13 per Million BTUs (MMBTUs). The Asian JKM benchmark is $12.50. The US Henry Hub December futures are at $3.15. Fracking has become ever more efficient, allowing production to continue even at prices that seem ruinous.
Range Resources (RRC), a natural gas producer in the Marcellus and Utica shales in Pennsylvania, is expected to generate net income of over $400MM this year on a realized sale price of $2.60 for its natural gas. JPMorgan forecasts $750MM next year at $3.30. A few years ago such low prices would have been thought unsustainably low.
Cheap natural gas has been a huge boon for America. It underpins our cheap electricity, although increasing reliance on solar and wind is offsetting (see Renewables Are Pushing US Electricity Prices Up). Gas-fired power generation recently hit a new record (see Cash Returns Drive Performance).
Gas remains our biggest source of electricity, and by displacing coal plants has been the most important contributor to falling US CO2 emissions. Cheap, reliable energy has attracted foreign investment, creating jobs while western Europe cuts emissions by de-industrializing.
Horizontal drilling and hydraulic fracturing (“Fracking”) unlocked enormous supplies of US oil and natural gas. Kamala Harris used to be against fracking, but like Joe Biden did before, has now changed her position given the importance of swing state Pennsylvania in November.
How long can gas stay this cheap? Investors Leigh Goehring and Adam Rozencwajg think the turn in prices is near. Their reasons begin with declining growth in production, coinciding with some large fields having produced half of their recoverable reserves. They think the Energy Information Administration’s (EIA) production forecast of 105 Billion Cubic Feet per Day (BCF/D) next year is too optimistic.
The demand side starts with Liquefied Natural Gas (LNG). The price gap between US and foreign markets is easily sufficient to support LNG exports – currently running at 12-13 Billion Cubic Feet per Day but soon to rise as new export terminals become operational. They see an additional 5 BCF/D within three years. Other forecasts expect a doubling by 2030.
AI data centers’ need for power will rely substantially on natural gas. This isn’t just because it’s reliable, not dependent on sunny weather. Electricity from solar and wind includes more harmonic distortions which can be unsuitable for the sensitive hardware use by AI models. There are technologies to reduce such distortions but they add cost.
Power demand is already increasing. The Southern Company, which supplies electricity to Virginia, reported that demand from existing data centers was up 17% in 2Q24 compared with a year earlier.
Natural gas bulls have endured plenty of false starts in recent years, other than the spike that followed Russia’s invasion of Ukraine two years ago. But circumstances may finally be aligning to push prices higher. It looks like an appealing bet.
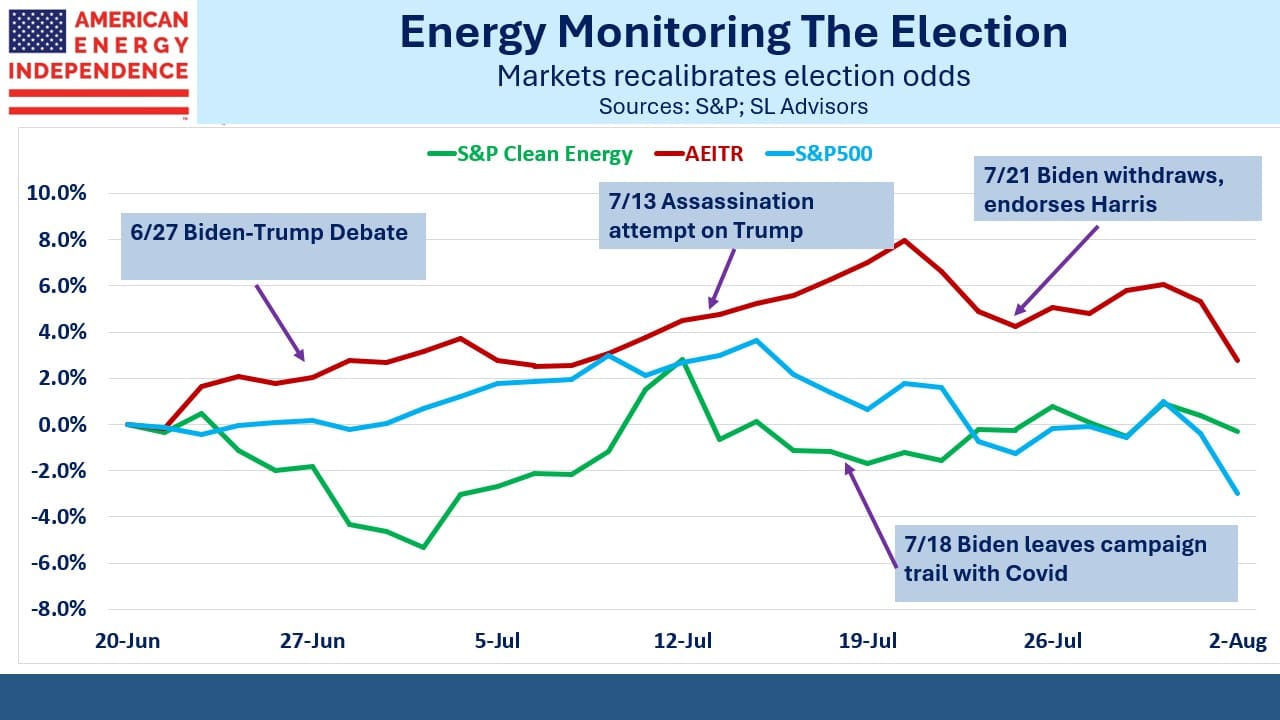
Complicating this outlook is the narrowing polling gap between Trump and Harris. Betting markets still favor Trump although his lead has halved. Energy markets have been attuned to the fluctuating outlook, with the S&P Global Clean Energy index a useful barometer for the odds of a Trump victory.
The spread in relative performance between the American Energy Independence Index (AEITR), or traditional energy, versus renewables, peaked just before Biden withdrew from the race. Since then it’s narrowed – it’s either the Harris Honeymoon or relief that it’s no longer a duel between two old men, depending on your perspective.
Kamala Harris is left of Biden – chosen in part to secure the votes of progressives four years ago. So she’s not obviously good for energy investors. But as with Biden, the actual effect could be nuanced. Left wing energy policies tend to focus on constraining energy supply rather than demand, with the hope that renewables will benefit. It discourages new capex as we’ve seen under Biden (hug a climate protester).
Republican policies favor deregulation, making it easier to produce oil and gas.
One way to think of it is that Republicans are good for domestic output while Democrats are good for prices. Crude oil is a global market and forecasting how a President Trump might affect prices means assessing policy choices towards Iran and Russia.
But natural gas exists as regional markets, so US prices will be driven by domestic considerations. Restricting supply will be hard, but limiting demand will be harder. Owning natural gas producers, such as RRC, may be a hedge on a Harris election win. If it happens, energy investors may feel they’ll need something to cheer them up.
We have three have funds that seek to profit from this environment:

Important Disclosures
The information provided is for informational purposes only and investors should determine for themselves whether a particular service, security or product is suitable for their investment needs. The information contained herein is not complete, may not be current, is subject to change, and is subject to, and qualified in its entirety by, the more complete disclosures, risk factors and other terms that are contained in the disclosure, prospectus, and offering. Certain information herein has been obtained from third party sources and, although believed to be reliable, has not been independently verified and its accuracy or completeness cannot be guaranteed. No representation is made with respect to the accuracy, completeness or timeliness of this information. Nothing provided on this site constitutes tax advice. Individuals should seek the advice of their own tax advisor for specific information regarding tax consequences of investments. Investments in securities entail risk and are not suitable for all investors. This site is not a recommendation nor an offer to sell (or solicitation of an offer to buy) securities in the United States or in any other jurisdiction.
References to indexes and benchmarks are hypothetical illustrations of aggregate returns and do not reflect the performance of any actual investment. Investors cannot invest in an index and do not reflect the deduction of the advisor’s fees or other trading expenses. There can be no assurance that current investments will be profitable. Actual realized returns will depend on, among other factors, the value of assets and market conditions at the time of disposition, any related transaction costs, and the timing of the purchase. Indexes and benchmarks may not directly correlate or only partially relate to portfolios managed by SL Advisors as they have different underlying investments and may use different strategies or have different objectives than portfolios managed by SL Advisors (e.g. The Alerian index is a group MLP securities in the oil and gas industries. Portfolios may not include the same investments that are included in the Alerian Index. The S & P Index does not directly relate to investment strategies managed by SL Advisers.)
This site may contain forward-looking statements relating to the objectives, opportunities, and the future performance of the U.S. market generally. Forward-looking statements may be identified by the use of such words as; “believe,” “expect,” “anticipate,” “should,” “planned,” “estimated,” “potential” and other similar terms. Examples of forward-looking statements include, but are not limited to, estimates with respect to financial condition, results of operations, and success or lack of success of any particular investment strategy. All are subject to various factors, including, but not limited to general and local economic conditions, changing levels of competition within certain industries and markets, changes in interest rates, changes in legislation or regulation, and other economic, competitive, governmental, regulatory and technological factors affecting a portfolio’s operations that could cause actual results to differ materially from projected results. Such statements are forward-looking in nature and involves a number of known and unknown risks, uncertainties and other factors, and accordingly, actual results may differ materially from those reflected or contemplated in such forward-looking statements. Prospective investors are cautioned not to place undue reliance on any forward-looking statements or examples. None of SL Advisors LLC or any of its affiliates or principals nor any other individual or entity assumes any obligation to update any forward-looking statements as a result of new information, subsequent events or any other circumstances. All statements made herein speak only as of the date that they were made. r
Certain hyperlinks or referenced websites on the Site, if any, are for your convenience and forward you to third parties’ websites, which generally are recognized by their top level domain name. Any descriptions of, references to, or links to other products, publications or services does not constitute an endorsement, authorization, sponsorship by or affiliation with SL Advisors LLC with respect to any linked site or its sponsor, unless expressly stated by SL Advisors LLC. Any such information, products or sites have not necessarily been reviewed by SL Advisors LLC and are provided or maintained by third parties over whom SL Advisors LLC exercise no control. SL Advisors LLC expressly disclaim any responsibility for the content, the accuracy of the information, and/or quality of products or services provided by or advertised on these third-party sites.
All investment strategies have the potential for profit or loss. Different types of investments involve varying degrees of risk, and there can be no assurance that any specific investment will be suitable or profitable for a client’s investment portfolio.
Past performance of the American Energy Independence Index is not indicative of future returns.


Harris has already revised her position about being in favor of a fracking ban. Even if she hadn’t however, that posture was no more threatening or realistic than Biden’s famous pre-2020 election promise to get rid of fossil fuels entirely.