The Smart Money In Pipelines
With pipeline stocks having their worst month since the depths of Covid-panic selling in March, investors are wondering when the smart money will finally respond to today’s extreme undervaluation and commit capital. Recent price action makes little sense, something that becomes very apparent in discussions with clients. 2Q20 earnings were as expected, and dividends unchanged. The yield on the American Energy Independence Index, the most representative index of North American midstream energy infrastructure, is now over 10%.
Two items stand out as the most compelling bullish arguments. The first is that the yield on Free Cash Flow (FCF, the cash flow available after ALL capex spending) is approaching 13% for 2021. We had previously been targeting $30BN for next year, (see Pipeline Earnings Should Confirm Growing Cash Flows), but following second quarter earnings have revised this higher, to $40BN. We don’t know of another sector of the market delivering such a high FCF yield. The broader market’s FCF yield is around 4% and the utility sector, the one most similar to pipelines, has a negative yield.
The jump in FCF is driven by continued falling growth capex, which peaked in 2018. Pipeline companies are reinvesting less in the business, leaving more for buybacks, deleveraging and distribution increases. Pipeline companies are still investing in growth though, spending on average 6% of their market caps on growth capex. A sustainable cash flow yield assuming no new projects approaches 20%.
The second bullish item lies in the gulf between perceptions of bond and equity investors in the same company. Enterprise Products Partners (EPD) has 30 year bonds outstanding that yield 3%, less than a third of the distribution yield on their common units (see 4th chart in Stocks Are Still A Better Bet Than Bonds). Energy Transfer issued 10 year debt early last year, which trades above par following a sharp dip in March. Meanwhile, its common units have sunk to less than half the price at which they traded when the debt was issued (see The Divergent Views About Energy Transfer). While the dour view of equity markets towards the energy sector has driven prices down to where payouts yield 10% or more, long term bond investors see little to concern them. Conventional wisdom holds that bond investors are usually right, because they do more detailed analysis. But that is little comfort for today’s pipeline investors.
Berkshire Hathaway’s $10BN purchase of Dominion Energy’s natural gas pipeline network last month was welcomed by some investors as confirmation of the inherent value in the sector. The natural gas outlook offers more clarity than for crude oil. Covid dramatically altered travel. Gasoline consumption in the U.S. has recovered to within 10% of year-ago levels, but it’s widely believed that office work will never be the same. Increased remote working, less use of public transport, and migration to the suburbs complicate long term forecasts.
By contrast, since natural gas has minimal use in transportation, it is shielded from this uncertainty. Domestic consumption is down slightly from a year ago, but exports are rising and growing demand from developing countries is forecast in the years ahead. Moreover, continued phasing out of coal plants and increased use of renewables are likely to require more natural gas, both here and abroad.
Although California aims to rely on solar and wind for almost all their electricity, recent power outages and high prices make this a strategy few will care to follow. It’s unlikely intermittent renewables can maintain their growth without further reliance on always-there natural gas power plants.
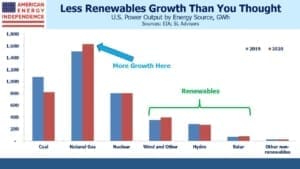
For the twelve months ending in June, natural gas generated 1.6 Terawatt Hours (TW) of electricity. This was an increase of 124 Gigawatt Hours (GWh), or 8%, compared with the same period a year ago. To put this in perspective, total solar power generation over the past year was 81 GWh. On a percentage basis, renewables show high growth, but in absolute numbers natural gas growth dominates. Solar and wind growth combined was 58 GWh, less than half the growth in natural gas. As we switch off coal burning power plants, they are more often replaced with natural gas.
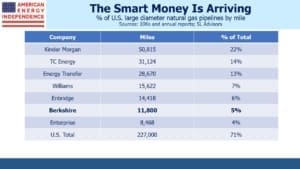
Meanwhile, Berkshire Hathaway has quietly become the sixth biggest operator of natural gas pipelines in America. Buffett presumably sees many years of predictable cashflows from these assets, offered at a cheap price. The smart money is here.
We are invested in all the components of the American Energy Independence Index via the ETF that seeks to track its performance
Important Disclosures
The information provided is for informational purposes only and investors should determine for themselves whether a particular service, security or product is suitable for their investment needs. The information contained herein is not complete, may not be current, is subject to change, and is subject to, and qualified in its entirety by, the more complete disclosures, risk factors and other terms that are contained in the disclosure, prospectus, and offering. Certain information herein has been obtained from third party sources and, although believed to be reliable, has not been independently verified and its accuracy or completeness cannot be guaranteed. No representation is made with respect to the accuracy, completeness or timeliness of this information. Nothing provided on this site constitutes tax advice. Individuals should seek the advice of their own tax advisor for specific information regarding tax consequences of investments. Investments in securities entail risk and are not suitable for all investors. This site is not a recommendation nor an offer to sell (or solicitation of an offer to buy) securities in the United States or in any other jurisdiction.
References to indexes and benchmarks are hypothetical illustrations of aggregate returns and do not reflect the performance of any actual investment. Investors cannot invest in an index and do not reflect the deduction of the advisor’s fees or other trading expenses. There can be no assurance that current investments will be profitable. Actual realized returns will depend on, among other factors, the value of assets and market conditions at the time of disposition, any related transaction costs, and the timing of the purchase. Indexes and benchmarks may not directly correlate or only partially relate to portfolios managed by SL Advisors as they have different underlying investments and may use different strategies or have different objectives than portfolios managed by SL Advisors (e.g. The Alerian index is a group MLP securities in the oil and gas industries. Portfolios may not include the same investments that are included in the Alerian Index. The S & P Index does not directly relate to investment strategies managed by SL Advisers.)
This site may contain forward-looking statements relating to the objectives, opportunities, and the future performance of the U.S. market generally. Forward-looking statements may be identified by the use of such words as; “believe,” “expect,” “anticipate,” “should,” “planned,” “estimated,” “potential” and other similar terms. Examples of forward-looking statements include, but are not limited to, estimates with respect to financial condition, results of operations, and success or lack of success of any particular investment strategy. All are subject to various factors, including, but not limited to general and local economic conditions, changing levels of competition within certain industries and markets, changes in interest rates, changes in legislation or regulation, and other economic, competitive, governmental, regulatory and technological factors affecting a portfolio’s operations that could cause actual results to differ materially from projected results. Such statements are forward-looking in nature and involves a number of known and unknown risks, uncertainties and other factors, and accordingly, actual results may differ materially from those reflected or contemplated in such forward-looking statements. Prospective investors are cautioned not to place undue reliance on any forward-looking statements or examples. None of SL Advisors LLC or any of its affiliates or principals nor any other individual or entity assumes any obligation to update any forward-looking statements as a result of new information, subsequent events or any other circumstances. All statements made herein speak only as of the date that they were made. r
Certain hyperlinks or referenced websites on the Site, if any, are for your convenience and forward you to third parties’ websites, which generally are recognized by their top level domain name. Any descriptions of, references to, or links to other products, publications or services does not constitute an endorsement, authorization, sponsorship by or affiliation with SL Advisors LLC with respect to any linked site or its sponsor, unless expressly stated by SL Advisors LLC. Any such information, products or sites have not necessarily been reviewed by SL Advisors LLC and are provided or maintained by third parties over whom SL Advisors LLC exercise no control. SL Advisors LLC expressly disclaim any responsibility for the content, the accuracy of the information, and/or quality of products or services provided by or advertised on these third-party sites.
All investment strategies have the potential for profit or loss. Different types of investments involve varying degrees of risk, and there can be no assurance that any specific investment will be suitable or profitable for a client’s investment portfolio.
Past performance of the American Energy Independence Index is not indicative of future returns.


“The smart money is here.” Another encouraging sign has been the recent large investment increases in companies like EPD, ET and MPLX by the heavy-hitting private equity firm Blackstone. For example, BX recently picked up 54 million units of EPD to bring its total to almost 77 million units (value: more than $1.2 billion).
Source: https://www.nasdaq.com/market-activity/stocks/epd/institutional-holdings