The Smart Money In Pipelines
With pipeline stocks having their worst month since the depths of Covid-panic selling in March, investors are wondering when the smart money will finally respond to today’s extreme undervaluation and commit capital. Recent price action makes little sense, something that becomes very apparent in discussions with clients. 2Q20 earnings were as expected, and dividends unchanged. The yield on the American Energy Independence Index, the most representative index of North American midstream energy infrastructure, is now over 10%.
Two items stand out as the most compelling bullish arguments. The first is that the yield on Free Cash Flow (FCF, the cash flow available after ALL capex spending) is approaching 13% for 2021. We had previously been targeting $30BN for next year, (see Pipeline Earnings Should Confirm Growing Cash Flows), but following second quarter earnings have revised this higher, to $40BN. We don’t know of another sector of the market delivering such a high FCF yield. The broader market’s FCF yield is around 4% and the utility sector, the one most similar to pipelines, has a negative yield.
The jump in FCF is driven by continued falling growth capex, which peaked in 2018. Pipeline companies are reinvesting less in the business, leaving more for buybacks, deleveraging and distribution increases. Pipeline companies are still investing in growth though, spending on average 6% of their market caps on growth capex. A sustainable cash flow yield assuming no new projects approaches 20%.
The second bullish item lies in the gulf between perceptions of bond and equity investors in the same company. Enterprise Products Partners (EPD) has 30 year bonds outstanding that yield 3%, less than a third of the distribution yield on their common units (see 4th chart in Stocks Are Still A Better Bet Than Bonds). Energy Transfer issued 10 year debt early last year, which trades above par following a sharp dip in March. Meanwhile, its common units have sunk to less than half the price at which they traded when the debt was issued (see The Divergent Views About Energy Transfer). While the dour view of equity markets towards the energy sector has driven prices down to where payouts yield 10% or more, long term bond investors see little to concern them. Conventional wisdom holds that bond investors are usually right, because they do more detailed analysis. But that is little comfort for today’s pipeline investors.
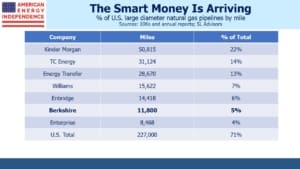
Berkshire Hathaway’s $10BN purchase of Dominion Energy’s natural gas pipeline network last month was welcomed by some investors as confirmation of the inherent value in the sector. The natural gas outlook offers more clarity than for crude oil. Covid dramatically altered travel. Gasoline consumption in the U.S. has recovered to within 10% of year-ago levels, but it’s widely believed that office work will never be the same. Increased remote working, less use of public transport, and migration to the suburbs complicate long term forecasts.
By contrast, since natural gas has minimal use in transportation, it is shielded from this uncertainty. Domestic consumption is down slightly from a year ago, but exports are rising and growing demand from developing countries is forecast in the years ahead. Moreover, continued phasing out of coal plants and increased use of renewables are likely to require more natural gas, both here and abroad.
Although California aims to rely on solar and wind for almost all their electricity, recent power outages and high prices make this a strategy few will care to follow. It’s unlikely intermittent renewables can maintain their growth without further reliance on always-there natural gas power plants.
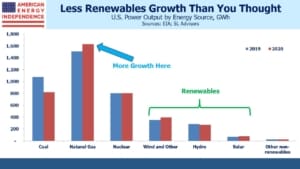
For the twelve months ending in June, natural gas generated 1.6 Terawatt Hours (TW) of electricity. This was an increase of 124 Gigawatt Hours (GWh), or 8%, compared with the same period a year ago. To put this in perspective, total solar power generation over the past year was 81 GWh. On a percentage basis, renewables show high growth, but in absolute numbers natural gas growth dominates. Solar and wind growth combined was 58 GWh, less than half the growth in natural gas. As we switch off coal burning power plants, they are more often replaced with natural gas.
Meanwhile, Berkshire Hathaway has quietly become the sixth biggest operator of natural gas pipelines in America. Buffett presumably sees many years of predictable cashflows from these assets, offered at a cheap price. The smart money is here.
We are invested in all the components of the American Energy Independence Index via the ETF that seeks to track its performance

