MLPs and Crude Oil, the Improbable Dance Partners
Talk about MLPs nowadays and pretty soon you’ll get to crude oil. Few will quickly forget the collapse in crude from 2014 that led to the collapse in MLPs. To be an MLP investor seemingly requires a view on the price of what moves through their infrastructure (although only 7% of pipelines in the U.S. carry oil; natural gas, natural gas liquids and refined products are more dominant).
Since pictures can be more eloquent, we’ve produced some visual insight to the long term relationship between the two. Going back to 1996 (the start of the Alerian Index) crude and MLPs have sometimes moved together and sometimes not. However, an investor who had the foresight to call oil’s sometimes violent but ultimately limp twenty year move from $19.50 a barrel to $43 today might have been dissuaded from buying MLPs. He would have missed a thirteen fold increase in value.
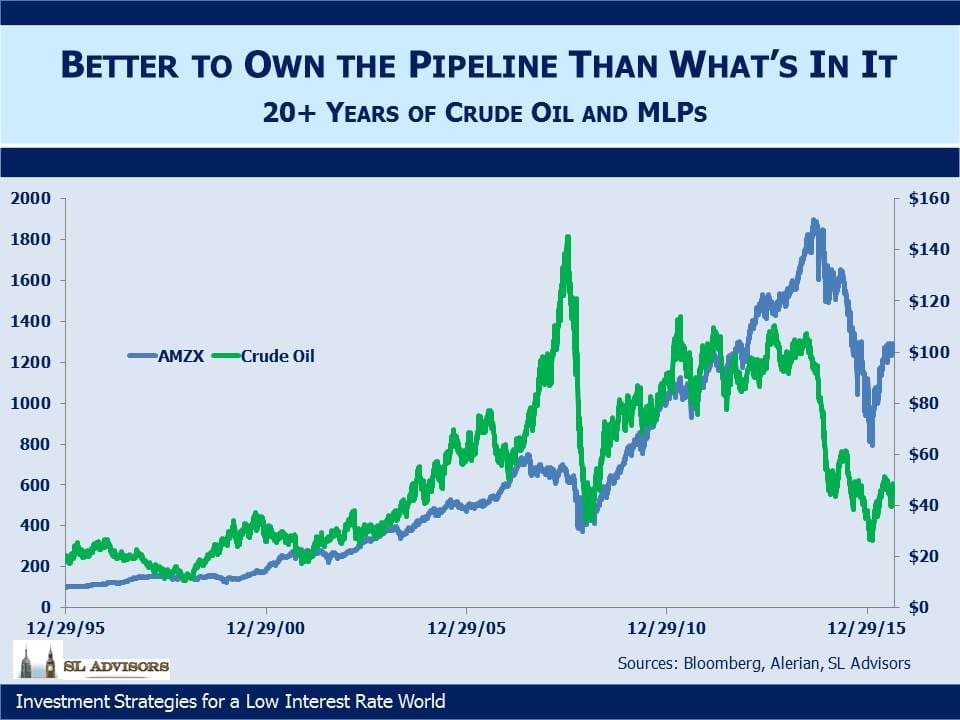
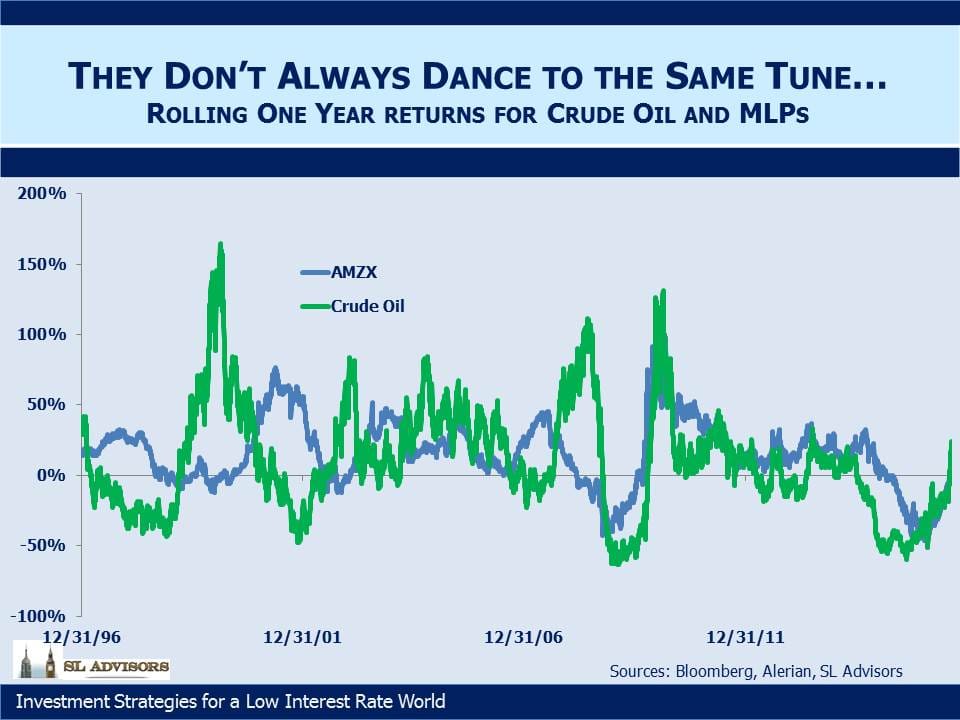
However, we’re not trying to forecast the level of one from the other but their respective returns (forgive me, their first derivatives). How will changes in crude oil affect returns to MLP investors? Both have moved up over twenty years, but not always together as the second chart shows.
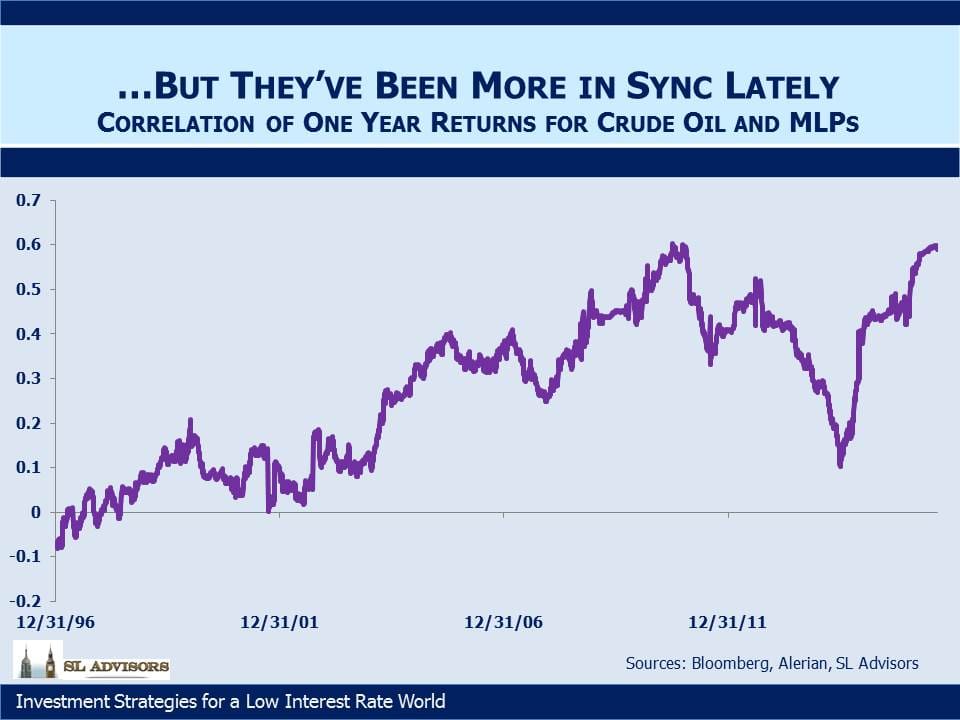
And the third chart confirms what we all knew anyway, which is that their returns have become more correlated. In fact, the past couple of years have seen a dramatic shift in the relationship. In June 2014 the correlation was 0.1, which is to say there was effectively no relationship at all. Since then it has tightened to levels last seen in the 2008 financial crisis, when everything apart from government debt was falling.
Having examined the past, what can we conclude going forward? First, correlations tend to mean-revert, and it’s not a big leap to suggest that MLPs and crude oil will decouple to some extent. The three month correlation of daily returns (not pictured here) is more sensitive than the 12 month correlation we’ve used, and it shows that the relationship has weakened in recent weeks.
Another point to note is that correlations across asset classes in general are moving up. Stocks and bonds have both been registering new highs. As MLPs have recovered from their February low they become more highly correlated with both asset classes (although at still 35% off their old August 2014 high a switch from almost anything into MLPs looks attractive). And in fact, MLPs have demonstrated a more meaningful relationship with stocks both recently and over twenty years. So the more pertinent question for the potential MLP investor is to ask where stocks are going, but perhaps that seems both obvious and unanswerable, so attention shifts back to crude.

We think the correlation will come down from current levels. But as U.S. hydrocarbon production increases our economy will gradually enjoy less of a consumption boost when crude oil falls. Traditionally, cheaper gasoline has been regarded as a tax cut, but many economists were surprised at the muted boost to consumption that we saw last year.
We also think the long term outlook for crude oil is positive. $1TN of cuts in drilling budgets through 2020 will make it hard to source new supply needed to offset roughly 5MMB/D of depletion and another 1.0—1.5MMB/D of new demand. We wrote about this recently in Why Oil Could Be Higher for Longer.
It’s perfectly natural for investors to mention crude oil and MLPs in the same breath. But we think the strong recent relationship will weaken, and industry fundamentals will dominate again.

Important Disclosures
The information provided is for informational purposes only and investors should determine for themselves whether a particular service, security or product is suitable for their investment needs. The information contained herein is not complete, may not be current, is subject to change, and is subject to, and qualified in its entirety by, the more complete disclosures, risk factors and other terms that are contained in the disclosure, prospectus, and offering. Certain information herein has been obtained from third party sources and, although believed to be reliable, has not been independently verified and its accuracy or completeness cannot be guaranteed. No representation is made with respect to the accuracy, completeness or timeliness of this information. Nothing provided on this site constitutes tax advice. Individuals should seek the advice of their own tax advisor for specific information regarding tax consequences of investments. Investments in securities entail risk and are not suitable for all investors. This site is not a recommendation nor an offer to sell (or solicitation of an offer to buy) securities in the United States or in any other jurisdiction.
References to indexes and benchmarks are hypothetical illustrations of aggregate returns and do not reflect the performance of any actual investment. Investors cannot invest in an index and do not reflect the deduction of the advisor’s fees or other trading expenses. There can be no assurance that current investments will be profitable. Actual realized returns will depend on, among other factors, the value of assets and market conditions at the time of disposition, any related transaction costs, and the timing of the purchase. Indexes and benchmarks may not directly correlate or only partially relate to portfolios managed by SL Advisors as they have different underlying investments and may use different strategies or have different objectives than portfolios managed by SL Advisors (e.g. The Alerian index is a group MLP securities in the oil and gas industries. Portfolios may not include the same investments that are included in the Alerian Index. The S & P Index does not directly relate to investment strategies managed by SL Advisers.)
This site may contain forward-looking statements relating to the objectives, opportunities, and the future performance of the U.S. market generally. Forward-looking statements may be identified by the use of such words as; “believe,” “expect,” “anticipate,” “should,” “planned,” “estimated,” “potential” and other similar terms. Examples of forward-looking statements include, but are not limited to, estimates with respect to financial condition, results of operations, and success or lack of success of any particular investment strategy. All are subject to various factors, including, but not limited to general and local economic conditions, changing levels of competition within certain industries and markets, changes in interest rates, changes in legislation or regulation, and other economic, competitive, governmental, regulatory and technological factors affecting a portfolio’s operations that could cause actual results to differ materially from projected results. Such statements are forward-looking in nature and involves a number of known and unknown risks, uncertainties and other factors, and accordingly, actual results may differ materially from those reflected or contemplated in such forward-looking statements. Prospective investors are cautioned not to place undue reliance on any forward-looking statements or examples. None of SL Advisors LLC or any of its affiliates or principals nor any other individual or entity assumes any obligation to update any forward-looking statements as a result of new information, subsequent events or any other circumstances. All statements made herein speak only as of the date that they were made. r
Certain hyperlinks or referenced websites on the Site, if any, are for your convenience and forward you to third parties’ websites, which generally are recognized by their top level domain name. Any descriptions of, references to, or links to other products, publications or services does not constitute an endorsement, authorization, sponsorship by or affiliation with SL Advisors LLC with respect to any linked site or its sponsor, unless expressly stated by SL Advisors LLC. Any such information, products or sites have not necessarily been reviewed by SL Advisors LLC and are provided or maintained by third parties over whom SL Advisors LLC exercise no control. SL Advisors LLC expressly disclaim any responsibility for the content, the accuracy of the information, and/or quality of products or services provided by or advertised on these third-party sites.
All investment strategies have the potential for profit or loss. Different types of investments involve varying degrees of risk, and there can be no assurance that any specific investment will be suitable or profitable for a client’s investment portfolio.
Past performance of the American Energy Independence Index is not indicative of future returns.
Leave a Reply
Want to join the discussion?Feel free to contribute!