U.S. Plays Its Foreign Policy Hand Freed From Oil
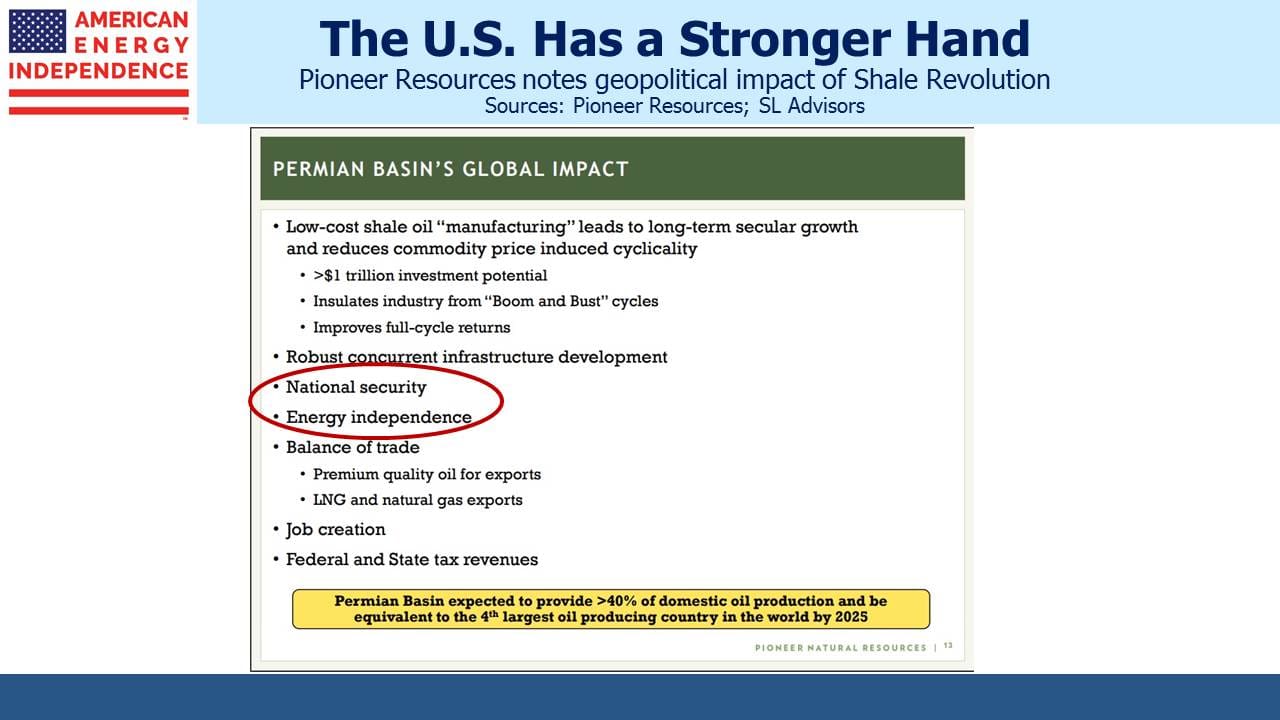
Reports on the Shale Revolution rarely discuss its impact on U.S. energy security, but with little fanfare it’s affording the U.S. greater geopolitical flexibility. The Administration’s decision last week to withdraw from the Iran nuclear deal was made without significant regard to the ensuing reduction in Iranian oil exports. Successive U.S. presidents back to Richard Nixon have called for U.S. energy independence without being able to achieve it. The U.S. is already energy independent on a BTU-equivalent basis (i.e. we produce more energy than we consume in aggregate). We became natural gas independent last year as Liquefied Natural Gas (LNG) exports ramped up. We’ve been a net exporter of ethane since 2014, and of propane since 2011.
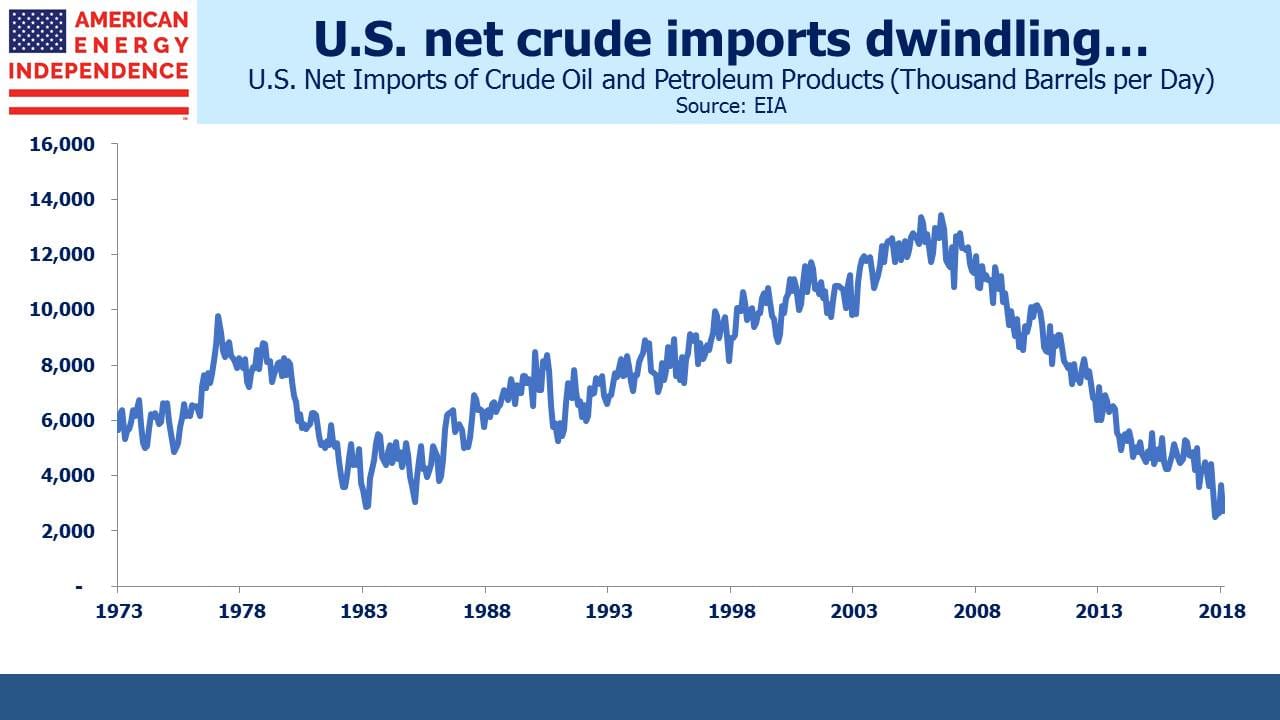
But when a President calls for energy independence – or even energy dominance – he means crude oil. Here, the story is almost as good. In August 2006, net imports of crude oil and petroleum products hit 13.4 Million Barrels per Day (MMB/D). Today that figure is below 3 MMB/D. Even when the U.S. does become a net exporter we’ll still be importing the sour, heavy crude favored by domestic refineries while exporting the lighter grades that are increasingly produced from shale.
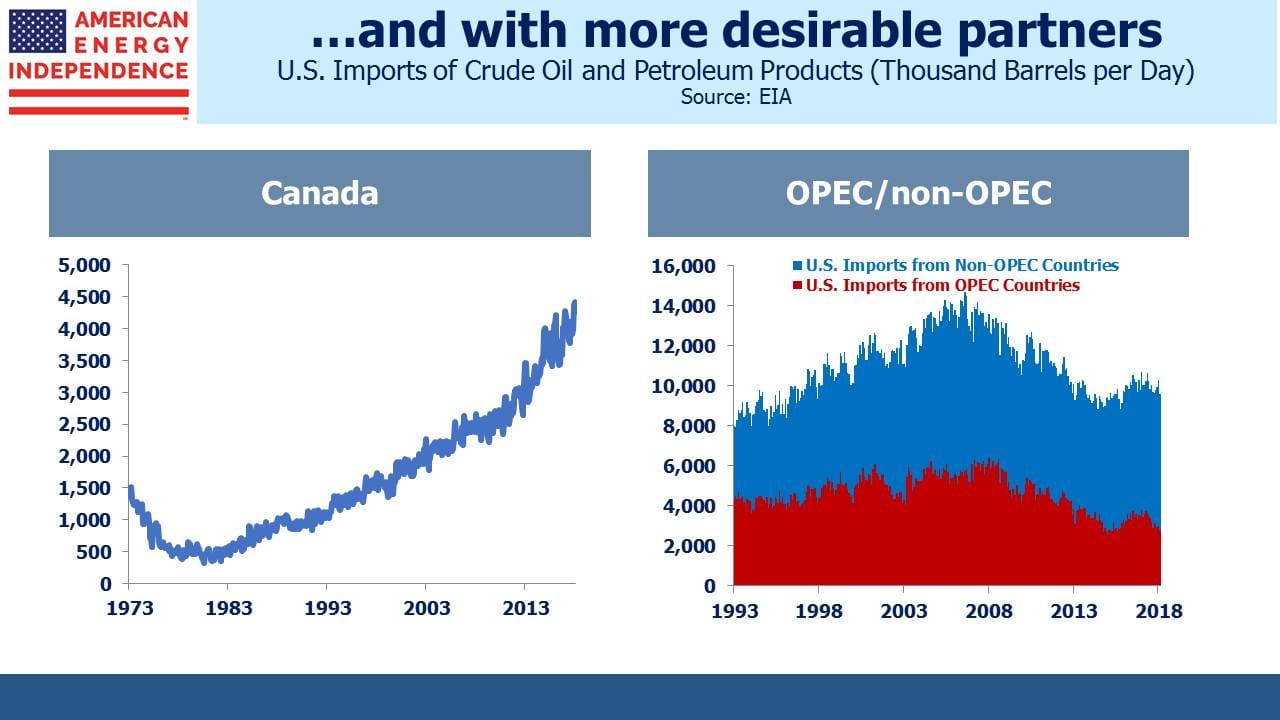
Furthermore, our imports are increasingly from friendly countries. Canadian exports to the U.S. have been rising for years and are currently 4.3MMB/D, while OPEC imports have dropped by 50% in the past decade, to below 3 MMB/D. U.S. imports from Iran ceased entirely during the 1980 hostage crisis and have never recovered. In fact, total trade in goods between the U.S. and Iran was an inconsequential $200MM last year. While Iran is of no economic value to the U.S., the likely imposition of sanctions will constrain Iran’s exports to other countries. The recent rally in crude is in part attributed to fears of less Iranian crude on the global market – they currently produce 3.8MMB/D.
But the U.S. is far less vulnerable to a price spike than in the past. Oil-producing states such as Texas, North Dakota, New Mexico and Oklahoma will welcome the economic boost. Treasury secretary Steve Mnuchin was reported to have discussed with U.S. oil companies ways in which they could raise output, but any decisions are likely to be commercially driven. The Federal government was of little help to the industry during the 2014-16 oil price collapse, and has limited near term ability to influence production levels.
U.S. crude output is responding. Rising prices and falling break-evens are improving profitability, driving output to 10.7MMB/D. Just a year ago, the U.S. Energy Information Agency (EIA) was forecasting 2018 output of 9.9MMB/D, likely 1 MMB/D too low. They now expect 2019 to average 11.9MMB/D. Although growing strongly, U.S. output is insufficient to meet new global demand (~1.5MMB/D) plus offset depletion of existing oil fields (estimated 3-4 MMB/D). OPEC is showing surprising discipline in sticking to their supply agreement. Iran’s exports will likely drop and Venezuela’s production is in freefall. It’s not hard to make a bullish case for oil, and for U.S. companies involved in its production and transportation.
Infrastructure constraints are appearing (see Dwindling Pipeline Capacity Causes FOMO), most visibly in the Midland-Houston crude spread which recently exceeded $15. Wellhead prices can suffer an additional discount of up to $8/bbl to adjust for trucking and shuttle pipeline transportation costs to Midland. Differentials are far in excess of the cost of pipeline transport, because pipelines leaving the Permian in west Texas are full. There are reports that the rail network is clogged with trainloads of fracking sand entering the region, while trucks and truckers are in short supply. Although the logistical challenges offer profit opportunities for the owners of energy infrastructure, in the near term crude output growth may be constrained.
It’s even more acute for Permian natural gas production, which is an associated by-product of crude oil output. On Energy Transfer’s earnings call COO Marshall McCrea predicted occasional days of no bid for natural gas at the Waha hub, a collection point for Permian gas. That’ll leave drillers contemplating flaring of natural gas or shutting in otherwise profitable wells while the infrastructure catches up.
In March, before today’s pipeline constraints had affected price differentials, Magellan Midstream Partners (MMP) dropped plans to add a pipeline that would have moved 350,000 Barrels per Day of crude across Texas, because not enough producers would guarantee to use it. Pioneer Natural Resources (PXD) CEO Scott Sheffield warned the industry, ““Oil has a problem late this year and also in 2020.” He added, “It will teach these producers a lesson that they better sign up.”
In other words, insufficient pipeline capacity is in part down to the earlier reluctance of producers to commit, which discouraged the development of infrastructure that would have been in use today. Smaller firms, often privately owned, are more vulnerable than large ones. PXD has firm transportation contracts in place for their increasing production of oil and gas, a point they highlighted in their recent earnings presentation.
One analyst at Rystad Energy blamed energy infrastructure companies for the bottlenecks, saying they had, “…really missed their opportunity when there was a need for investment in new capacity.” In fact, the multi-year travails of MLPs can be traced to the relentless pursuit of growth projects by management teams at the expense of stable distributions (see Will MLP Distributions Pay Off?). When capital was available and customer commitments forthcoming, new infrastructure was built. Oil producers have surprised many, including themselves, at the volume growth efficiencies have made possible. PXD reports Permian breakevens for producers at under $30 per barrel, and in their 1Q18 earnings report show their own costs at around $19 per barrel.
Thanks to the Shale Revolution, U.S. geopolitical decisions are benefiting from more strategic flexibility than in the past.
We are invested in Energy Transfer Equity (ETE), General Partner of ETP, and MMP
Important Disclosures
The information provided is for informational purposes only and investors should determine for themselves whether a particular service, security or product is suitable for their investment needs. The information contained herein is not complete, may not be current, is subject to change, and is subject to, and qualified in its entirety by, the more complete disclosures, risk factors and other terms that are contained in the disclosure, prospectus, and offering. Certain information herein has been obtained from third party sources and, although believed to be reliable, has not been independently verified and its accuracy or completeness cannot be guaranteed. No representation is made with respect to the accuracy, completeness or timeliness of this information. Nothing provided on this site constitutes tax advice. Individuals should seek the advice of their own tax advisor for specific information regarding tax consequences of investments. Investments in securities entail risk and are not suitable for all investors. This site is not a recommendation nor an offer to sell (or solicitation of an offer to buy) securities in the United States or in any other jurisdiction.
References to indexes and benchmarks are hypothetical illustrations of aggregate returns and do not reflect the performance of any actual investment. Investors cannot invest in an index and do not reflect the deduction of the advisor’s fees or other trading expenses. There can be no assurance that current investments will be profitable. Actual realized returns will depend on, among other factors, the value of assets and market conditions at the time of disposition, any related transaction costs, and the timing of the purchase. Indexes and benchmarks may not directly correlate or only partially relate to portfolios managed by SL Advisors as they have different underlying investments and may use different strategies or have different objectives than portfolios managed by SL Advisors (e.g. The Alerian index is a group MLP securities in the oil and gas industries. Portfolios may not include the same investments that are included in the Alerian Index. The S & P Index does not directly relate to investment strategies managed by SL Advisers.)
This site may contain forward-looking statements relating to the objectives, opportunities, and the future performance of the U.S. market generally. Forward-looking statements may be identified by the use of such words as; “believe,” “expect,” “anticipate,” “should,” “planned,” “estimated,” “potential” and other similar terms. Examples of forward-looking statements include, but are not limited to, estimates with respect to financial condition, results of operations, and success or lack of success of any particular investment strategy. All are subject to various factors, including, but not limited to general and local economic conditions, changing levels of competition within certain industries and markets, changes in interest rates, changes in legislation or regulation, and other economic, competitive, governmental, regulatory and technological factors affecting a portfolio’s operations that could cause actual results to differ materially from projected results. Such statements are forward-looking in nature and involves a number of known and unknown risks, uncertainties and other factors, and accordingly, actual results may differ materially from those reflected or contemplated in such forward-looking statements. Prospective investors are cautioned not to place undue reliance on any forward-looking statements or examples. None of SL Advisors LLC or any of its affiliates or principals nor any other individual or entity assumes any obligation to update any forward-looking statements as a result of new information, subsequent events or any other circumstances. All statements made herein speak only as of the date that they were made. r
Certain hyperlinks or referenced websites on the Site, if any, are for your convenience and forward you to third parties’ websites, which generally are recognized by their top level domain name. Any descriptions of, references to, or links to other products, publications or services does not constitute an endorsement, authorization, sponsorship by or affiliation with SL Advisors LLC with respect to any linked site or its sponsor, unless expressly stated by SL Advisors LLC. Any such information, products or sites have not necessarily been reviewed by SL Advisors LLC and are provided or maintained by third parties over whom SL Advisors LLC exercise no control. SL Advisors LLC expressly disclaim any responsibility for the content, the accuracy of the information, and/or quality of products or services provided by or advertised on these third-party sites.
All investment strategies have the potential for profit or loss. Different types of investments involve varying degrees of risk, and there can be no assurance that any specific investment will be suitable or profitable for a client’s investment portfolio.
Past performance of the American Energy Independence Index is not indicative of future returns.


Leave a Reply
Want to join the discussion?Feel free to contribute!