Natural Gas: The Big Energy Story
The world’s energy sector is undergoing a transformation. Widespread press coverage of the growth in renewables reflects increasing concern about climate change. Nextera Energy, the world’s biggest producer of wind and energy power, epitomizes the excitement about clean energy (see Is Nextera Running in Place?). A recent investor day highlighted falling costs and growing demand in the move away from fossil fuels.
Opposition to new natural gas pipelines has led Con Ed in Westchester County to place a moratorium on new gas hookups. Berkeley, CA has banned natural gas in new buildings. Investors wonder how long fossil fuel demand will last.
But the numbers reveal that natural gas is the real revolution, with renewables having far less impact than press coverage suggests.
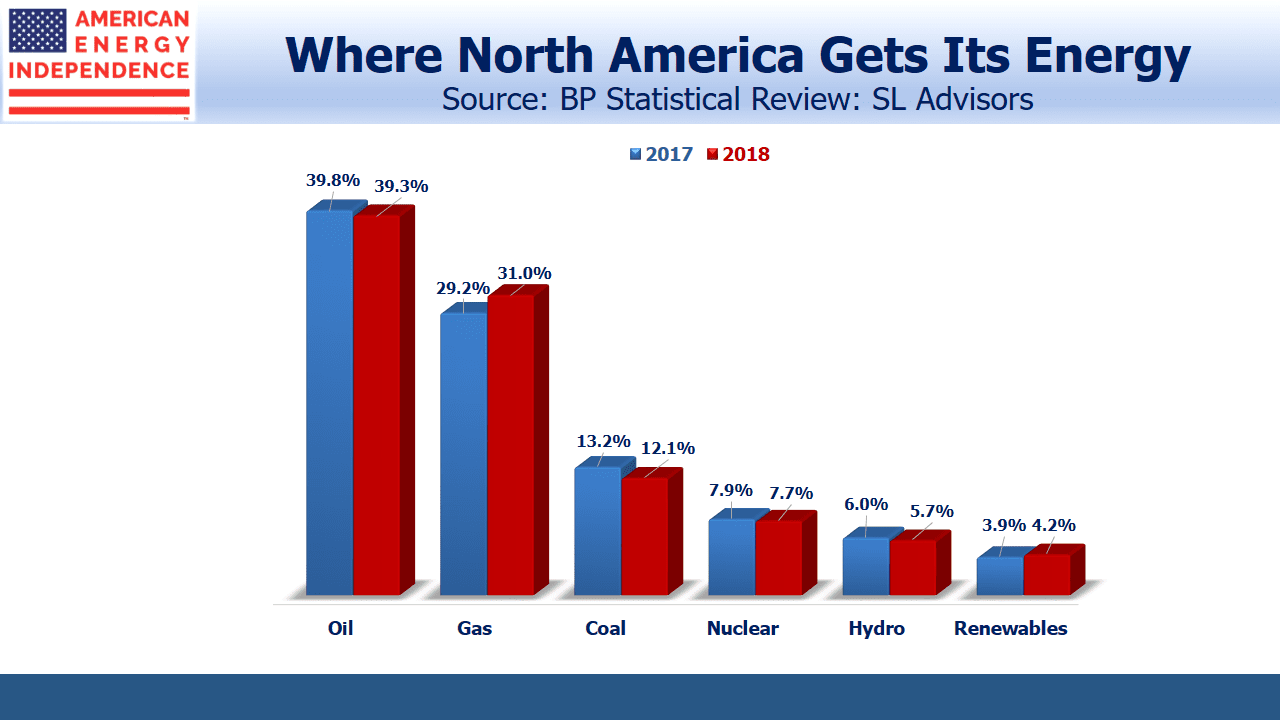
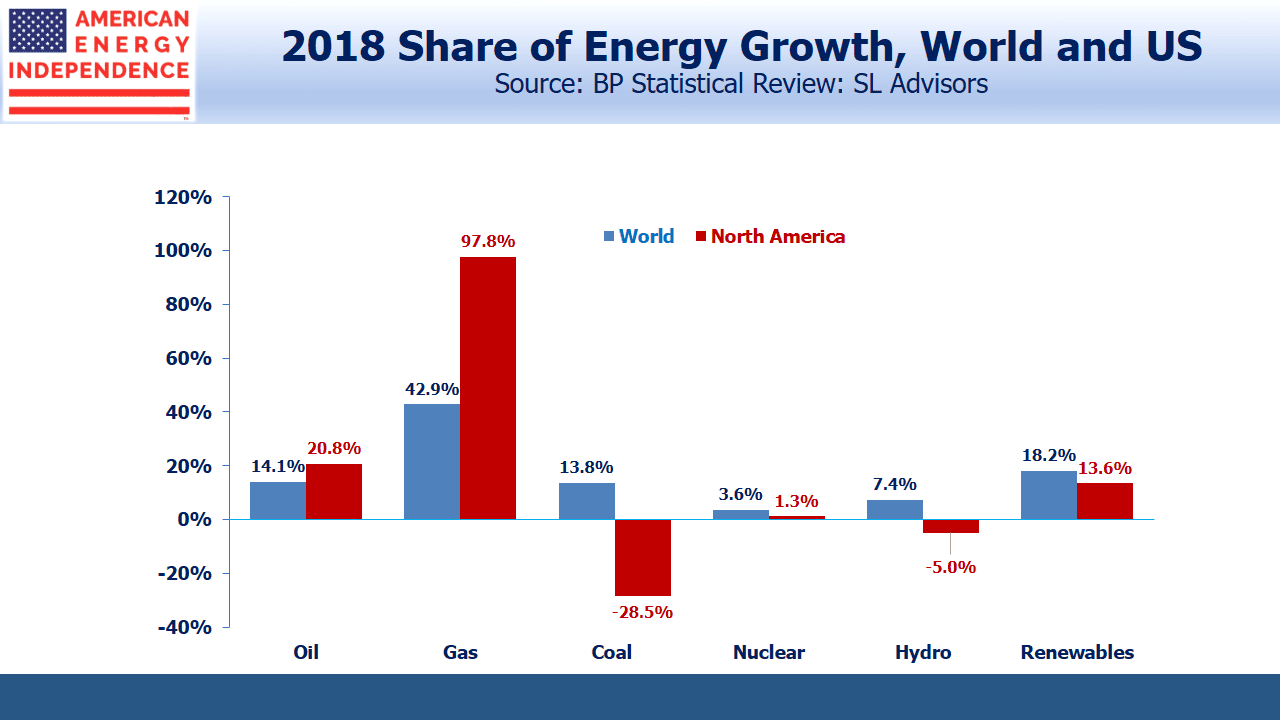
Last year, natural gas provided 43% of the growth in global energy use, versus 18% for renewables. In the U.S. renewables increased their market share from 3.9% to 4.2%, but natural consumption jumped 7X as much in absolute terms, taking market share from 29.2% to 31%. Oil, coal, nuclear and hydro power all suffered modest declines.
The U.S. figures relate to domestic consumption, but Chinese imports of Liquified Natural Gas (LNG) will provide further demand. China consumes more than half the world’s coal. Beijing’s smog is well-known, and domestic pollution has led the government to set ambitious goals for increased natural gas use. Chinese citizens are dying earlier and suffering respiratory illnesses because of coal pollution. The 13th Five Year Plan calls for natural gas to be 10% of China’s primary energy use by next year, and 15% by 2030. Last year natural gas was 7.5%. Although China can claim they are lowering their greenhouse gas emissions, they’re fighting domestic pollution not global climate change.
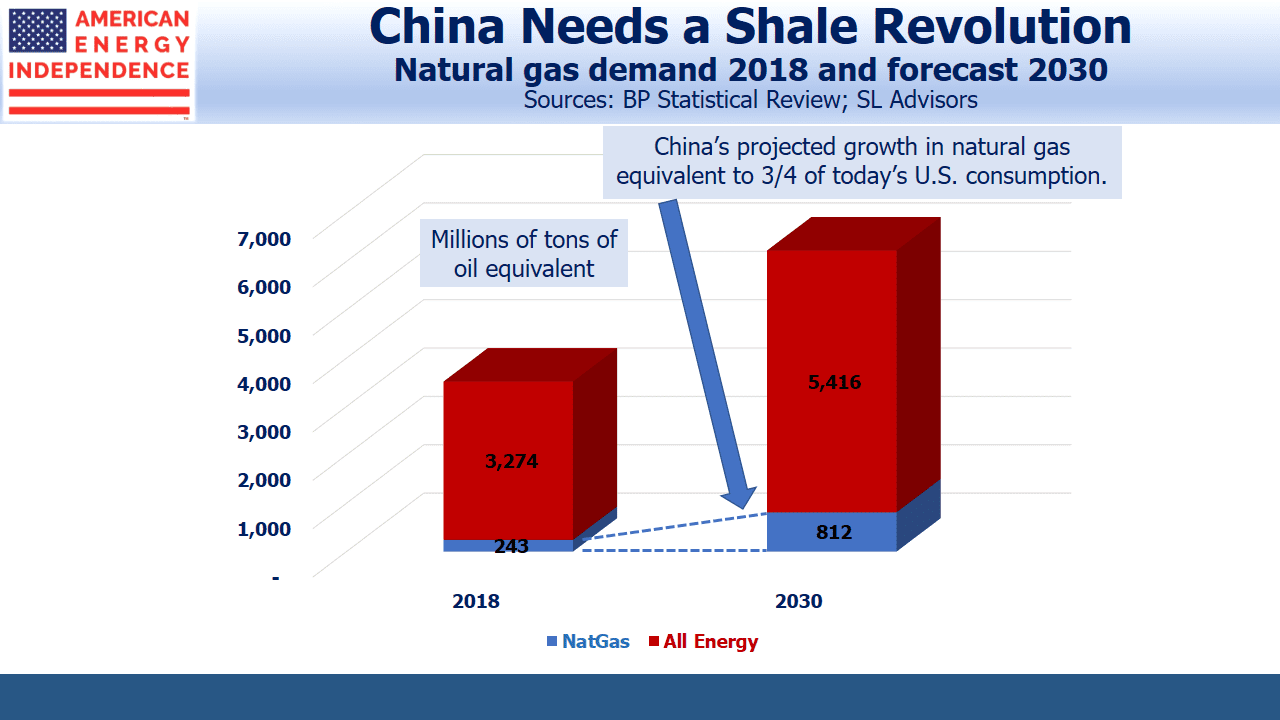
Since China’s energy use is growing, achieving their 2030 goal of 15% natural gas will require much more than simply doubling their existing consumption. Chinese energy demand is growing at 4.3% annually. At that rate, they’ll need 65% more energy than at present. Natural gas use will have to more than triple to reach their 15% goal by 2030.
China will need an additional 61 Billion Cubic feet per Day (BCF/D), approximately three quarters of current U.S. consumption. This is approximately the amount of new gas supply unleashed by the U.S. Shale Revolution. China’s current coal use is equivalent to around 200 BCF/D. There is enormous potential to substitute natural gas.
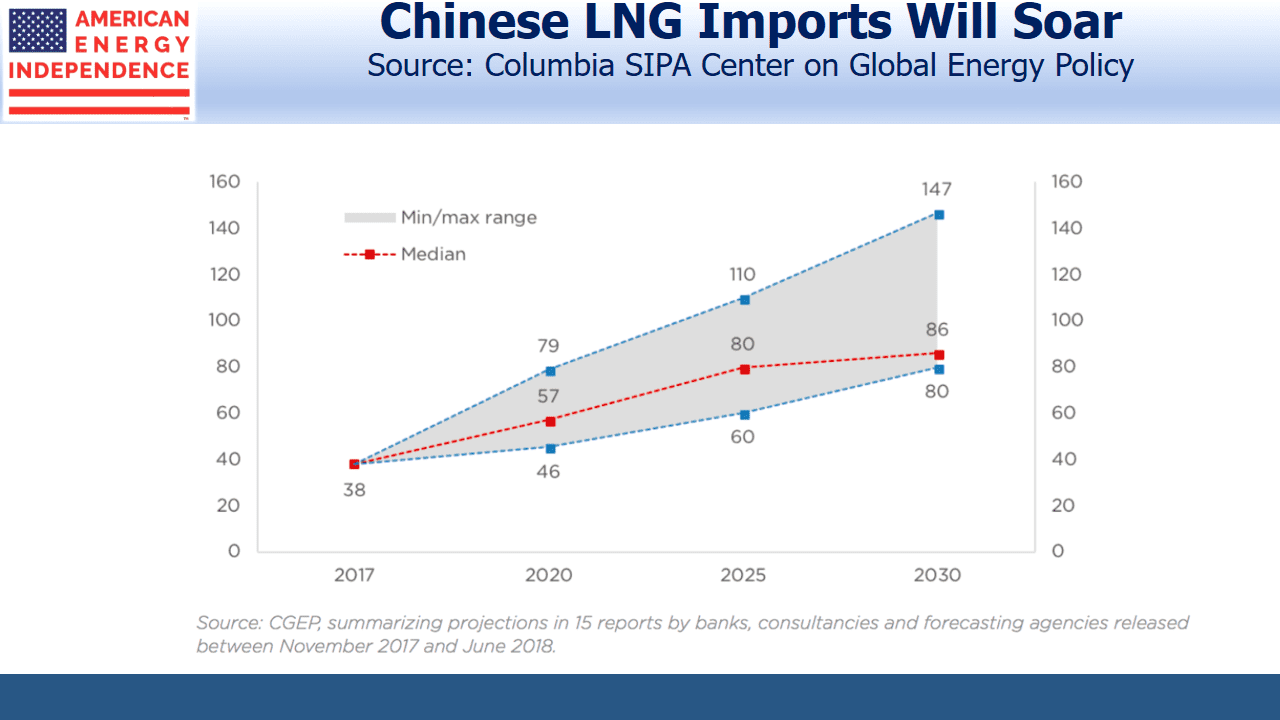
Russian gas from Eastern Siberia will be an important source of new supply, but China is also short of storage capacity. As in the U.S., demand peaks seasonally in summer and winter, but unlike the U.S. China has limited ability to build up reserves in the shoulder seasons. It’s also expected that the new Russian gas supply will have fairly inflexible volumes and won’t be able to vary production seasonally. These two factors are behind the expected jump in Chinese LNG imports over the next decade shown in the chart.
Even if Chinese LNG imports quadruple as in one forecast, China will fall far short of its goal to get just 15% of its energy from natural gas. If the Chinese are serious about combating pollution, they’ll want every feasible LNG export facility built.
If President Trump ran an energy company, he’d blame the liberal media for reporting fake news about the growing dominance of renewables. Solar and wind are an interesting story, and there’s no shortage of reporters covering their growth. But the figures show that profound change in the world’s energy markets is being driven by natural gas. It doesn’t receive commensurate press coverage, but it’s the big story.
SL Advisors is the sub-advisor to the Catalyst MLP & Infrastructure Fund. To learn more about the Fund, please click here.
SL Advisors is also the advisor to an ETF (USAIETF.com).
Important Disclosures
The information provided is for informational purposes only and investors should determine for themselves whether a particular service, security or product is suitable for their investment needs. The information contained herein is not complete, may not be current, is subject to change, and is subject to, and qualified in its entirety by, the more complete disclosures, risk factors and other terms that are contained in the disclosure, prospectus, and offering. Certain information herein has been obtained from third party sources and, although believed to be reliable, has not been independently verified and its accuracy or completeness cannot be guaranteed. No representation is made with respect to the accuracy, completeness or timeliness of this information. Nothing provided on this site constitutes tax advice. Individuals should seek the advice of their own tax advisor for specific information regarding tax consequences of investments. Investments in securities entail risk and are not suitable for all investors. This site is not a recommendation nor an offer to sell (or solicitation of an offer to buy) securities in the United States or in any other jurisdiction.
References to indexes and benchmarks are hypothetical illustrations of aggregate returns and do not reflect the performance of any actual investment. Investors cannot invest in an index and do not reflect the deduction of the advisor’s fees or other trading expenses. There can be no assurance that current investments will be profitable. Actual realized returns will depend on, among other factors, the value of assets and market conditions at the time of disposition, any related transaction costs, and the timing of the purchase. Indexes and benchmarks may not directly correlate or only partially relate to portfolios managed by SL Advisors as they have different underlying investments and may use different strategies or have different objectives than portfolios managed by SL Advisors (e.g. The Alerian index is a group MLP securities in the oil and gas industries. Portfolios may not include the same investments that are included in the Alerian Index. The S & P Index does not directly relate to investment strategies managed by SL Advisers.)
This site may contain forward-looking statements relating to the objectives, opportunities, and the future performance of the U.S. market generally. Forward-looking statements may be identified by the use of such words as; “believe,” “expect,” “anticipate,” “should,” “planned,” “estimated,” “potential” and other similar terms. Examples of forward-looking statements include, but are not limited to, estimates with respect to financial condition, results of operations, and success or lack of success of any particular investment strategy. All are subject to various factors, including, but not limited to general and local economic conditions, changing levels of competition within certain industries and markets, changes in interest rates, changes in legislation or regulation, and other economic, competitive, governmental, regulatory and technological factors affecting a portfolio’s operations that could cause actual results to differ materially from projected results. Such statements are forward-looking in nature and involves a number of known and unknown risks, uncertainties and other factors, and accordingly, actual results may differ materially from those reflected or contemplated in such forward-looking statements. Prospective investors are cautioned not to place undue reliance on any forward-looking statements or examples. None of SL Advisors LLC or any of its affiliates or principals nor any other individual or entity assumes any obligation to update any forward-looking statements as a result of new information, subsequent events or any other circumstances. All statements made herein speak only as of the date that they were made. r
Certain hyperlinks or referenced websites on the Site, if any, are for your convenience and forward you to third parties’ websites, which generally are recognized by their top level domain name. Any descriptions of, references to, or links to other products, publications or services does not constitute an endorsement, authorization, sponsorship by or affiliation with SL Advisors LLC with respect to any linked site or its sponsor, unless expressly stated by SL Advisors LLC. Any such information, products or sites have not necessarily been reviewed by SL Advisors LLC and are provided or maintained by third parties over whom SL Advisors LLC exercise no control. SL Advisors LLC expressly disclaim any responsibility for the content, the accuracy of the information, and/or quality of products or services provided by or advertised on these third-party sites.
All investment strategies have the potential for profit or loss. Different types of investments involve varying degrees of risk, and there can be no assurance that any specific investment will be suitable or profitable for a client’s investment portfolio.
Past performance of the American Energy Independence Index is not indicative of future returns.


Leave a Reply
Want to join the discussion?Feel free to contribute!