MLPs: Five Years On, Cheaper Than Ever
The end of August was the five year anniversary of the peak in MLPs. Had it not been for the distraction caused last week by a more compelling story (see Blackstone and Tallgrass Further Discredit the MLP Model), we would have already noted this milestone.
The Alerian MLP index, albeit much changed and diminished since August 2014, remains 38% lower including dividends. We won’t repeat the reasons, which are familiar to regular readers (see It’s the Distributions, Stupid!).
Pipeline stocks have certainly labored under some poor management decisions (see Kinder Morgan: Still Paying for Broken Promises) and self-dealing (see Why Energy Transfer Can’t Get Respect). However the Blackstone take-private offer for Tallgrass (TGE) plays out, this unfortunate episode has confirmed the wariness of many investors for the weak governance of publicly traded partnerships.
But the broad energy sector also languishes, now representing less than 4.5% of the S&P500. The S&P energy ETF (XLE) is 42% off its highs of June 2014. The Van Eck oil services ETF (OIH) is down a staggering 83%. The sustained weakness in the pipeline sector has to be considered against this backdrop. Even Exxon Mobil (XOM) is 25% off its April 2014 high, and yields over 5%. For the first time in the history of the S&P500, XOM is not in the top ten.
Energy investors are keenly aware that, although their sector bottomed in February 2016 along with crude oil, the broader equity market has risen over 50% from that low point. The S&P500 is within 2% of new all-time highs.
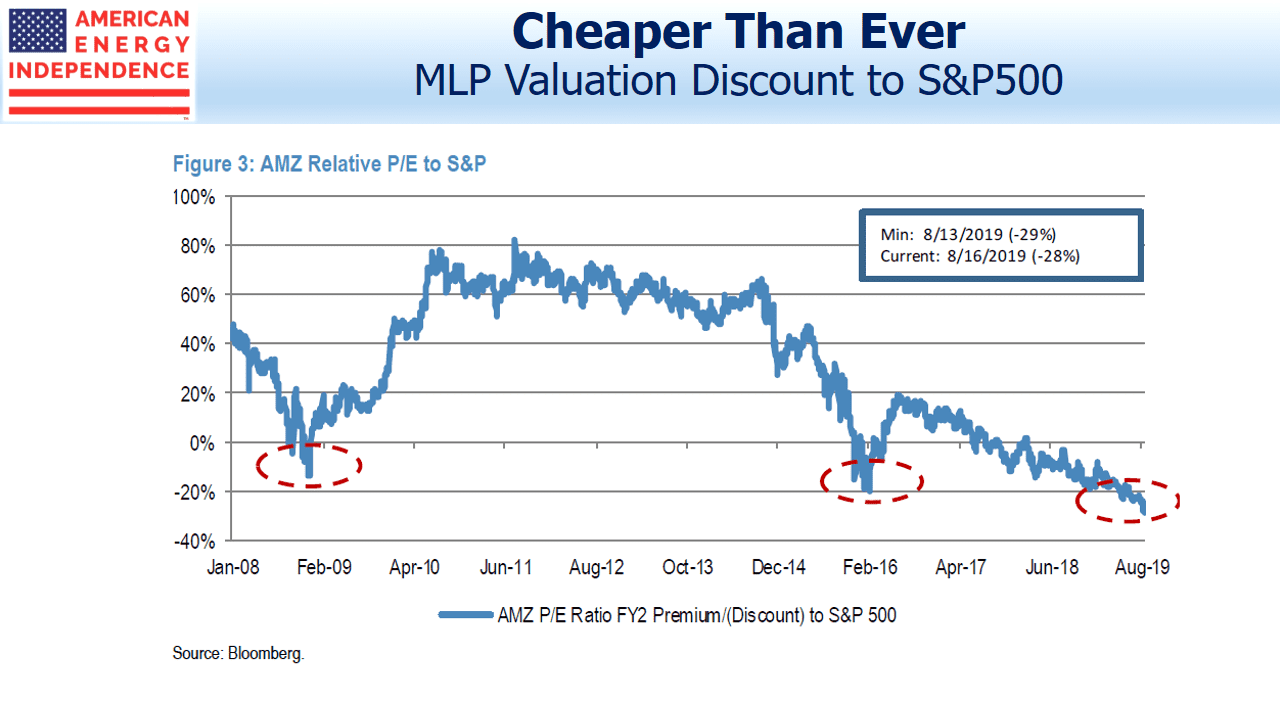
Holders of midstream energy infrastructure stocks are clearly not momentum investors. But they have identified relative value – the chart below highlights that relative P/Es compared with the S&P500 favor MLPs more clearly than during the financial crisis, or even the February 2016 low which capped an even bigger drop than in 2008-9.
P/Es rarely even figure in evaluations of MLPs, since earnings are often distorted by depreciation charges that don’t reflect the actual change in value of owned assets. So it’s notable that even using earnings numbers that are usually lower than Distributable Cash Flow (DCF), the sector is cheap.
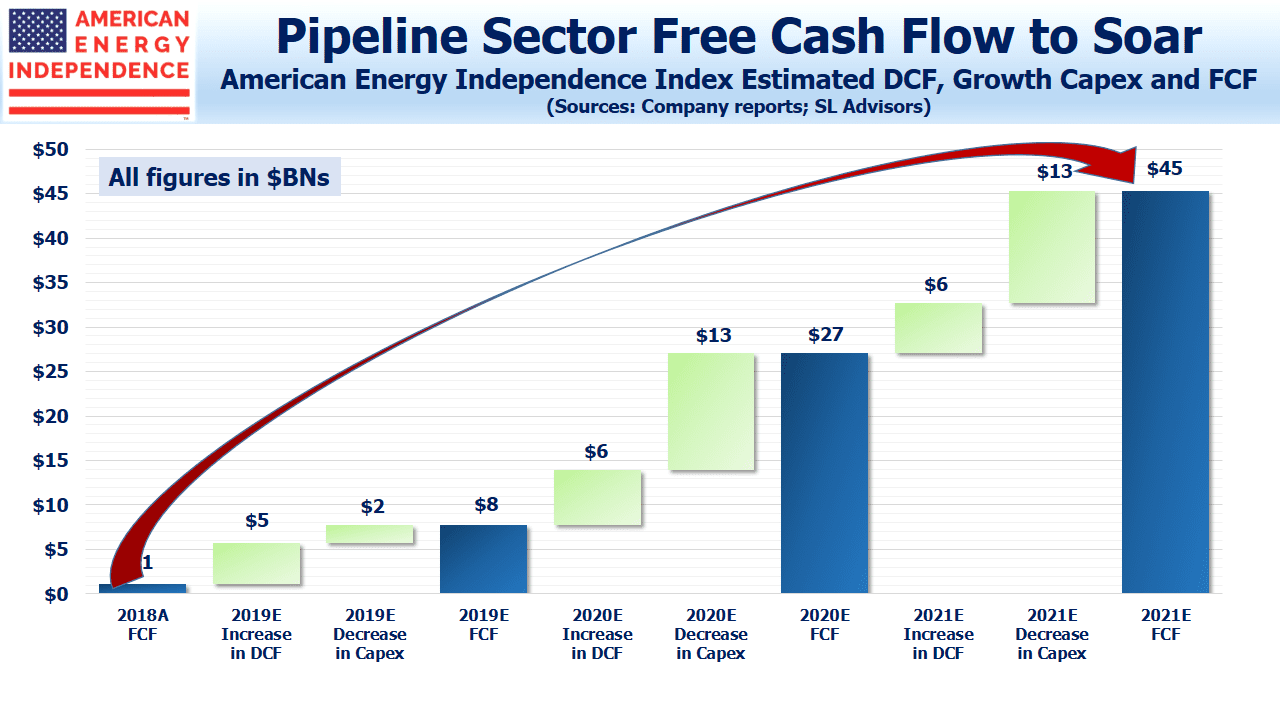
In discussions with investors, we continue to find that growth in free cash flow is the strongest bullish case. The chart below (also see The Coming Pipeline Cash Gusher) is based on the American Energy Independence Index, which provides broad exposure to North American corporations along with a few large MLPs. Existing assets are generating increased DCF, and investment in new projects peaked last year. We revise these projections quarterly based on guidance during earnings calls, and so far the numbers are approximately tracking what we expected when we first projected FCF in April.
There can be few areas of investing as unloved as energy. Investors may be put off by past distribution cuts, poor capital allocation decisions, questionable governance or climate change (see Our Fossil Fuel Future (With a Bit More Solar and Wind)).
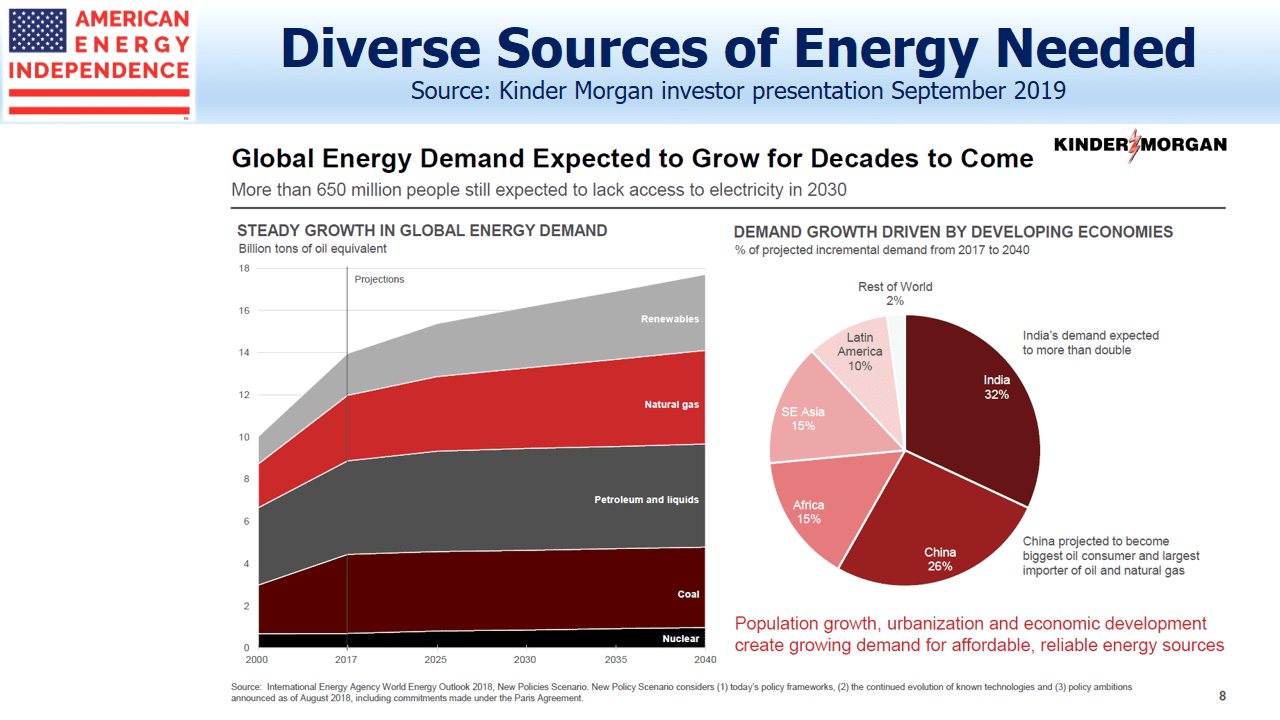
In response: distributions are rising; growth capex has peaked; most of the sector is now corporations, with more robust governance; and serious long term forecasts recognize that fossil fuels will provide 80% or so of the world’s energy for decades to come.
Valuations and growing cashflows support a recovery in prices.
We are invested in TGE.
SL Advisors is the sub-advisor to the Catalyst MLP & Infrastructure Fund. To learn more about the Fund, please click here.
SL Advisors is also the advisor to an ETF (USAIETF.com).
Important Disclosures
The information provided is for informational purposes only and investors should determine for themselves whether a particular service, security or product is suitable for their investment needs. The information contained herein is not complete, may not be current, is subject to change, and is subject to, and qualified in its entirety by, the more complete disclosures, risk factors and other terms that are contained in the disclosure, prospectus, and offering. Certain information herein has been obtained from third party sources and, although believed to be reliable, has not been independently verified and its accuracy or completeness cannot be guaranteed. No representation is made with respect to the accuracy, completeness or timeliness of this information. Nothing provided on this site constitutes tax advice. Individuals should seek the advice of their own tax advisor for specific information regarding tax consequences of investments. Investments in securities entail risk and are not suitable for all investors. This site is not a recommendation nor an offer to sell (or solicitation of an offer to buy) securities in the United States or in any other jurisdiction.
References to indexes and benchmarks are hypothetical illustrations of aggregate returns and do not reflect the performance of any actual investment. Investors cannot invest in an index and do not reflect the deduction of the advisor’s fees or other trading expenses. There can be no assurance that current investments will be profitable. Actual realized returns will depend on, among other factors, the value of assets and market conditions at the time of disposition, any related transaction costs, and the timing of the purchase. Indexes and benchmarks may not directly correlate or only partially relate to portfolios managed by SL Advisors as they have different underlying investments and may use different strategies or have different objectives than portfolios managed by SL Advisors (e.g. The Alerian index is a group MLP securities in the oil and gas industries. Portfolios may not include the same investments that are included in the Alerian Index. The S & P Index does not directly relate to investment strategies managed by SL Advisers.)
This site may contain forward-looking statements relating to the objectives, opportunities, and the future performance of the U.S. market generally. Forward-looking statements may be identified by the use of such words as; “believe,” “expect,” “anticipate,” “should,” “planned,” “estimated,” “potential” and other similar terms. Examples of forward-looking statements include, but are not limited to, estimates with respect to financial condition, results of operations, and success or lack of success of any particular investment strategy. All are subject to various factors, including, but not limited to general and local economic conditions, changing levels of competition within certain industries and markets, changes in interest rates, changes in legislation or regulation, and other economic, competitive, governmental, regulatory and technological factors affecting a portfolio’s operations that could cause actual results to differ materially from projected results. Such statements are forward-looking in nature and involves a number of known and unknown risks, uncertainties and other factors, and accordingly, actual results may differ materially from those reflected or contemplated in such forward-looking statements. Prospective investors are cautioned not to place undue reliance on any forward-looking statements or examples. None of SL Advisors LLC or any of its affiliates or principals nor any other individual or entity assumes any obligation to update any forward-looking statements as a result of new information, subsequent events or any other circumstances. All statements made herein speak only as of the date that they were made. r
Certain hyperlinks or referenced websites on the Site, if any, are for your convenience and forward you to third parties’ websites, which generally are recognized by their top level domain name. Any descriptions of, references to, or links to other products, publications or services does not constitute an endorsement, authorization, sponsorship by or affiliation with SL Advisors LLC with respect to any linked site or its sponsor, unless expressly stated by SL Advisors LLC. Any such information, products or sites have not necessarily been reviewed by SL Advisors LLC and are provided or maintained by third parties over whom SL Advisors LLC exercise no control. SL Advisors LLC expressly disclaim any responsibility for the content, the accuracy of the information, and/or quality of products or services provided by or advertised on these third-party sites.
All investment strategies have the potential for profit or loss. Different types of investments involve varying degrees of risk, and there can be no assurance that any specific investment will be suitable or profitable for a client’s investment portfolio.
Past performance of the American Energy Independence Index is not indicative of future returns.


It’s always helpful and reassuring to see a longer term perspective than the market does.