MLP Distributions Through the Looking Glass
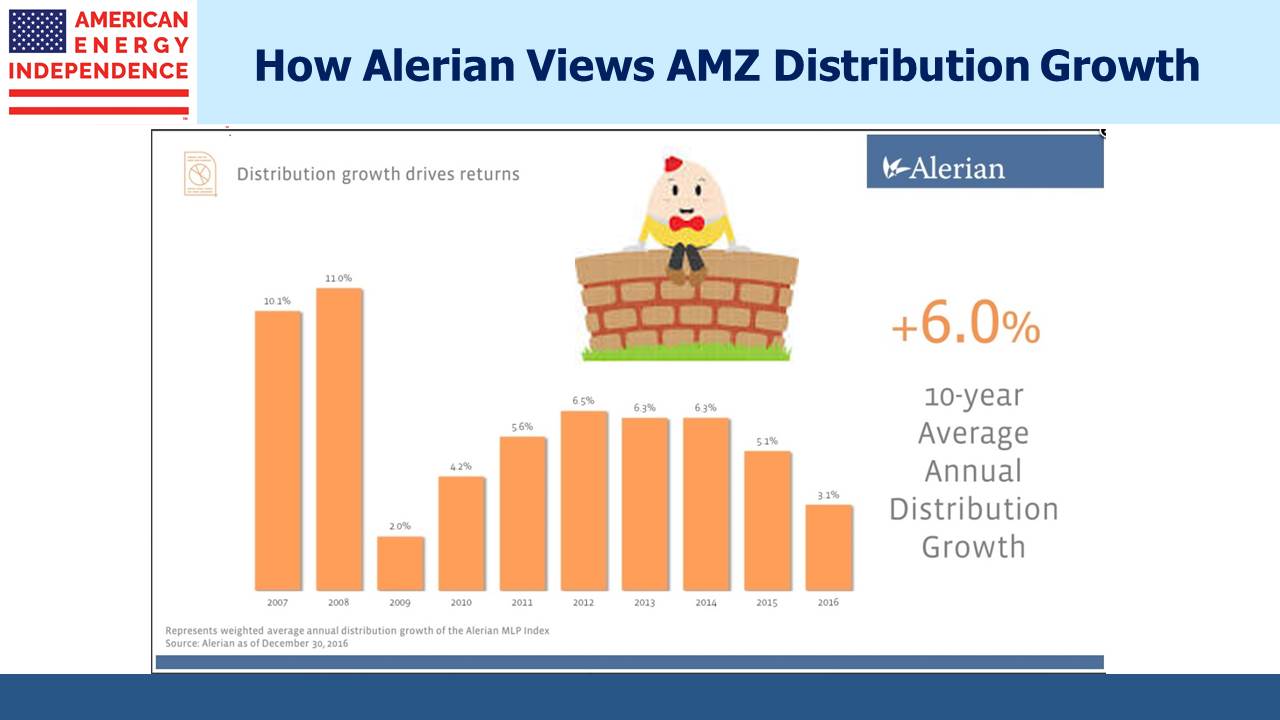
Alerian’s page showing annual distribution growth for the Alerian MLP Index (AMZ) contains their most popular chart (it’s the 4th one down under “Figures and Tables”). It’s no wonder – the steadily growing distributions it portrays should be enough to calm any income seeking, excitement-averse investor. Since it’s their most viewed page, many investors must have drawn comfort from the reliability it presents. The turmoil endured by MLP investors since 2014 appears incongruous when such steady growth in payouts is considered.
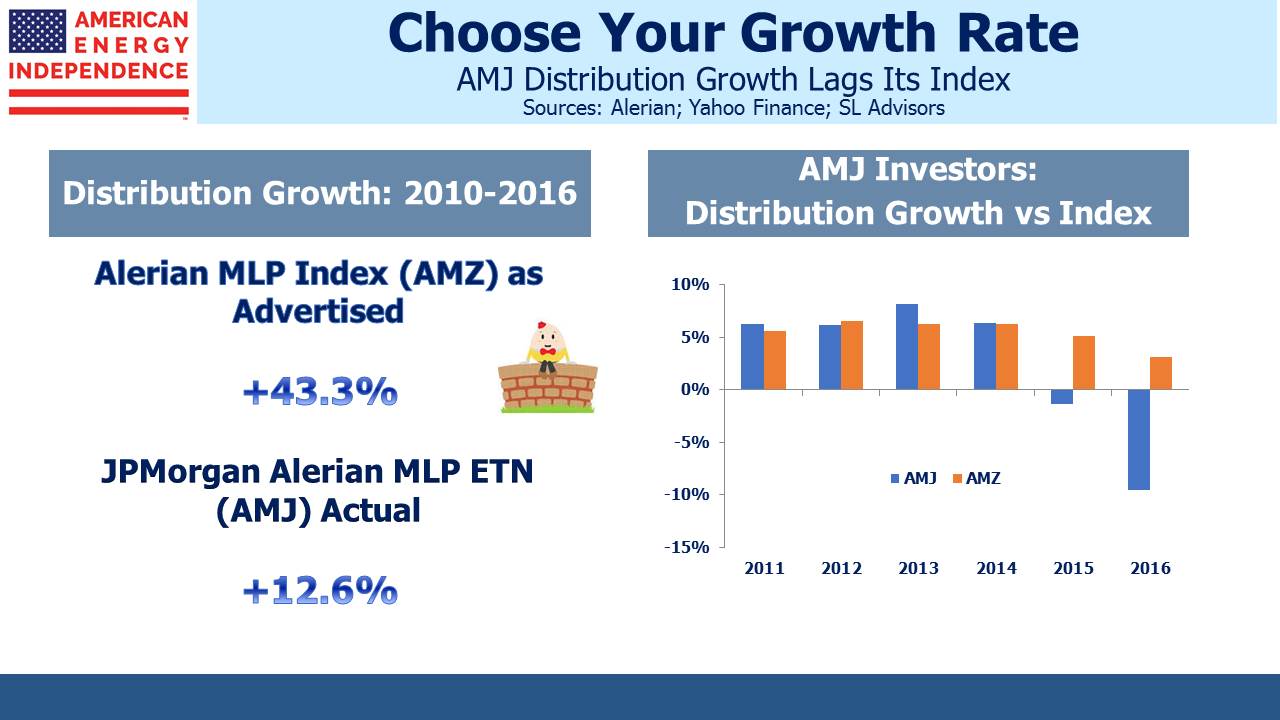
Oddly, investors who hold securities linked to the index (such as the JPMorgan Alerian MLP Index ETN: AMJ) have not enjoyed the distribution growth presented by the index. It’s because of Alerian’s curious method of calculation.
The components of the index are updated periodically based on criteria set by Alerian. The growth figure they calculate takes the index members at the end of the year, and looks back to calculate the year-over-year growth rate they experienced. Some of those names may not have been in the index over the prior two years, and perhaps more importantly those names that have been dropped (often because they cut their payout) are excluded.
The distribution growth rate therefore reflects what today’s index members are growing at. This may be useful information, but it’s not the same as calculating the growth rate of distributions received by investors in the index. Moreover, it creates an upward bias to the calculation, because poorly performing names who cut their payouts are dropped while recently IPO’d high fliers are included. During the 2015-16 MLP collapse Alerian relaxed the requirement that any AMZ member cutting their distribution be excluded, probably because it would have led to an overly concentrated index.
“When I use a word,” Humpty Dumpty said, in rather a scornful tone, “it means just what I choose it to mean—neither more nor less.” It’s Growth Through the Looking Glass.
The distribution history of AMJ, which is benchmarked to AMZ, shows that actual payouts have been falling since 2015. MLPs have been cutting payouts. Investors know this. The miserably tax-burdened ETF AMLP (seven year since inception return 2.8%, roughly half its index benchmark. See Some MLP Investors Get Taxed Twice), cut its distribution by 15.6% in 2017 following a 13.8% cut in 2016. AMJ’s 2017 dividends are 8% lower than the prior year. The AMZ distribution growth chart suggests a more positive history, and will presumably show better 2017 growth versus its linked investment products when it’s updated.
“But have distributions been growing or shrinking?” asked Alice. “Yes”, replied Humpty Dumpty.
Alerian is very open about their process. In February 2016 Alerian’s Karyl Patredis explained the procedure behind the chart. I know Alerian’s CEO Kenny Feng. He’s smart and has built a fine business. I’m sure there’s absolutely no intent to mislead people.
But this look-back methodology is not intuitive. It clearly doesn’t align with how investors actually experience dividend growth. If investors infer from the chart that MLP distributions have been growing steadily, they’re more likely to buy an Alerian-linked product such as AMJ or AMLP.
MLPs are redirecting more of their cash flow into new projects, and many of the larger ones have become C-corps so as to access a far wider set of investors. As a result, MLPs represent a shrinking piece of the energy infrastructure sector. To be a pure MLP investor today is to miss out on many of the biggest companies that are supporting America’s drive to Energy Independence.
This is why we created the American Energy Independence Index (up 6.5% in December), and its investable ETF, to better reflect what’s happening in energy infrastructure. As we’ve noted before (see The Changing MLP Investor), yield is less relevant to today’s investors. Stable businesses are reinvesting for growth, which is attracting total-return buyers. MLP payouts have been falling to allow for reinvestment back in their businesses and to reduce leverage. To believe MLP distributions have been growing is to follow a white rabbit down a hole.

