Kinder Morgan Responds to our Recent Criticism
To their credit, Kinder Morgan (KMI) responded to our recent blog (see Kinder Morgan’s Slick Numeracy). We exchanged several emails, although they declined our invitation to write a rebuttal which we promised to publish unedited. The company stands by their presentation, but did concede that some slides might have been more clearly labeled.
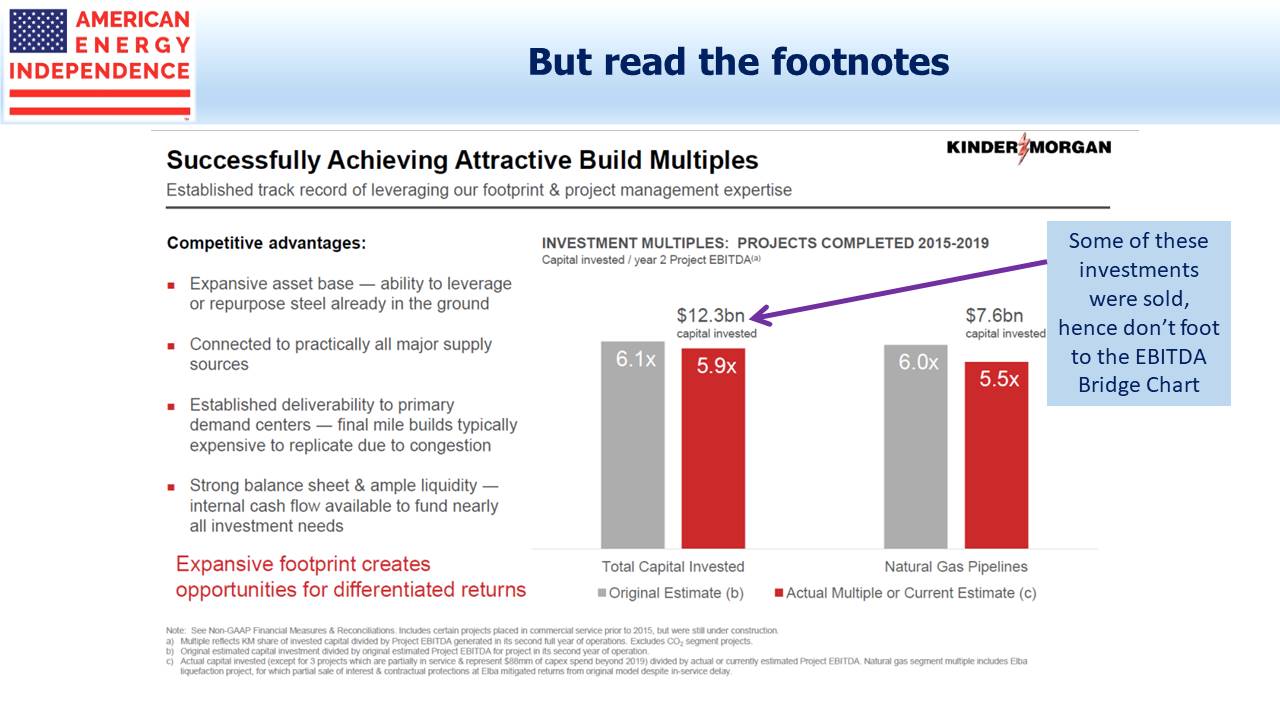
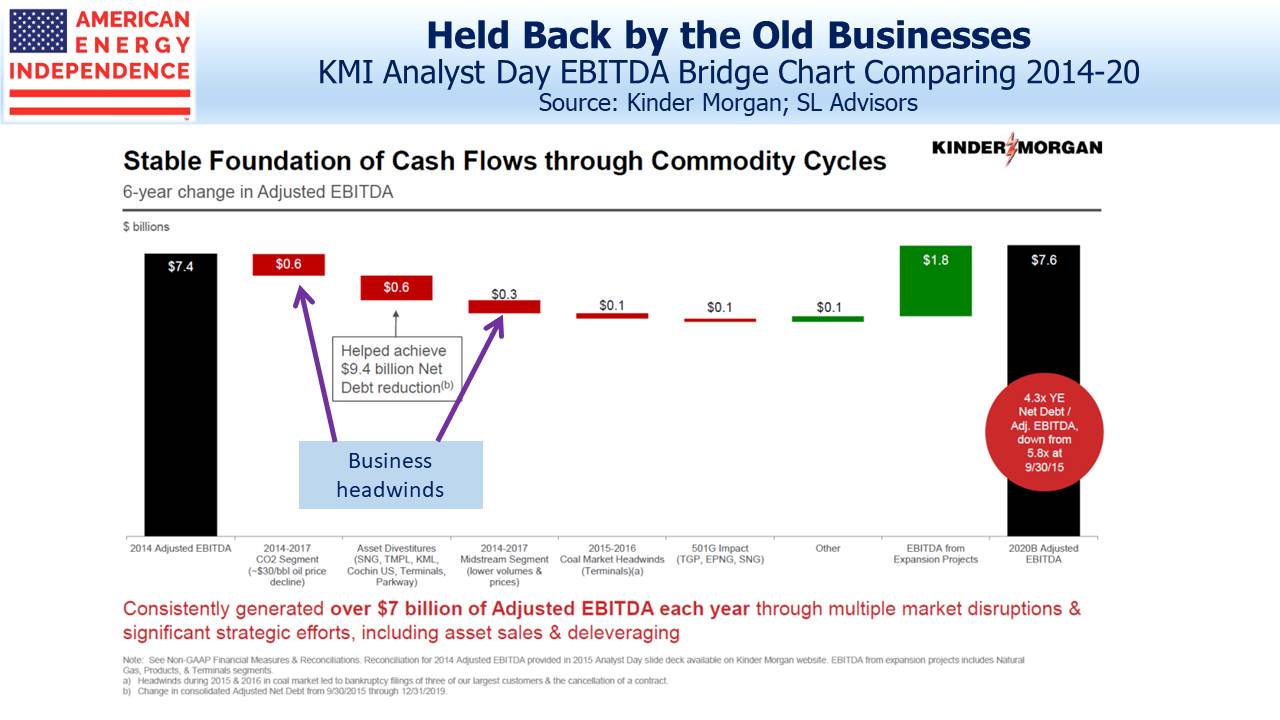
We had noted in our blog that the 5.9X EBITDA multiple on $12.3BN invested didn’t foot to the $1.8BN EBITDA from growth projects in the Bridge Chart. KMI explained this was because some investments they made had been sold in the meantime.
They believe that attractive returns on more recent investments have been masked by headwinds in their existing business. The EBITDA Bridge Chart blames the 2014-17 energy downturn for $0.6BN in reduced EBITDA from their CO2 business, which is net of new investment (i.e. CO2 growth projects are included in this figure). The $0.3BN drop in the Midstream segment was from lower volumes and tariffs in their pipelines.
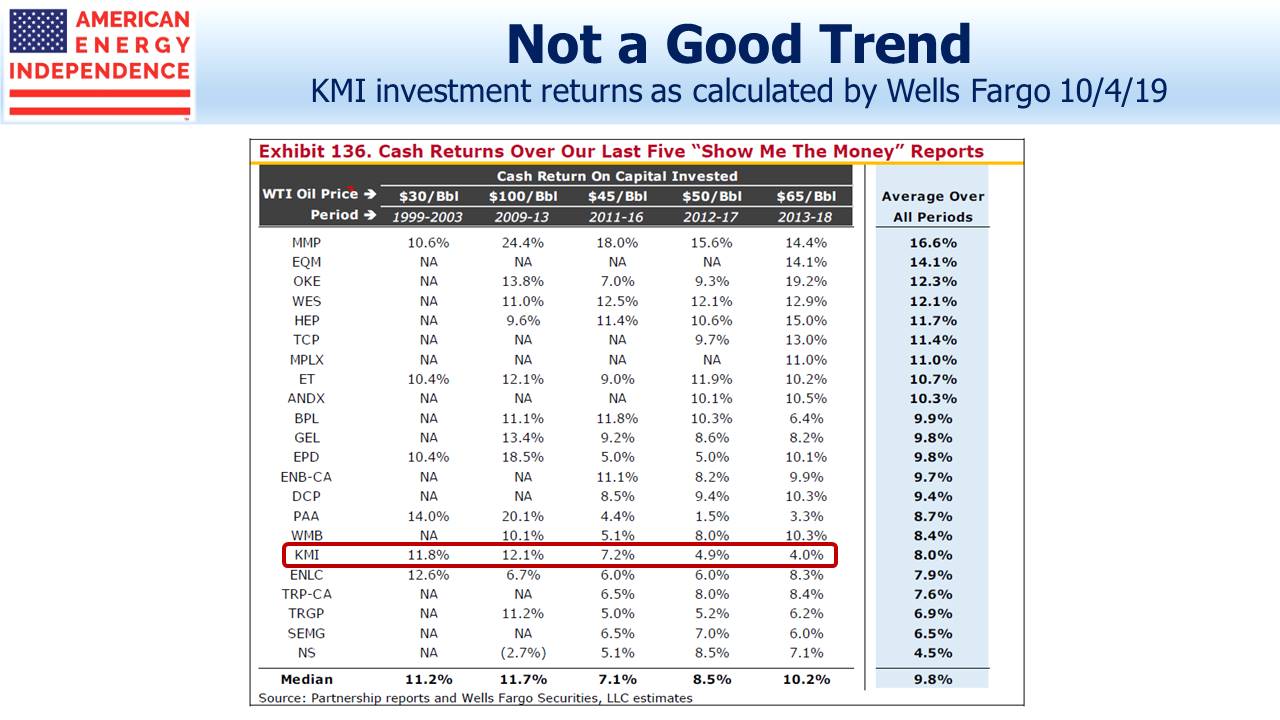
KMI’s return on invested capital has drawn questions from others. A January 6 research report from Morgan Stanley placed KMI’s 2017-18 Return on Invested Capital (ROIC) at 4.5%, worst out of 12 peers. In October, Wells Fargo calculated a 2013-18 cash return on investment of 4%, 2nd worst in the group and declining.
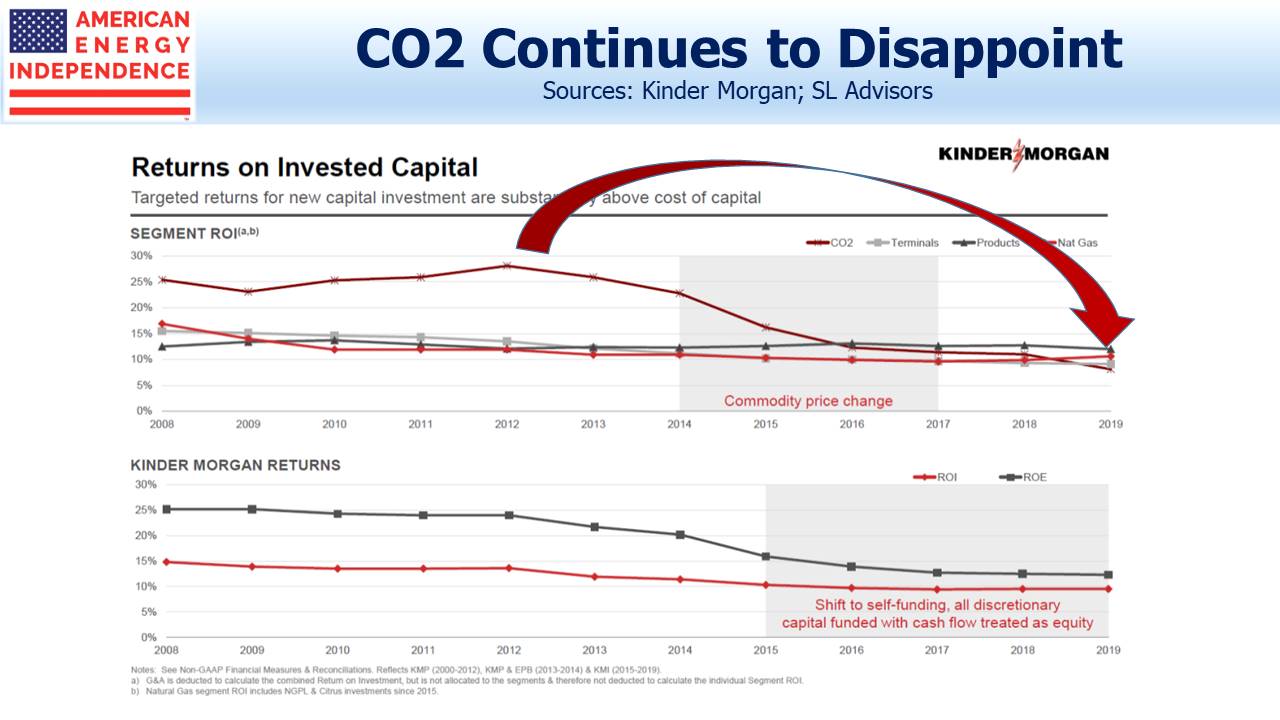
In response, KMI referred us to a slide showing ROIC by segment. They say they have discussed the Wells piece with the firm, and make a distinction between recently invested capital and returns on legacy assets.
The ROIC slide incorporates some complexity. The footnote reminds that pre-2014 returns are from Kinder Morgan Partners (KMP) and El Paso (EPB), which is where KMI’s operating assets were held before being rolled up into the parent. Those were the days of Incentive Distribution Rights (IDRs), when KMP and EPB both paid a share of their returns back to their controlling general partner, KMI.
Once the IDRs went away, returns might have been expected to jump. That they didn’t suggests that the chart treats IDRs as a cost of capital and not as an expense to KMP and EPB, which they most assuredly were. So we think the returns are on the assets, not on what KMP and EPB unitholders earned on those assets.
KMI believes they are making a genuine effort to present their case, and in providing so much detail they create opportunities for investors like us to look for inconsistencies. But we think that EBITDA multiples aren’t a good way to do it. The declining ROIC chart is hard to reconcile with higher recent returns. It also highlights the volatility of the CO2 business, which they evidently believe can get back to the returns it generated a decade ago. The fact that they haven’t yet received a sufficiently attractive offer for this segment means few share their optimism.
The company uses IRR in allocating capital. They say new projects require unlevered pre-tax returns of 15-20%, but their ROIC chart shows returns sliding towards 10%. At some point the high return investments of recent years must lift their overall ROIC. EBITDA multiples can flatter – a project with declining EBITDA (like a CO2 investment) might look superficially attractive based on Year 2 returns but ultimately not cover the cost of capital. The company is adamant they’re not allocating this way. So why not show expected IRRs on new investments?
We appreciate KMI’s effort to reach out – “slick numeracy” probably didn’t gain us any additional friends there. Along with countless other long-time investors, we’re frustrated that KMI remains well below the highs of 2014. Their stable, fee-generating assets ought to draw a higher valuation.


