Here Comes The Sun: The Bright Future of Oil and Gas
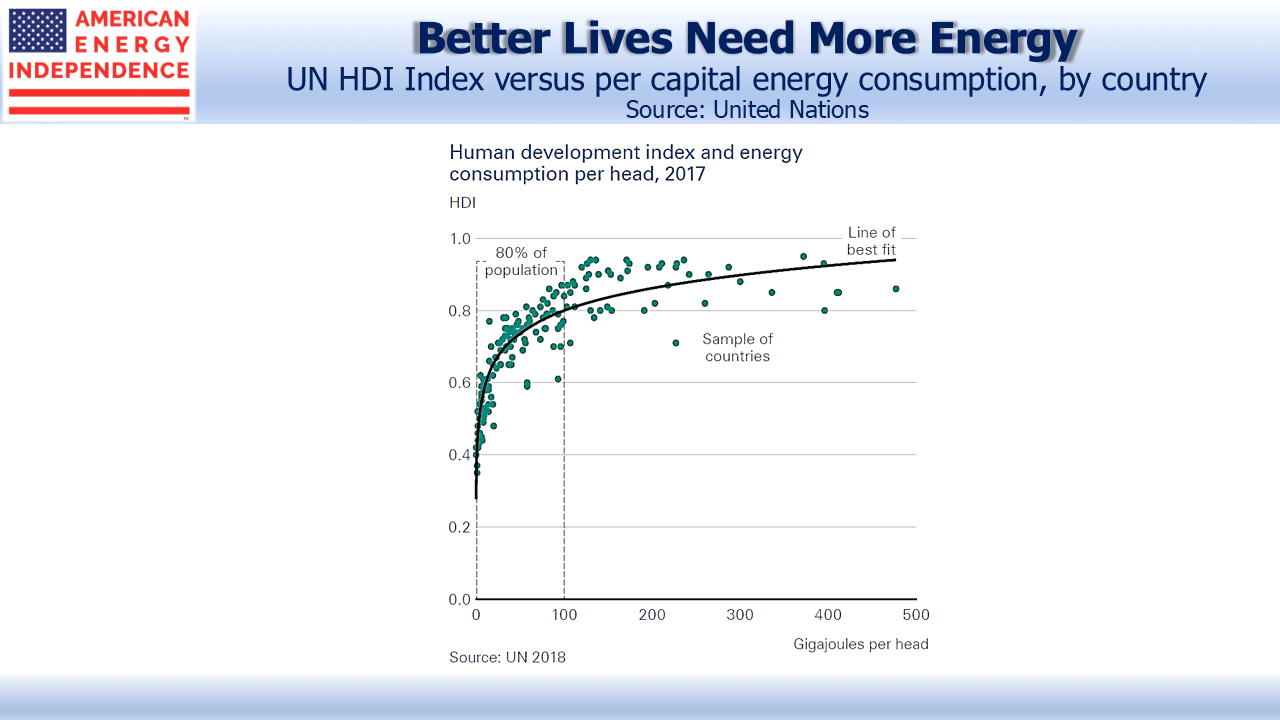
The United Nations Human Development Index (HDI) combines life expectancy, education and income to provide a more complete picture of well-being than simply considering GDP per capita. If one chart can illustrate the global challenge of combatting climate change, it might be the scatterplot below.
HDI is inextricably linked to energy consumption. 100 Gigajoules (GJ) per head is approximately where improvements in HDI begin to flatten out. 80% of the world’s population lives below this level, and presumably aspires to it. Much of the developing world is in this category. The UN recently recommended the adoption of policies to limit global warming. The Green New Deal went further, with highly impractical solutions (see The Green Bovine Dream).
The world wants more energy and reduced emissions. The 2019 BP Energy Outlook acknowledges these conflicting goals. Its base case (called Evolving Transition) predicts that by 2040 two thirds of the world’s population will still be under the 100 GJ threshold, while CO2 emissions will have grown. This compromise will satisfy few, and it’s their central forecast.
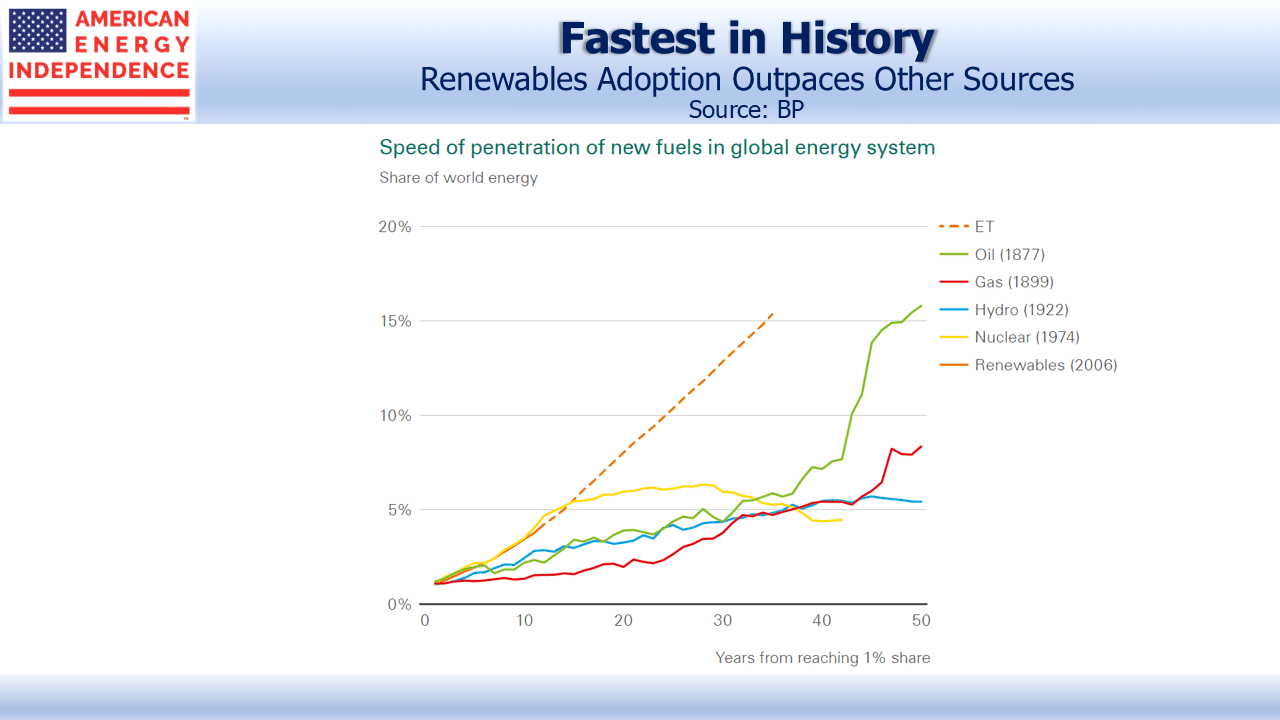
The world relies on fossil fuels for 80% of its energy. Critics will claim BP sees their continued dominance because their entire business locates, extracts, processes and sells them. But BP’s outlook forecasts a 20 year penetration rate for renewables of 15%, around triple that experienced historically by oil, gas, hydroelectric or nuclear power as their use ramped up.
BP’s report includes many interesting conclusions out to 2040:
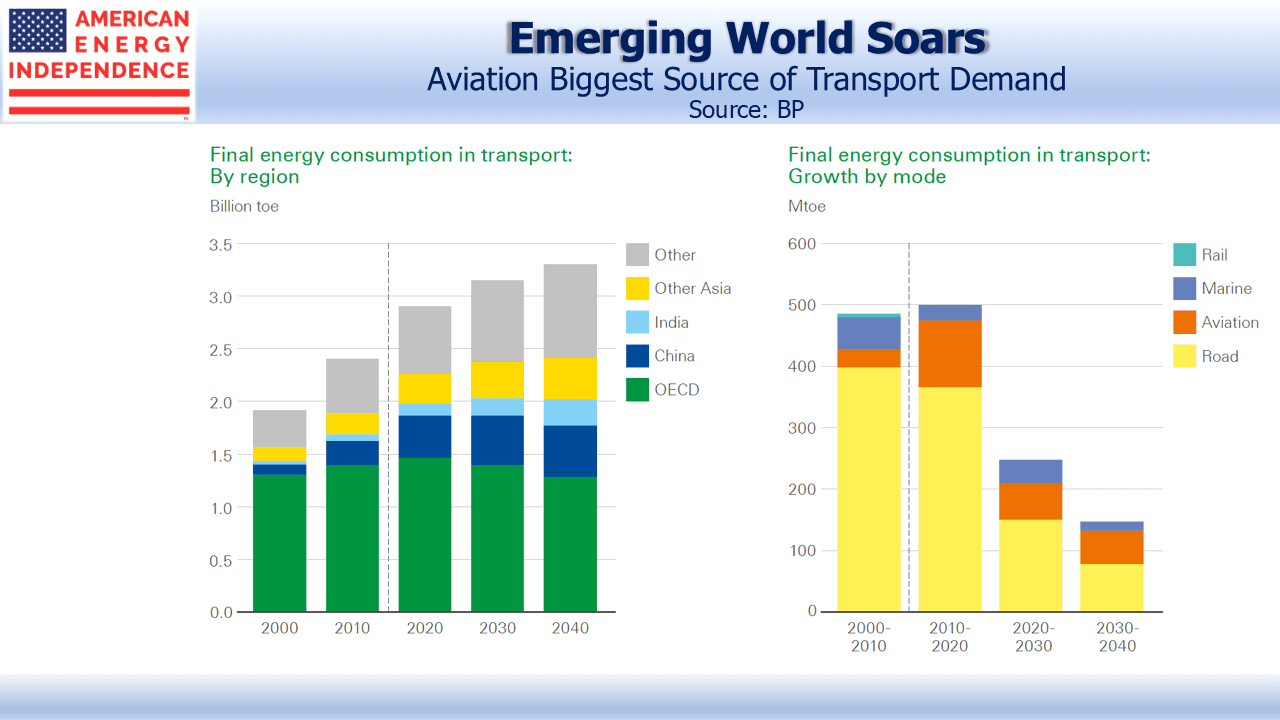
- Global energy consumption for road use will fall
- Aviation energy use will rise
- Developing world energy use will rise sharply, led by China and India
- Electric vehicles will represent 15% of the global fleet and 24% of vehicle/kms driven
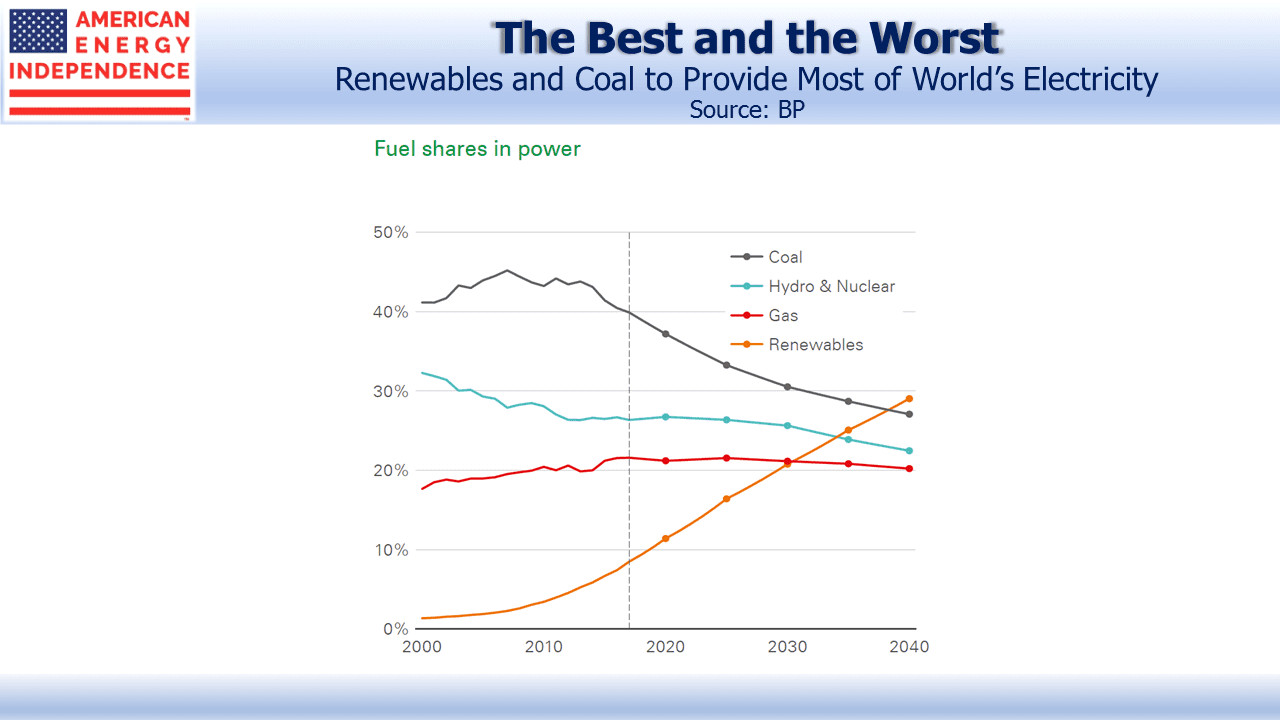
- Renewables will be the biggest source of electricity generation
- Coal will be #2, above 25%, because of continued increasing energy demand
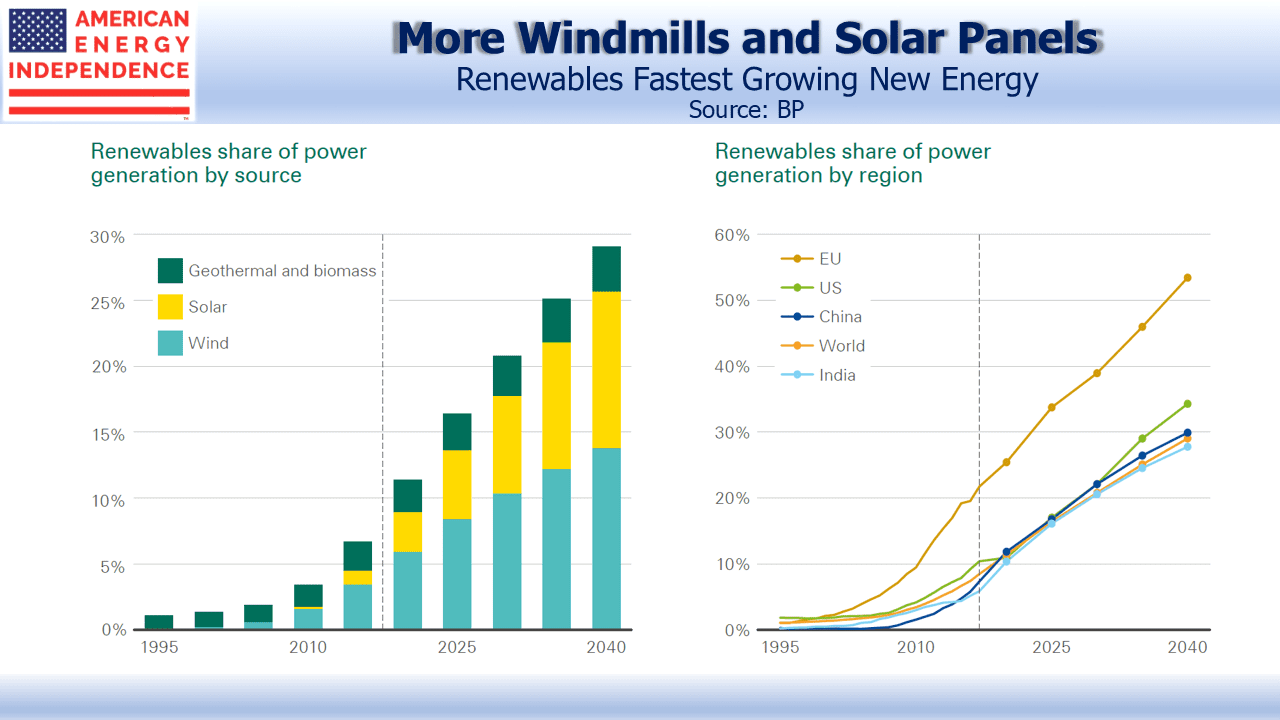
- 53% of EU power supply will be from renewables
The report considers other scenarios, including public policies that accelerate the move away from fossil fuels. If this led to a sharp drop in crude demand, the report speculates that low-cost oil producers might react by ramping up production to avoid having stranded assets. It’s thought-provoking — sell now or miss your opportunity. Such a price collapse would stimulate demand, slowing the energy transition.
Returning to the base case, renewables will gain market share in developing countries faster than in the OECD. It may surprise to consider rising energy demand lifting renewables penetration. But energy use is capital-intensive.
Today’s gasoline-burning automobiles last over ten years; power plants can run for 30 or more, and energy inefficient buildings can have many decades of useful life. It’s hard for a new solar farm to compete on economics with an existing natural gas burning power plant.
OECD energy consumption looks to be flat, as population growth is offset by efficiencies. This means renewable infrastructure is replacing something older, and wholesale decommissioning of assets with years of useful life left is an extreme, unlikely solution. By contrast, growing energy demand in emerging economies allows renewables to gain market share. Rising living standards in developing countries will reduce bus use in favor of private cars, hence the jump in vehicle/kms and, most likely, epic traffic jams.
Overall, the report’s central forecast for a substantial increase in renewables and in electric vehicles should be welcomed by those environmental activists who acknowledge the enormous challenge in such an energy transformation. BP’s conclusions are broadly echoed by other long range forecasts, including those from the U.S. Energy Information Administration, the International Energy Agency, Exxon Mobil, IHS Markit and CNPC Economics & Technology Research Institute. This is not a radical outlook.
Nonetheless, natural gas demand is expected to grow at 1.7% annually. Crude oil demand growth of 0.3% reflects rising non-combusted demand, such as for plastics and lubricants offsetting less from private vehicles. Aviation demand will grow.
The U.S. is supremely well positioned for these long term trends. Production costs are falling, and the short-cycle nature of shale (see The Short Cycle Advantage of Shale) continues to attract capital at a time when 20 year investments in oil and gas projects are exceptionally hard to assess.
U.S. midstream energy infrastructure will remain vital to meeting the world’s growing demand for oil, gas and natural gas liquids, even while the multi-decade transition to non-fossil fuels is underway. The sector remains attractively valued after a strong couple of months, with distributable cash flow yields above 10%, substantially higher than REITs’ equivalent funds from operations yields of around 6%. From our vantage point, rising dividends are drawing in new investors.
SL Advisors is the sub-advisor to the Catalyst MLP & Infrastructure Fund. To learn more about the Fund, please click here.
SL Advisors is also the advisor to an ETF (USAIETF.com)
Important Disclosures
The information provided is for informational purposes only and investors should determine for themselves whether a particular service, security or product is suitable for their investment needs. The information contained herein is not complete, may not be current, is subject to change, and is subject to, and qualified in its entirety by, the more complete disclosures, risk factors and other terms that are contained in the disclosure, prospectus, and offering. Certain information herein has been obtained from third party sources and, although believed to be reliable, has not been independently verified and its accuracy or completeness cannot be guaranteed. No representation is made with respect to the accuracy, completeness or timeliness of this information. Nothing provided on this site constitutes tax advice. Individuals should seek the advice of their own tax advisor for specific information regarding tax consequences of investments. Investments in securities entail risk and are not suitable for all investors. This site is not a recommendation nor an offer to sell (or solicitation of an offer to buy) securities in the United States or in any other jurisdiction.
References to indexes and benchmarks are hypothetical illustrations of aggregate returns and do not reflect the performance of any actual investment. Investors cannot invest in an index and do not reflect the deduction of the advisor’s fees or other trading expenses. There can be no assurance that current investments will be profitable. Actual realized returns will depend on, among other factors, the value of assets and market conditions at the time of disposition, any related transaction costs, and the timing of the purchase. Indexes and benchmarks may not directly correlate or only partially relate to portfolios managed by SL Advisors as they have different underlying investments and may use different strategies or have different objectives than portfolios managed by SL Advisors (e.g. The Alerian index is a group MLP securities in the oil and gas industries. Portfolios may not include the same investments that are included in the Alerian Index. The S & P Index does not directly relate to investment strategies managed by SL Advisers.)
This site may contain forward-looking statements relating to the objectives, opportunities, and the future performance of the U.S. market generally. Forward-looking statements may be identified by the use of such words as; “believe,” “expect,” “anticipate,” “should,” “planned,” “estimated,” “potential” and other similar terms. Examples of forward-looking statements include, but are not limited to, estimates with respect to financial condition, results of operations, and success or lack of success of any particular investment strategy. All are subject to various factors, including, but not limited to general and local economic conditions, changing levels of competition within certain industries and markets, changes in interest rates, changes in legislation or regulation, and other economic, competitive, governmental, regulatory and technological factors affecting a portfolio’s operations that could cause actual results to differ materially from projected results. Such statements are forward-looking in nature and involves a number of known and unknown risks, uncertainties and other factors, and accordingly, actual results may differ materially from those reflected or contemplated in such forward-looking statements. Prospective investors are cautioned not to place undue reliance on any forward-looking statements or examples. None of SL Advisors LLC or any of its affiliates or principals nor any other individual or entity assumes any obligation to update any forward-looking statements as a result of new information, subsequent events or any other circumstances. All statements made herein speak only as of the date that they were made. r
Certain hyperlinks or referenced websites on the Site, if any, are for your convenience and forward you to third parties’ websites, which generally are recognized by their top level domain name. Any descriptions of, references to, or links to other products, publications or services does not constitute an endorsement, authorization, sponsorship by or affiliation with SL Advisors LLC with respect to any linked site or its sponsor, unless expressly stated by SL Advisors LLC. Any such information, products or sites have not necessarily been reviewed by SL Advisors LLC and are provided or maintained by third parties over whom SL Advisors LLC exercise no control. SL Advisors LLC expressly disclaim any responsibility for the content, the accuracy of the information, and/or quality of products or services provided by or advertised on these third-party sites.
All investment strategies have the potential for profit or loss. Different types of investments involve varying degrees of risk, and there can be no assurance that any specific investment will be suitable or profitable for a client’s investment portfolio.
Past performance of the American Energy Independence Index is not indicative of future returns.


Perhaps your natural gas projections are overly optimistic. California, the 5th largest economy in the world, has made major increases in solar and conservation while significantly cutting back the need for natural gas. In 2017, natural gas accounted for 98,315 GWh or a third of the state’s electricity supply. This it’s both in state and out of state sources. This is significantly less than 2014, where at 44.49% of supply, natural gas accounted for 132,157 GWh. Gas use dropped by one quarter in only 3 years. Solar electricity went up from 12,954 to 29,796GWh. Overall system demand dropped from 297,063 to 292,039 GWh. Hidden in that statistic is an incredibly large build out of behind the meter generation, estimated to be at 6.5GW. Many of these are large scale private or public multi megawatt installations. The Budweiser plant near Fairfield has 7 acres of solar. It’s typical to see large installations covering school and business parking lots all over Calufornia. Tesla and other companies recently started installing battery systems of 1 MWh or higher on site. A single Tesla system with 5 units has the same footprint as a walk in closet. Cal-ISO note lists storage as part of its daily presentation of energy data. In summation, at least for California’s extensive energy market, gas has significantly declined as part of the state energy mix. This decline will continue for up 6- 10 years, until it is at least less than 10% of the state’s energy mix as solar, wind, and battery sources rapidly grow along with out of state grid connected resources. Behind the meter solar, wind ( The Budweiser plant has two large wind turbines), and storage will also continue their rapid growth, along with further conservation efforts such as the transition to LED lighting, which increases energy resilience and lessens average demand on the grid. The main source of energy growth will be in EV charging. Again, however, in both private and the public sector, solar and other renewables will take that up in site. Just an observation, but nearly every large installation of 300 KW or higher that I ‘ve seen around the SF Bay Area has EV charging. Individual homeowners often purchase solar as in house demand electricity increases. I also note that solar is making huge inroads in developing nations, especially in Africa as it doesn’t require large investments in infrastructure as centralized plants do. The term “stranded resources” will be much more prevalent in the near future than you think. https://www.energy.ca.gov/almanac/electricity_data/system_power/2014_total_system_power.html http://cleanleap.com/africa-pv-market-grow-10-2023