Here Comes The Sun: The Bright Future of Oil and Gas
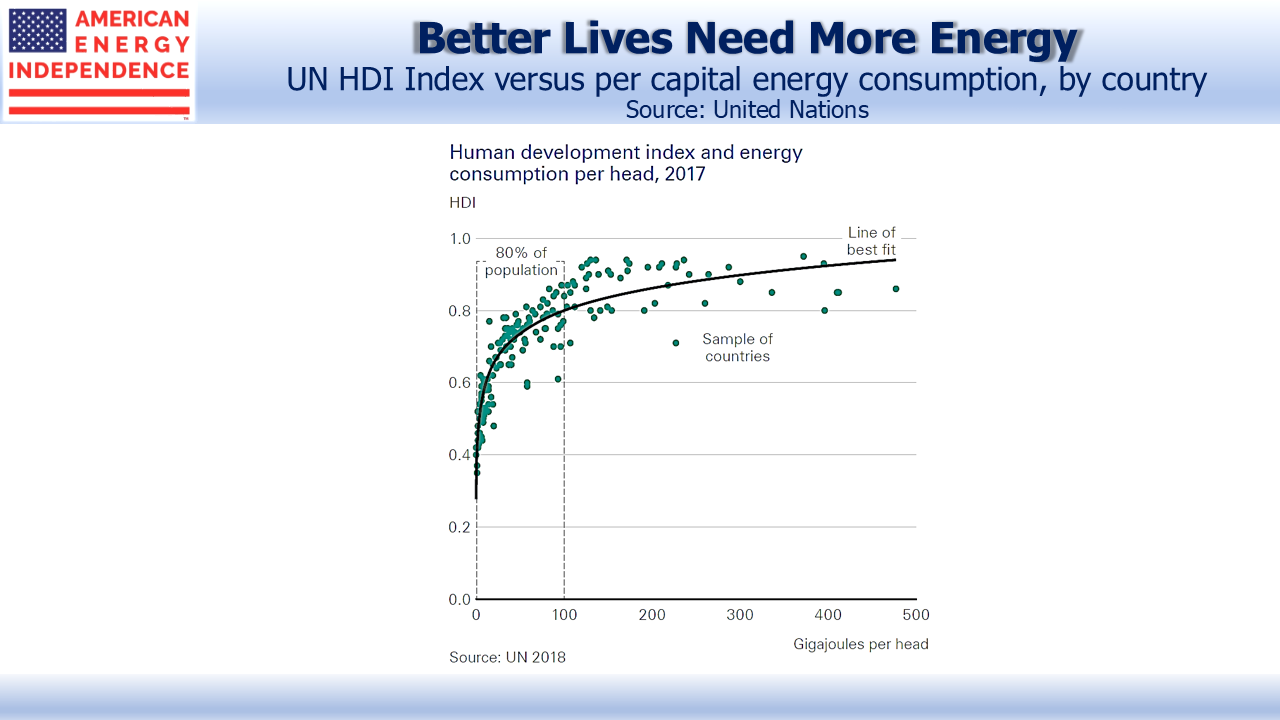
The United Nations Human Development Index (HDI) combines life expectancy, education and income to provide a more complete picture of well-being than simply considering GDP per capita. If one chart can illustrate the global challenge of combatting climate change, it might be the scatterplot below.
HDI is inextricably linked to energy consumption. 100 Gigajoules (GJ) per head is approximately where improvements in HDI begin to flatten out. 80% of the world’s population lives below this level, and presumably aspires to it. Much of the developing world is in this category. The UN recently recommended the adoption of policies to limit global warming. The Green New Deal went further, with highly impractical solutions (see The Green Bovine Dream).
The world wants more energy and reduced emissions. The 2019 BP Energy Outlook acknowledges these conflicting goals. Its base case (called Evolving Transition) predicts that by 2040 two thirds of the world’s population will still be under the 100 GJ threshold, while CO2 emissions will have grown. This compromise will satisfy few, and it’s their central forecast.
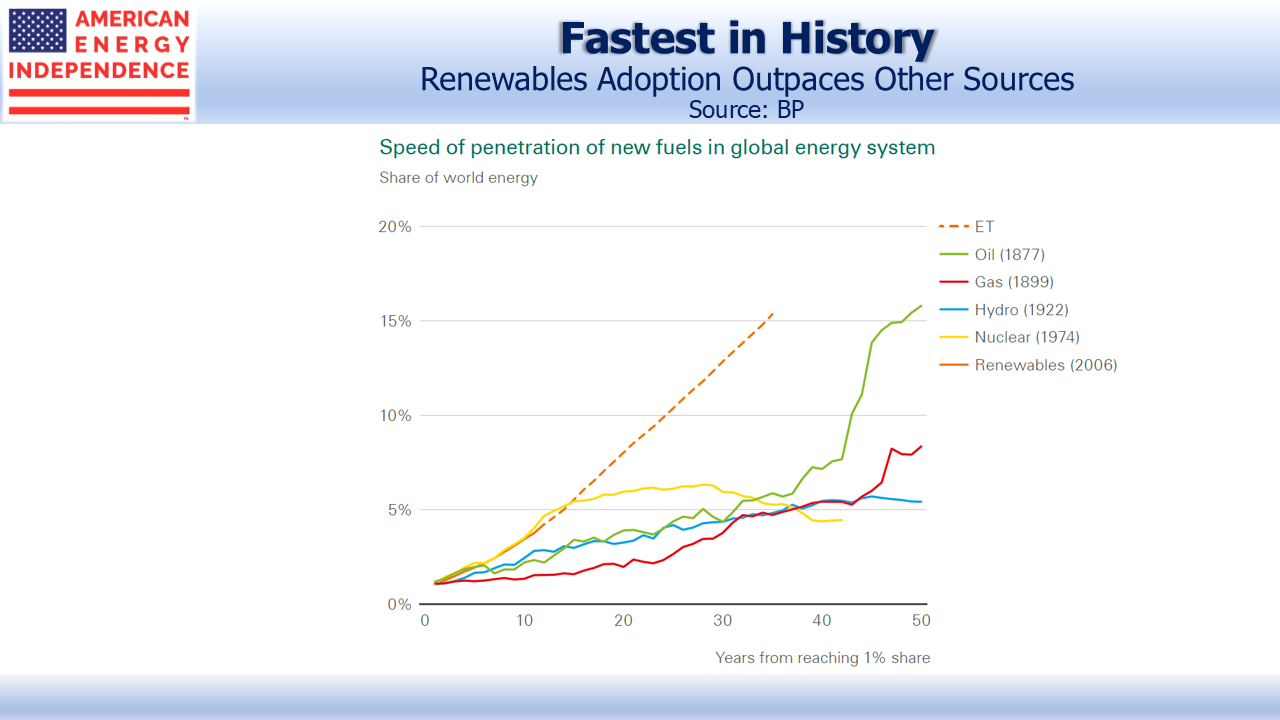
The world relies on fossil fuels for 80% of its energy. Critics will claim BP sees their continued dominance because their entire business locates, extracts, processes and sells them. But BP’s outlook forecasts a 20 year penetration rate for renewables of 15%, around triple that experienced historically by oil, gas, hydroelectric or nuclear power as their use ramped up.
BP’s report includes many interesting conclusions out to 2040:
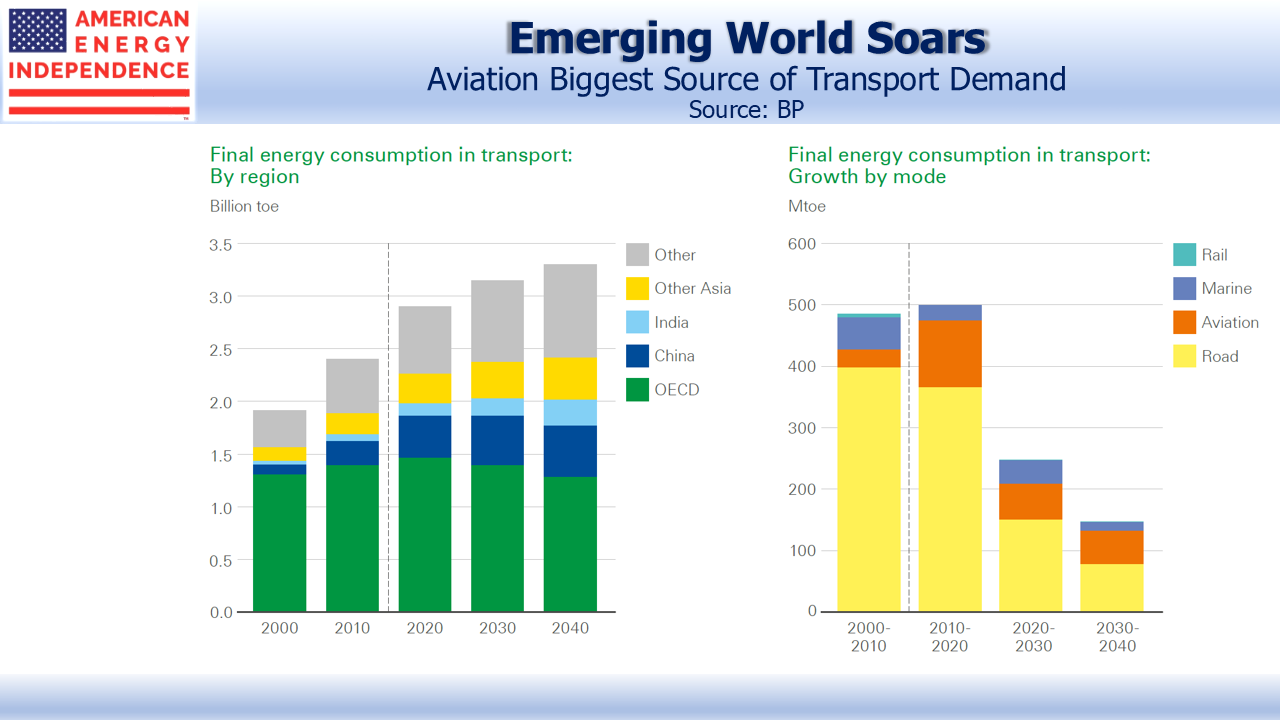
- Global energy consumption for road use will fall
- Aviation energy use will rise
- Developing world energy use will rise sharply, led by China and India
- Electric vehicles will represent 15% of the global fleet and 24% of vehicle/kms driven
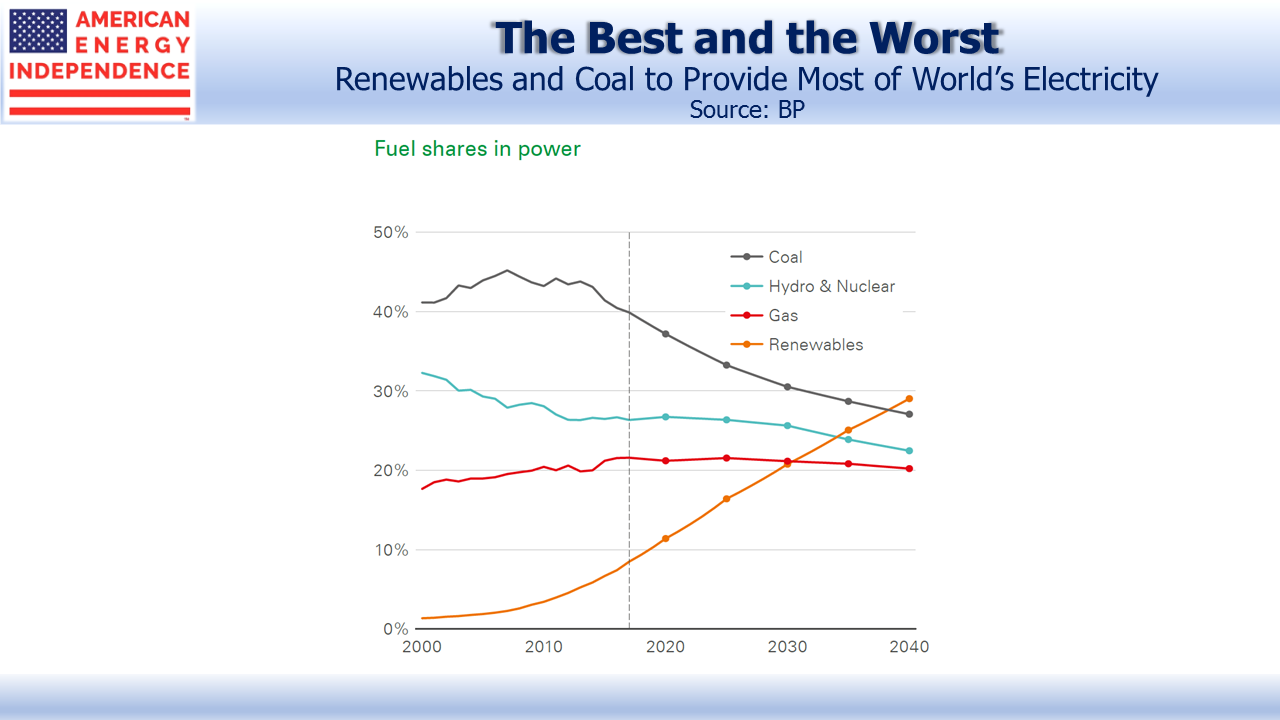
- Renewables will be the biggest source of electricity generation
- Coal will be #2, above 25%, because of continued increasing energy demand
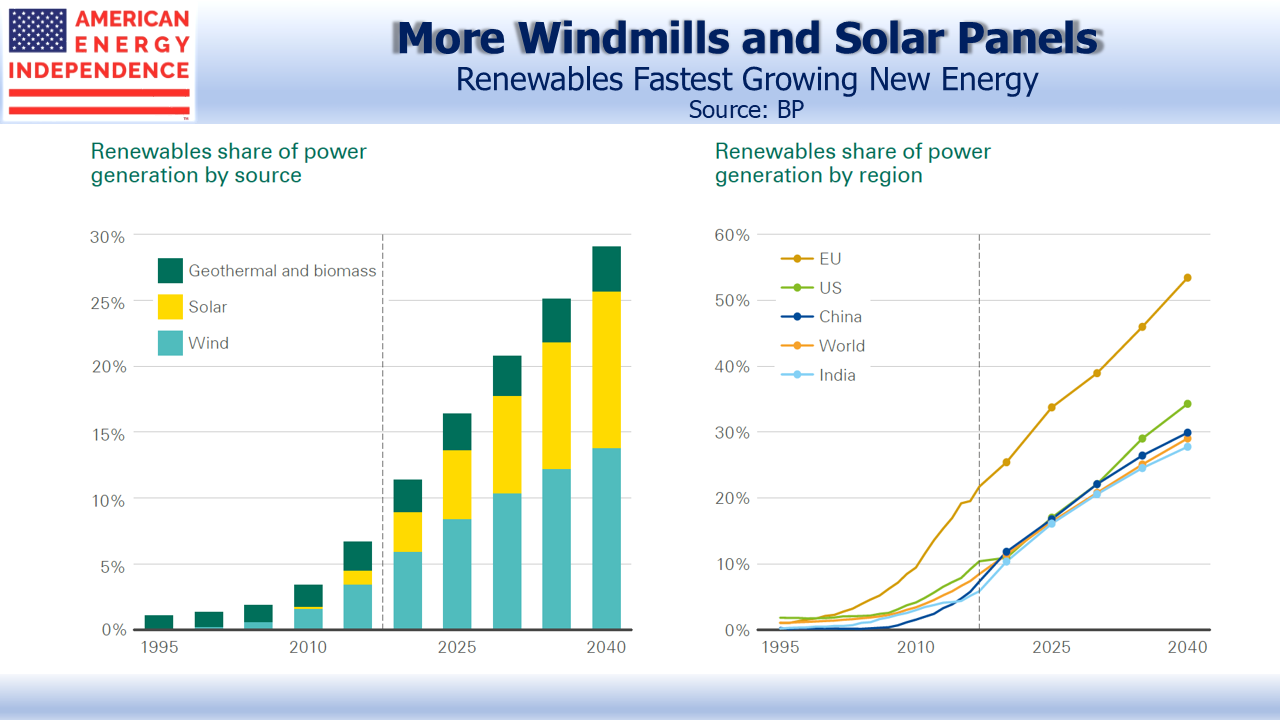
- 53% of EU power supply will be from renewables
The report considers other scenarios, including public policies that accelerate the move away from fossil fuels. If this led to a sharp drop in crude demand, the report speculates that low-cost oil producers might react by ramping up production to avoid having stranded assets. It’s thought-provoking — sell now or miss your opportunity. Such a price collapse would stimulate demand, slowing the energy transition.
Returning to the base case, renewables will gain market share in developing countries faster than in the OECD. It may surprise to consider rising energy demand lifting renewables penetration. But energy use is capital-intensive.
Today’s gasoline-burning automobiles last over ten years; power plants can run for 30 or more, and energy inefficient buildings can have many decades of useful life. It’s hard for a new solar farm to compete on economics with an existing natural gas burning power plant.
OECD energy consumption looks to be flat, as population growth is offset by efficiencies. This means renewable infrastructure is replacing something older, and wholesale decommissioning of assets with years of useful life left is an extreme, unlikely solution. By contrast, growing energy demand in emerging economies allows renewables to gain market share. Rising living standards in developing countries will reduce bus use in favor of private cars, hence the jump in vehicle/kms and, most likely, epic traffic jams.
Overall, the report’s central forecast for a substantial increase in renewables and in electric vehicles should be welcomed by those environmental activists who acknowledge the enormous challenge in such an energy transformation. BP’s conclusions are broadly echoed by other long range forecasts, including those from the U.S. Energy Information Administration, the International Energy Agency, Exxon Mobil, IHS Markit and CNPC Economics & Technology Research Institute. This is not a radical outlook.
Nonetheless, natural gas demand is expected to grow at 1.7% annually. Crude oil demand growth of 0.3% reflects rising non-combusted demand, such as for plastics and lubricants offsetting less from private vehicles. Aviation demand will grow.
The U.S. is supremely well positioned for these long term trends. Production costs are falling, and the short-cycle nature of shale (see The Short Cycle Advantage of Shale) continues to attract capital at a time when 20 year investments in oil and gas projects are exceptionally hard to assess.
U.S. midstream energy infrastructure will remain vital to meeting the world’s growing demand for oil, gas and natural gas liquids, even while the multi-decade transition to non-fossil fuels is underway. The sector remains attractively valued after a strong couple of months, with distributable cash flow yields above 10%, substantially higher than REITs’ equivalent funds from operations yields of around 6%. From our vantage point, rising dividends are drawing in new investors.
SL Advisors is the sub-advisor to the Catalyst MLP & Infrastructure Fund. To learn more about the Fund, please click here.
SL Advisors is also the advisor to an ETF (USAIETF.com)
