Growing Without Paying For It
Investors in Master Limited Partnerships (MLPs) like their distributions to be reliable and, by comparison with other asset classes, generous. Investors in the General Partners (GPs) that control them hold a more discerning view on value creation. Last month we highlighted how Williams Companies (WMB) was giving its MLP investors in Williams Partners (WPZ) what they want (reliable, high distributions) while also meeting the different needs of WMB investors for total return (see Williams Satisfies Two Masters).
The slide below from a recent WMB investor presentation lays it out nicely. WMB has two sources of cashflow – LP distributions from WPZ (since it owns WPZ units) and Incentive Distribution Rights (IDR) related cashflows from their GP interest. These two items are expected to generate 1.2BN and $1BN respectively for WMB over the next twelve months.
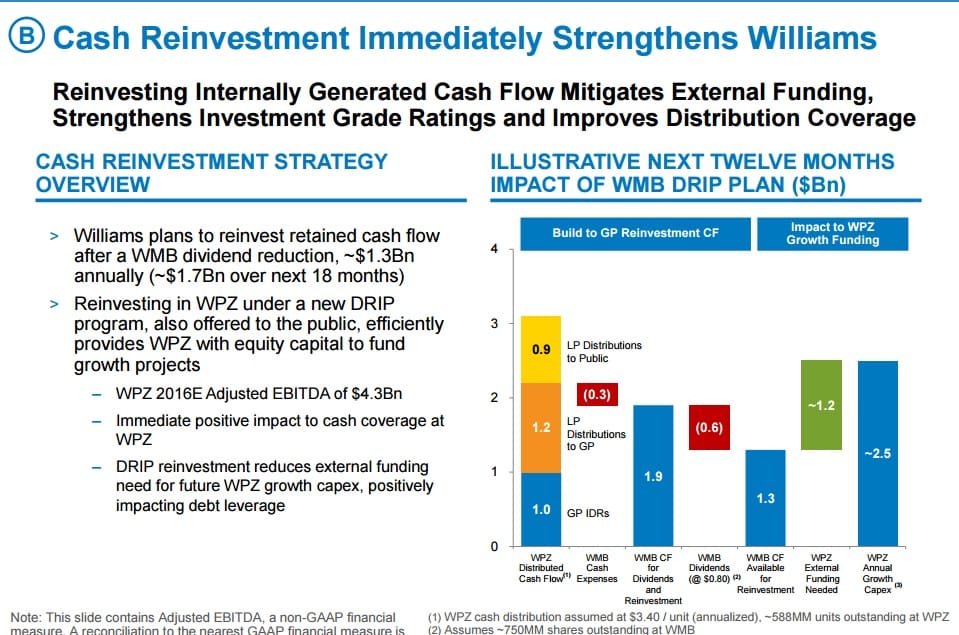
Move right across the bar chart and they’re planning to invest $1.3BN annually in new projects, by investing in new units of WPZ. These new WPZ units will generate additional IDRs through WMB’s GP interest. Working through the numbers, WPZ will supplement the $1.3BN it receives for selling new units to WMB with $1.2BN in debt, giving it $2.5BN to invest in new projects.
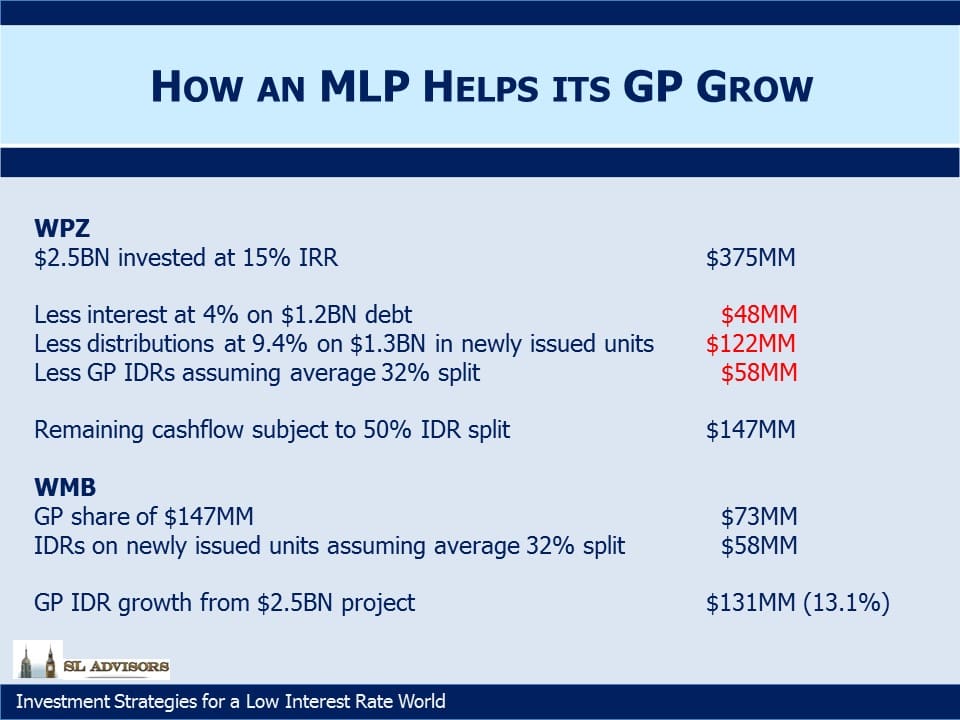
We know from other regulated projects that WPZ’s minimum IRR target is 15% on invested capital. The table below shows how this cashflow will divide up. WMB receives on average 32% of WPZ cashflows (i.e. the $1BN GP take is 32% of the $3.1BN total WPZ Distributed Cash Flow, the left-most bar on the chart). So WMB should expect 32% of the project’s cashflows and WPZ LP unitholders 68% up to a 9.4% return on the LP units (the current yield on WPZ). Thereafter, since the GP is at the 50% level on IDRs, the excess cashflow is split equally.
The total IDR take for WMB from the $2.5BN WPZ capital outlay is $131MM, representing a 13.1% growth rate on its current $1BN GP IDR receipts. WMB can if it chooses sell the $1.3BN in WPZ LP units acquired into the open market at a time of its choosing, thus winding up with no net cash outlay in exchange for this growth.
So what’s it worth? The LP cashflows are pretty straightforward. $1.2BN in WPZ distributions less the $300MM in cash operating costs leaves $900MM, valued at the market yield on WPZ units of 9.4% gives $9.6BN.
WMB’s market cap is $22.4BN, so the GP stake is being valued at $12.8BN ($22.4BN – $9.6BN), or 11.3X next year’s cashflow. This looks cheap compared to other transactions. For example, Marathon (MPL) acquired MarkWest last year at an implied GP multiple of more than twice this, according to figures from Wells Fargo. And our analysis here only assumes GP IDR growth from new projects; it gives no credit to growth from WPZ’s substantial existing asset base. So we think the 13.1% growth rate on the GP IDRs is conservative. In effect, WMB can grow its GP IDR-derived cashflow without having to pay for it.
We think on this basis that WMB is undervalued.
We are invested in WMB.

Important Disclosures
The information provided is for informational purposes only and investors should determine for themselves whether a particular service, security or product is suitable for their investment needs. The information contained herein is not complete, may not be current, is subject to change, and is subject to, and qualified in its entirety by, the more complete disclosures, risk factors and other terms that are contained in the disclosure, prospectus, and offering. Certain information herein has been obtained from third party sources and, although believed to be reliable, has not been independently verified and its accuracy or completeness cannot be guaranteed. No representation is made with respect to the accuracy, completeness or timeliness of this information. Nothing provided on this site constitutes tax advice. Individuals should seek the advice of their own tax advisor for specific information regarding tax consequences of investments. Investments in securities entail risk and are not suitable for all investors. This site is not a recommendation nor an offer to sell (or solicitation of an offer to buy) securities in the United States or in any other jurisdiction.
References to indexes and benchmarks are hypothetical illustrations of aggregate returns and do not reflect the performance of any actual investment. Investors cannot invest in an index and do not reflect the deduction of the advisor’s fees or other trading expenses. There can be no assurance that current investments will be profitable. Actual realized returns will depend on, among other factors, the value of assets and market conditions at the time of disposition, any related transaction costs, and the timing of the purchase. Indexes and benchmarks may not directly correlate or only partially relate to portfolios managed by SL Advisors as they have different underlying investments and may use different strategies or have different objectives than portfolios managed by SL Advisors (e.g. The Alerian index is a group MLP securities in the oil and gas industries. Portfolios may not include the same investments that are included in the Alerian Index. The S & P Index does not directly relate to investment strategies managed by SL Advisers.)
This site may contain forward-looking statements relating to the objectives, opportunities, and the future performance of the U.S. market generally. Forward-looking statements may be identified by the use of such words as; “believe,” “expect,” “anticipate,” “should,” “planned,” “estimated,” “potential” and other similar terms. Examples of forward-looking statements include, but are not limited to, estimates with respect to financial condition, results of operations, and success or lack of success of any particular investment strategy. All are subject to various factors, including, but not limited to general and local economic conditions, changing levels of competition within certain industries and markets, changes in interest rates, changes in legislation or regulation, and other economic, competitive, governmental, regulatory and technological factors affecting a portfolio’s operations that could cause actual results to differ materially from projected results. Such statements are forward-looking in nature and involves a number of known and unknown risks, uncertainties and other factors, and accordingly, actual results may differ materially from those reflected or contemplated in such forward-looking statements. Prospective investors are cautioned not to place undue reliance on any forward-looking statements or examples. None of SL Advisors LLC or any of its affiliates or principals nor any other individual or entity assumes any obligation to update any forward-looking statements as a result of new information, subsequent events or any other circumstances. All statements made herein speak only as of the date that they were made. r
Certain hyperlinks or referenced websites on the Site, if any, are for your convenience and forward you to third parties’ websites, which generally are recognized by their top level domain name. Any descriptions of, references to, or links to other products, publications or services does not constitute an endorsement, authorization, sponsorship by or affiliation with SL Advisors LLC with respect to any linked site or its sponsor, unless expressly stated by SL Advisors LLC. Any such information, products or sites have not necessarily been reviewed by SL Advisors LLC and are provided or maintained by third parties over whom SL Advisors LLC exercise no control. SL Advisors LLC expressly disclaim any responsibility for the content, the accuracy of the information, and/or quality of products or services provided by or advertised on these third-party sites.
All investment strategies have the potential for profit or loss. Different types of investments involve varying degrees of risk, and there can be no assurance that any specific investment will be suitable or profitable for a client’s investment portfolio.
Past performance of the American Energy Independence Index is not indicative of future returns.
Leave a Reply
Want to join the discussion?Feel free to contribute!