Canadian Pipelines Lead The Way
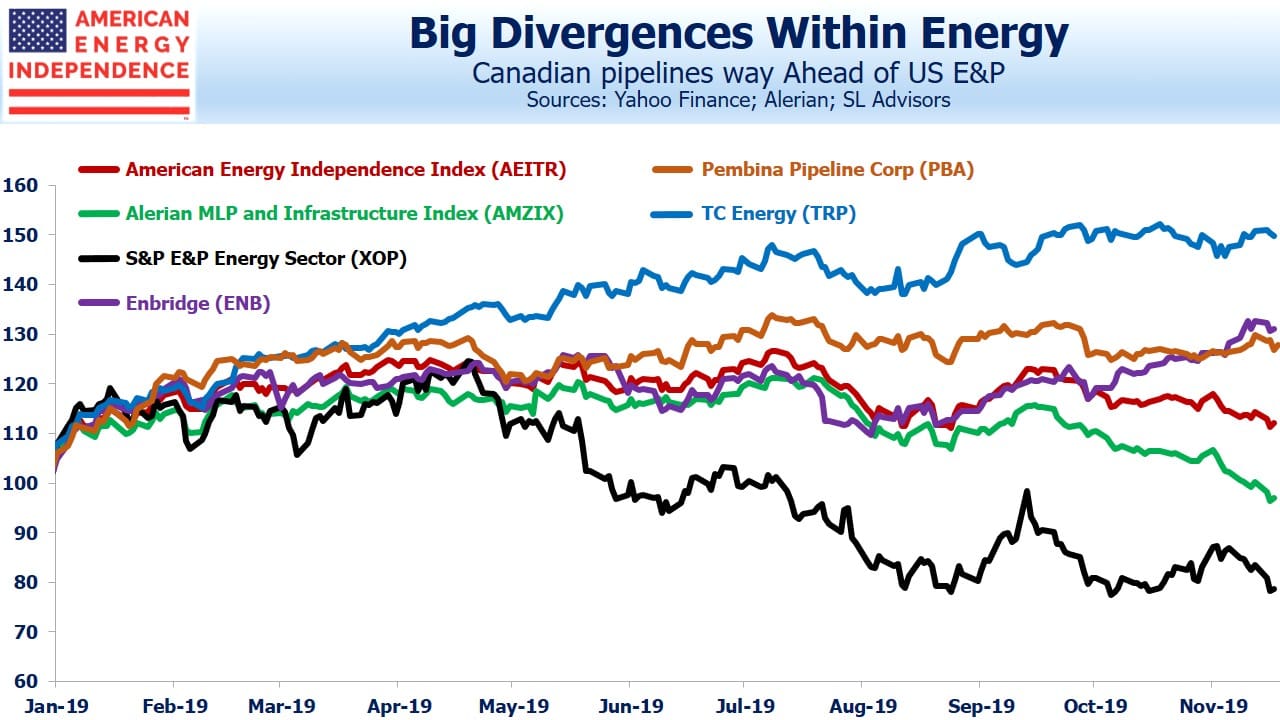
Sentiment among energy investors remains poor. The S&P E&P ETF (XOP) is -21% for the year. Energy has sunk to 4% of the S&P500. The Alerian MLP Infrastructure index (AMZIX) is -3% YTD and reached a low of 44% off its August 2014 high last week. This contrasts with the S&P500, which is +26% for the year. MLP tax loss selling has caused further downward pressure, since so many investors have realized gains in other sectors to pair against energy losses.
Although energy has been weak, wide performance divergences exist. Midstream energy infrastructure has done far better than the E&P companies that are its principal customers. Within that, pipeline corporations have done better than MLPs, which continue to suffer from erosion of interest among their traditional income-seeking investor base. Canadian corporations are among the best performers. TC Energy (TRP, formerly Transcanada), is +50% for the year including dividends, even handily beating the S&P500 with its 26% gain. Few investors in midstream energy infrastructure realize how well TRP has performed, unless they own it. Enbridge (ENB), North America’s biggest midstream energy infrastructure company and also Canadian, is +31%. Pembina (PBA), a less well known Canadian pipeline company, is +27%.
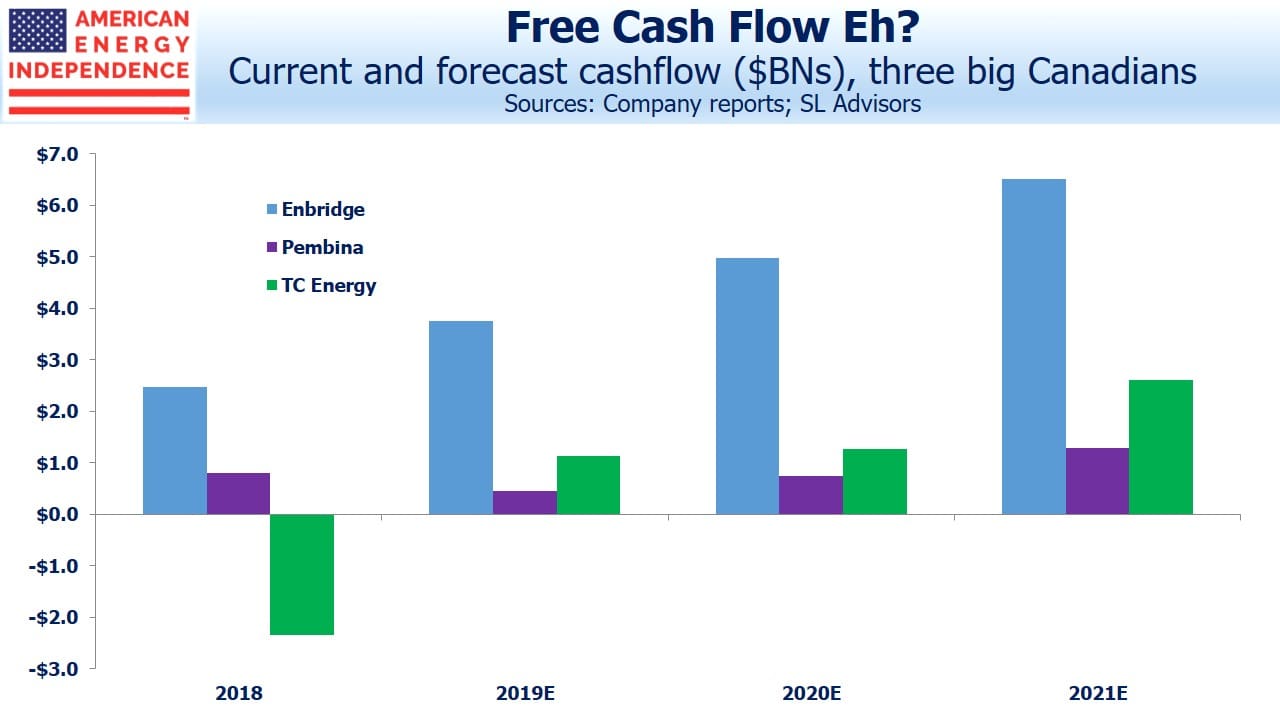
Like their banks, Canadians pipeline companies tend to be run more conservatively. Over the past five years they’ve also set themselves apart from the rest of the sector. Their U.S. cousins would do well to adopt some of their disciplined capital allocation and prudent management practices. These three companies represent 55% of the 2019 Free Cash Flow (FCF) we project for the industry. Their performance supports the case that growing FCF leads to a higher stock price (see The Coming Pipeline Cash Gusher).
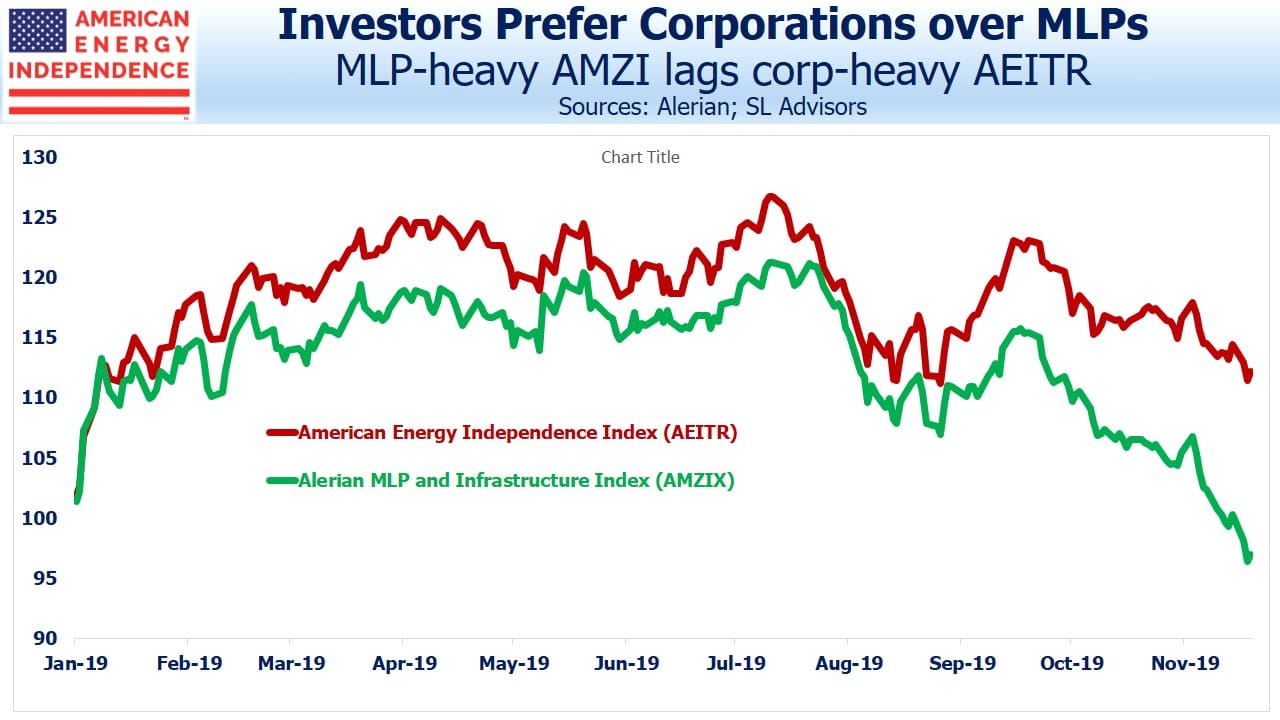
The Alerian MLP ETF (AMLP) is a rich source of opprobrium on this blog, because of its flawed tax structure (see MLP Funds Made for Uncle Sam). It does retain one useful feature though, in that it’s relatively easy to short. Big pipeline companies are under-represented in the Alerian index, because most of them are not MLPs. So AMZIX is stuffed full of what investors don’t want. AMLP follows AMZIX, albeit from a distance. Because of its structure, since inception performance of 1.6% is only half its benchmark of 3.2%. AMLP is the worst performing passive index fund in history. This year AMZIX is 15% behind the investable American Energy Independence Index (AEITR), which is 80% corporations, including the abovementioned Canadians.
Comparing the two indices, one can see the recent sharp divergence in performance, which was probably exacerbated by tax-loss selling of MLPs. Short AMLP and long an AEITR-linked security has been a profitable trade. AMLP’s tax drag hurts in a rising market, where its flawed structure impedes its ability to appreciate with its underlying portfolio. But recent weakness has been led by the MLPs that predominate in AMLP, highlighting the importance of being in the right kinds of companies in this sector. Investors are favoring well-run Canadian pipeline corporations and shunning MLPs.
The Canadian pipelines offer powerful evidence that it’s possible to generate steady returns in this business. Those U.S. companies that perform well over the next couple of years will do so by adopting more of their culture from north of the border. Assuming FCF grows as we expect across the sector, performance of the Canadian stocks suggests positive returns should follow.
We are invested in ENB, PBA and TRP. We are short AMLP
We manage an ETF which tracks the American Energy Independence Index
Important Disclosures
The information provided is for informational purposes only and investors should determine for themselves whether a particular service, security or product is suitable for their investment needs. The information contained herein is not complete, may not be current, is subject to change, and is subject to, and qualified in its entirety by, the more complete disclosures, risk factors and other terms that are contained in the disclosure, prospectus, and offering. Certain information herein has been obtained from third party sources and, although believed to be reliable, has not been independently verified and its accuracy or completeness cannot be guaranteed. No representation is made with respect to the accuracy, completeness or timeliness of this information. Nothing provided on this site constitutes tax advice. Individuals should seek the advice of their own tax advisor for specific information regarding tax consequences of investments. Investments in securities entail risk and are not suitable for all investors. This site is not a recommendation nor an offer to sell (or solicitation of an offer to buy) securities in the United States or in any other jurisdiction.
References to indexes and benchmarks are hypothetical illustrations of aggregate returns and do not reflect the performance of any actual investment. Investors cannot invest in an index and do not reflect the deduction of the advisor’s fees or other trading expenses. There can be no assurance that current investments will be profitable. Actual realized returns will depend on, among other factors, the value of assets and market conditions at the time of disposition, any related transaction costs, and the timing of the purchase. Indexes and benchmarks may not directly correlate or only partially relate to portfolios managed by SL Advisors as they have different underlying investments and may use different strategies or have different objectives than portfolios managed by SL Advisors (e.g. The Alerian index is a group MLP securities in the oil and gas industries. Portfolios may not include the same investments that are included in the Alerian Index. The S & P Index does not directly relate to investment strategies managed by SL Advisers.)
This site may contain forward-looking statements relating to the objectives, opportunities, and the future performance of the U.S. market generally. Forward-looking statements may be identified by the use of such words as; “believe,” “expect,” “anticipate,” “should,” “planned,” “estimated,” “potential” and other similar terms. Examples of forward-looking statements include, but are not limited to, estimates with respect to financial condition, results of operations, and success or lack of success of any particular investment strategy. All are subject to various factors, including, but not limited to general and local economic conditions, changing levels of competition within certain industries and markets, changes in interest rates, changes in legislation or regulation, and other economic, competitive, governmental, regulatory and technological factors affecting a portfolio’s operations that could cause actual results to differ materially from projected results. Such statements are forward-looking in nature and involves a number of known and unknown risks, uncertainties and other factors, and accordingly, actual results may differ materially from those reflected or contemplated in such forward-looking statements. Prospective investors are cautioned not to place undue reliance on any forward-looking statements or examples. None of SL Advisors LLC or any of its affiliates or principals nor any other individual or entity assumes any obligation to update any forward-looking statements as a result of new information, subsequent events or any other circumstances. All statements made herein speak only as of the date that they were made. r
Certain hyperlinks or referenced websites on the Site, if any, are for your convenience and forward you to third parties’ websites, which generally are recognized by their top level domain name. Any descriptions of, references to, or links to other products, publications or services does not constitute an endorsement, authorization, sponsorship by or affiliation with SL Advisors LLC with respect to any linked site or its sponsor, unless expressly stated by SL Advisors LLC. Any such information, products or sites have not necessarily been reviewed by SL Advisors LLC and are provided or maintained by third parties over whom SL Advisors LLC exercise no control. SL Advisors LLC expressly disclaim any responsibility for the content, the accuracy of the information, and/or quality of products or services provided by or advertised on these third-party sites.
All investment strategies have the potential for profit or loss. Different types of investments involve varying degrees of risk, and there can be no assurance that any specific investment will be suitable or profitable for a client’s investment portfolio.
Past performance of the American Energy Independence Index is not indicative of future returns.


Leave a Reply
Want to join the discussion?Feel free to contribute!