Bond Market Looks Past Fed
Last week Fed chairman Jay Powell walked back his earlier, clumsy comments which had implied several additional rate hikes in 2019. His words at the press conference following their December 19 meeting were poorly considered, “Maybe we’ll be raising our estimate of the neutral rate and we’ll just go to that, or maybe we’ll keep our neutral rate here and then go one or two rate increases beyond it.” That sounded as if rates could move 1% higher.
Many analysts focus on the “blue dots”, a graphical representation of individual FOMC members’ rate forecasts. The Fed’s been publishing these for seven years now, and the increased transparency of which they are part is most welcome. But it’s important not to confuse what the FOMC says they’ll do with what actually happens. The bond market is far more accurate at forecasting Fed policy than the Fed itself.
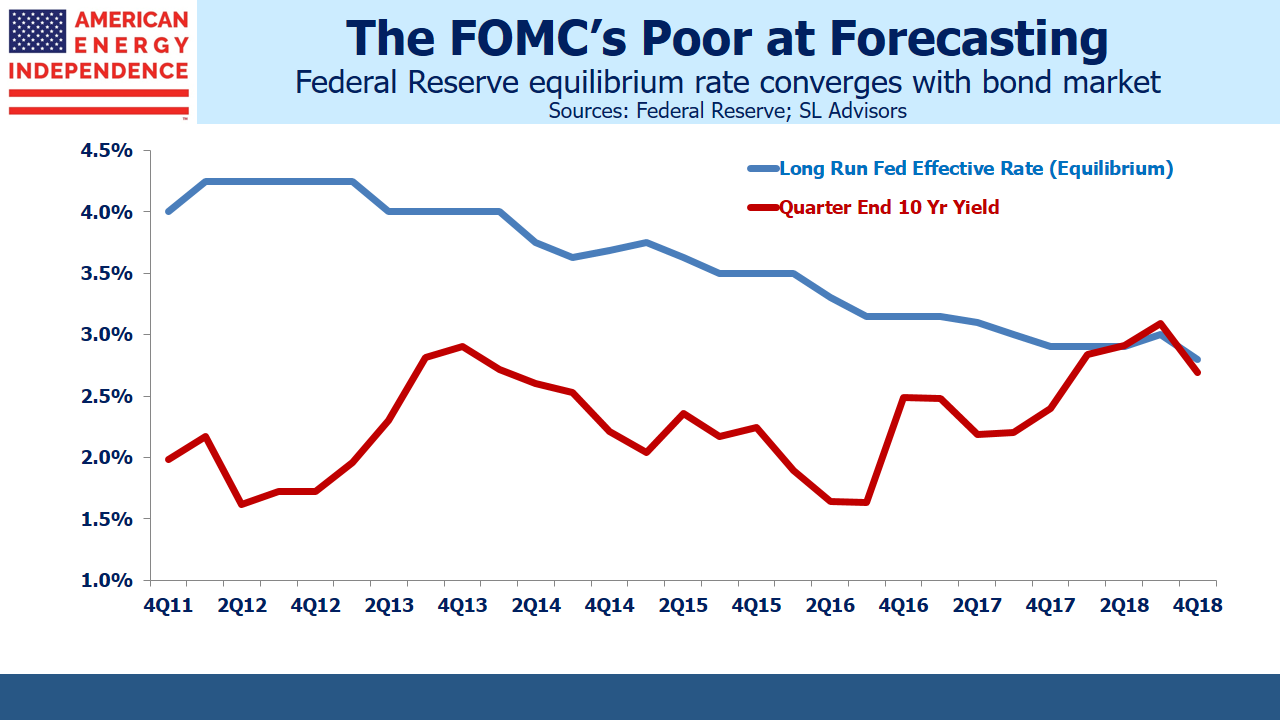
The long-run equilibrium rate, or neutral Fed funds rate, has been sliding lower for years. Bond investors never believed that the Fed would eventually increase short term rates to 4.25% back in 2012 when the first blue dots appeared. The yield on ten year treasury notes represents the average short term rate likely to prevail over the next decade, and it hasn’t been above 4% since the 2008 financial crisis. The market has maintained its disbelief, and FOMC rate forecasts have been steadily revised down to converge.
December was a particularly bad month for equity investors everywhere, and Powell’s comments provided another reason for sellers to act. Press reports suggested that the softening global growth and market turmoil weren’t factors in their deliberations.
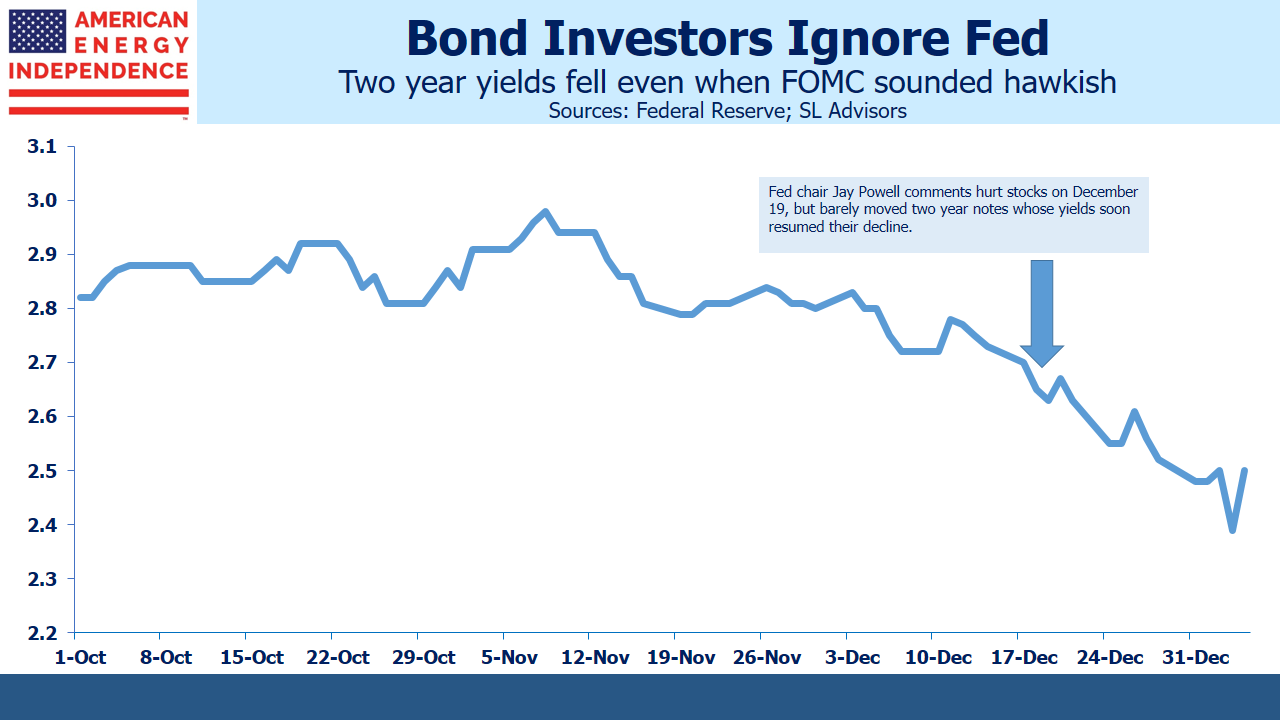
However, two year treasury yields, a good indicator of market expectations for near term Fed policy, barely rose on the day of the press conference before resuming their downward trend. So the Fed chair bowed to the inevitable, and moderated his public position to reflect what the bond market already knew, “We’re listening carefully with – sensitivity to the message that the markets are sending and we’ll be taking those downside risks into account as we make policy going forward,”
The point here is that equity investors seem to be more scared of the Fed than bond investors. Fixed income markets never priced in Powell’s clumsy comments, even while stocks dropped at the time. The growing history of the blue dots reveal a welcome insight into FOMC member thinking.
Years ago, when Alan Greenspan personified the mysterious Fed chairman as oracle, speaking but rarely providing much information, markets believed the Fed knew more than anyone. Their superior access to data on current economic performance meant that Fed comments on growth were likely informed by data unavailable to others. The truth is that JPMorgan Chase and Amazon probably have better real-time data on the U.S. consumer than the Fed.
It’s helpful to know what policymakers expect to do, which is why the blue dots, or “dot plot” are interesting. Although Jay Powell has argued that they’re individual forecasts and not meant to represent a consensus, it’s hard to interpret them any other way. The median of fourteen individual estimates clearly reflects group consensus, no matter how much he may try to downplay it.
What we’ve learned over the seven years of blue dots is that the Fed’s consensus is terrible as a forecast. The bond market is better at predicting Fed policy than the Fed. With the two year treasury yield at 2.5%, the market is expecting little change in Fed policy this year. And with ten year yields at 2.7%, below the FOMC’s equilibrium rate, the peak in the rate cycle isn’t far away.
With the Fed likely on hold for a while, the Equity Risk Premium continues to show stocks are cheap (see Stocks Are the Cheapest Since 2012). Energy Infrastructure, in spite of its strong start to the year, is still lower than where it was a year ago even while every financial metric (EBITDA, leverage, volumes) is improving.
Comments from Fed officials shouldn’t be confused with policy actions. Equities remain very attractive.
SL Advisors is the sub-advisor to the Catalyst MLP & Infrastructure Fund. To learn more about the Fund, please click here.
SL Advisors is also the advisor to an ETF (USAIETF.com).

