A Gassier World

/
BP’s 2024 Annual Outlook continues to navigate carefully the political minefield that faces any big energy company in making projections about energy consumption. They’ve simplified their scenarios – in 2022 Accelerated, Net Zero and New Momentum all sounded faintly hopeful and for the first two totally unrealistic. New Momentum was the scenario intended to present the way things are currently moving, but nonetheless sounded optimistic.
BP points out that these are projections not forecasts – the subtle difference intending to persuade progressives that they are bought into the energy transition even while they’re not making money from it. BP’s market cap of £75BN ($96BN) is the lowest in two years and back to where it was 25 years ago. They’ve lagged their peers by 50-75% over the past five years. The green strategy they adopted four years ago hasn’t excited their investors.
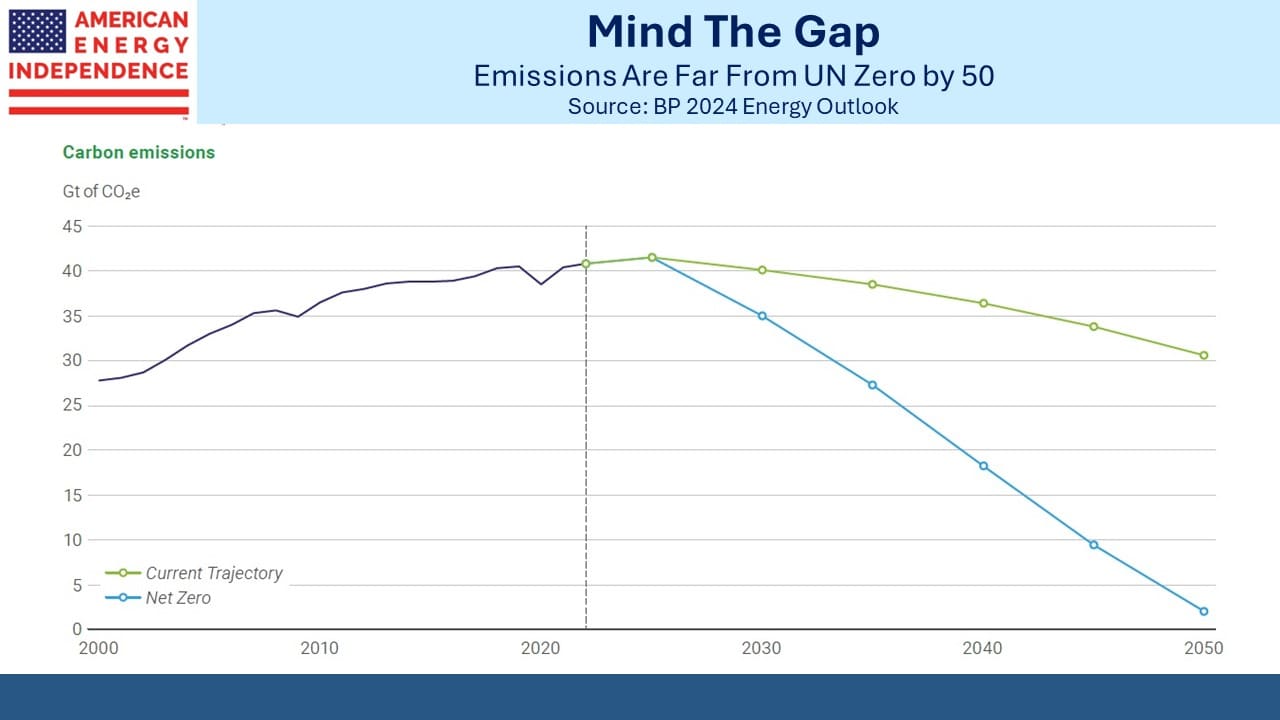
BP’s Annual Outlook now has two scenarios: Current Trajectory and Net Zero. They’re self-explanatory – one projects what’s likely to happen on current policies and the other overlays policies consistent with the UN IPCC’s Zero by 50 goal.
They are miles apart.
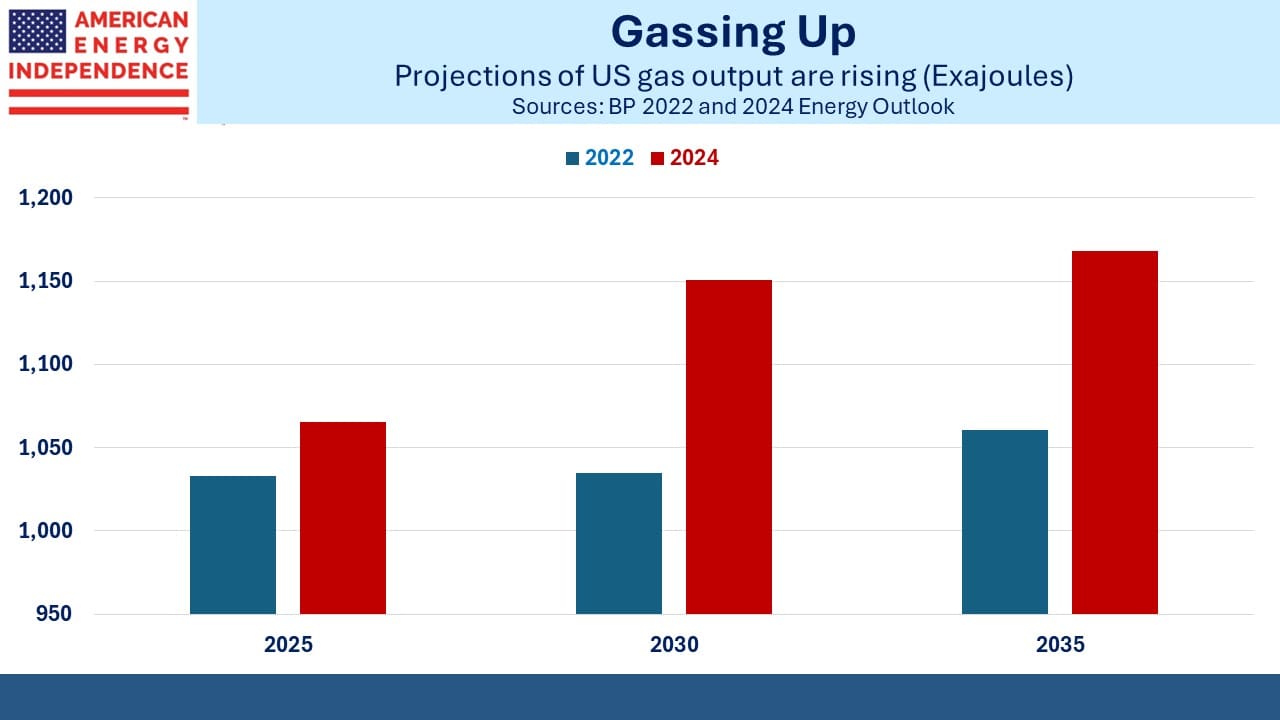
There are some interesting differences between the current path presented today versus what BP thought in 2022. US natural gas production by 2035 is now forecast to be 10% bigger than back then, at 1,168 Billion Cubic Meters (BCM), or about 113 Billion Cubic Feet per Day (BCF/D).
Global natural gas production is expected to grow, albeit less quickly, meaning the US share will grow to 25%.
Growing Asian demand for natural gas and the disruptions to Russian exports to Europe have caused LNG demand to grow at 8X the rate of natural gas overall.
Climate change forecasts are dominated by the interplay of emerging country GDP growth versus increased energy efficiency and decarbonization. The world has never experienced a decline in energy consumption as far back as meaningful records exist. BP’s Current Trajectory scenario now sees global energy consumption peaking around 2040.
Two years ago none of their scenarios contemplated reduced energy consumption. Even in Net Zero it was roughly flat.
Energy consumption grew at 1% pa over the past four years, slower than over the prior decade. But the pandemic was a big factor, and absent another global disruption it’s hard to envisage demand growth disappearing within the next decade or so.
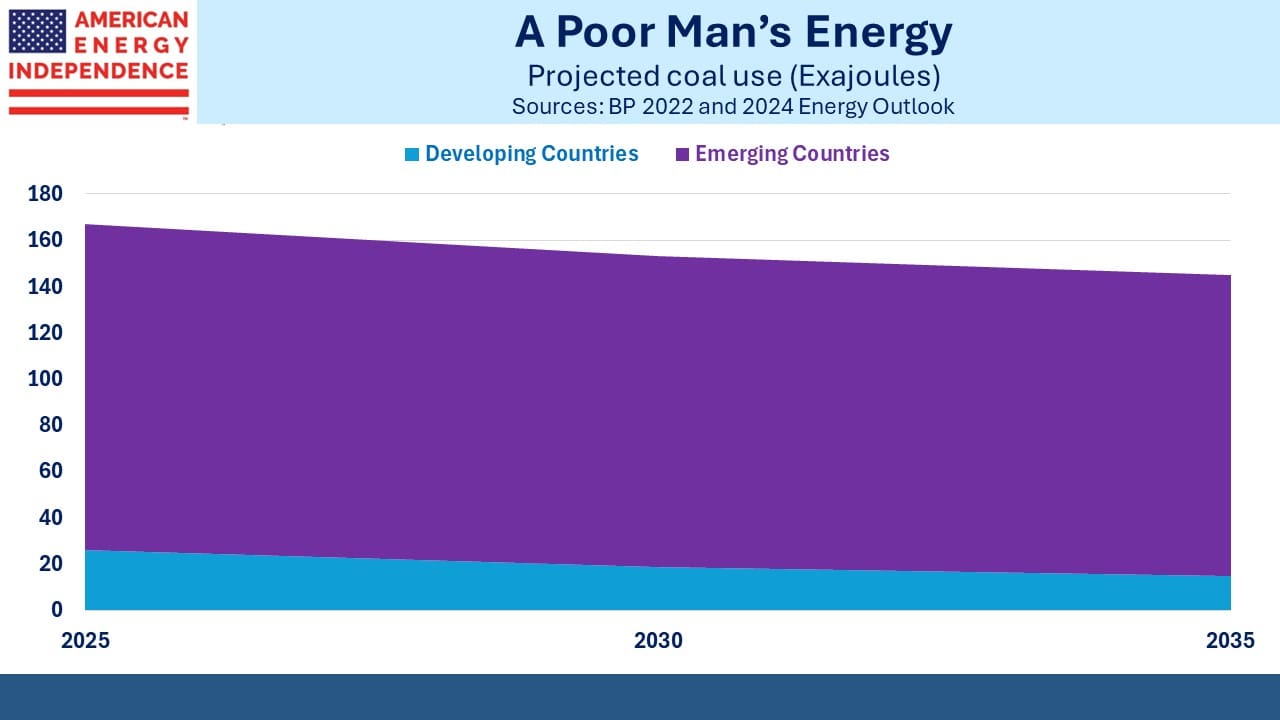
Coal is one sector where optimism about its demise continues to look premature. 84% of global production is in emerging economies, and because coal reserves are so widely distributed it is mostly consumed where it’s mined. Coal-to-gas switching for power generation remains the most effective way to reduce emissions. The US is helping by growing its LNG exports, despite the Administration’s efforts to impose constraints on new permits.
Nonetheless, the world is using more coal than ever. BP still projects consumption to decline, albeit from a higher level than a couple of years ago. Its use in developed countries is going to shrink by half over the next decade, which seems plausible. Developing countries are projected to peak within a couple of years. Two years ago BP thought the peak was happening right then. This most damaging fossil fuel consistently pushes back forecasts of its demise.
If coal use does drop it’ll be because increased natural gas production has been able to fill the gap.
Renewables growth is projected to be slower in developed countries than BP thought two years ago. Higher interest rates and the dismal investment returns on solar and wind are hurting. Across emerging economies, 2025 renewables output is now expected to be double what BP expected only two years ago, a remarkable shift. Projections for China have been revised lower, meaning their share across all developing countries will drop from around a half to 15% by 2035.
China’s energy policies still prioritize energy security over emissions reduction, a long term preparation for conflict over Taiwan. Nobody should confuse their solar and wind investments as anything but a push for energy independence, insulation from the western sanctions that will inevitably follow any conflict with their island neighbor.
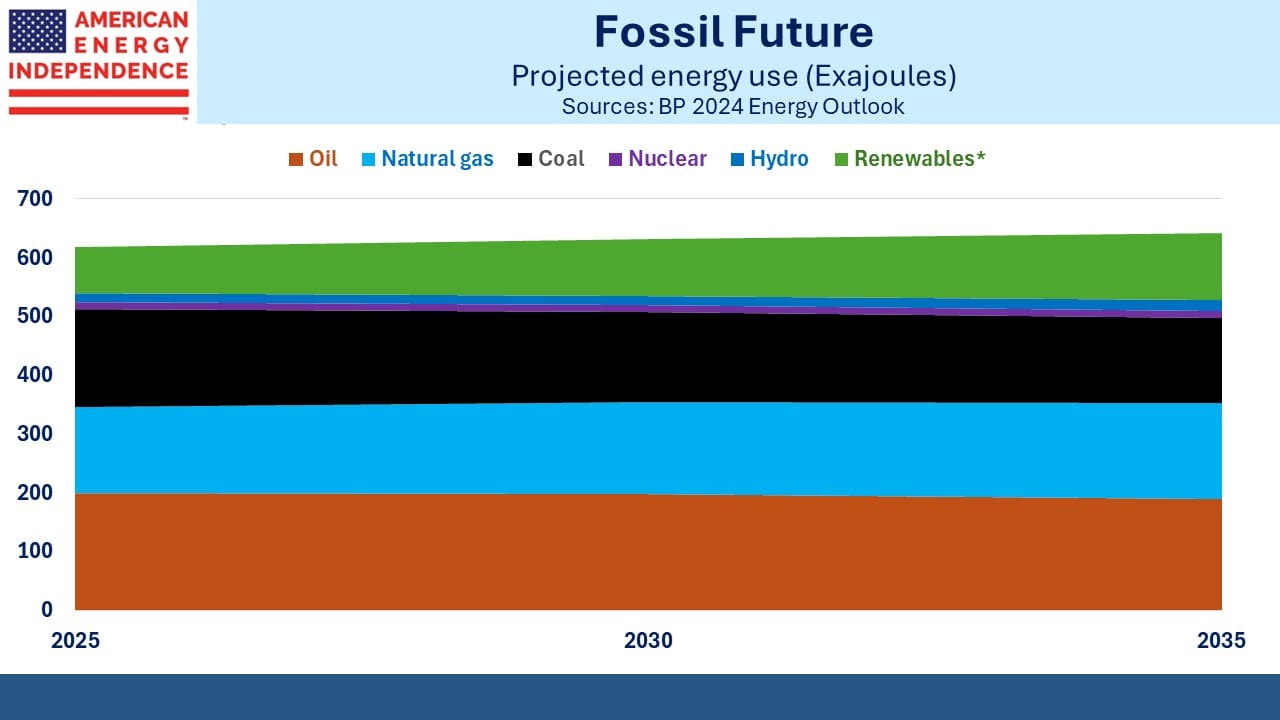
The bottom line is that traditional energy is going to dominate for the foreseeable future. Fossil fuels represent 84% of primary energy as calculated by BP, and they expect this share to be 77% by 2035. A couple of years ago their projection was 70%. Natural gas is the only fossil fuel projected to grow. It will eventually be the world’s favorite source of energy.
On my trip to Minneapolis last week, I had the opportunity to see long-time investor Scott Mundal. Scott grew up on a farm in South Dakota, and now runs his own investment business in Morris, MN. His life is a wonderful American success story illustrating what hard work and ability can achieve. We had a most enjoyable dinner.
We have three have funds that seek to profit from this environment:

Important Disclosures
The information provided is for informational purposes only and investors should determine for themselves whether a particular service, security or product is suitable for their investment needs. The information contained herein is not complete, may not be current, is subject to change, and is subject to, and qualified in its entirety by, the more complete disclosures, risk factors and other terms that are contained in the disclosure, prospectus, and offering. Certain information herein has been obtained from third party sources and, although believed to be reliable, has not been independently verified and its accuracy or completeness cannot be guaranteed. No representation is made with respect to the accuracy, completeness or timeliness of this information. Nothing provided on this site constitutes tax advice. Individuals should seek the advice of their own tax advisor for specific information regarding tax consequences of investments. Investments in securities entail risk and are not suitable for all investors. This site is not a recommendation nor an offer to sell (or solicitation of an offer to buy) securities in the United States or in any other jurisdiction.
References to indexes and benchmarks are hypothetical illustrations of aggregate returns and do not reflect the performance of any actual investment. Investors cannot invest in an index and do not reflect the deduction of the advisor’s fees or other trading expenses. There can be no assurance that current investments will be profitable. Actual realized returns will depend on, among other factors, the value of assets and market conditions at the time of disposition, any related transaction costs, and the timing of the purchase. Indexes and benchmarks may not directly correlate or only partially relate to portfolios managed by SL Advisors as they have different underlying investments and may use different strategies or have different objectives than portfolios managed by SL Advisors (e.g. The Alerian index is a group MLP securities in the oil and gas industries. Portfolios may not include the same investments that are included in the Alerian Index. The S & P Index does not directly relate to investment strategies managed by SL Advisers.)
This site may contain forward-looking statements relating to the objectives, opportunities, and the future performance of the U.S. market generally. Forward-looking statements may be identified by the use of such words as; “believe,” “expect,” “anticipate,” “should,” “planned,” “estimated,” “potential” and other similar terms. Examples of forward-looking statements include, but are not limited to, estimates with respect to financial condition, results of operations, and success or lack of success of any particular investment strategy. All are subject to various factors, including, but not limited to general and local economic conditions, changing levels of competition within certain industries and markets, changes in interest rates, changes in legislation or regulation, and other economic, competitive, governmental, regulatory and technological factors affecting a portfolio’s operations that could cause actual results to differ materially from projected results. Such statements are forward-looking in nature and involves a number of known and unknown risks, uncertainties and other factors, and accordingly, actual results may differ materially from those reflected or contemplated in such forward-looking statements. Prospective investors are cautioned not to place undue reliance on any forward-looking statements or examples. None of SL Advisors LLC or any of its affiliates or principals nor any other individual or entity assumes any obligation to update any forward-looking statements as a result of new information, subsequent events or any other circumstances. All statements made herein speak only as of the date that they were made. r
Certain hyperlinks or referenced websites on the Site, if any, are for your convenience and forward you to third parties’ websites, which generally are recognized by their top level domain name. Any descriptions of, references to, or links to other products, publications or services does not constitute an endorsement, authorization, sponsorship by or affiliation with SL Advisors LLC with respect to any linked site or its sponsor, unless expressly stated by SL Advisors LLC. Any such information, products or sites have not necessarily been reviewed by SL Advisors LLC and are provided or maintained by third parties over whom SL Advisors LLC exercise no control. SL Advisors LLC expressly disclaim any responsibility for the content, the accuracy of the information, and/or quality of products or services provided by or advertised on these third-party sites.
All investment strategies have the potential for profit or loss. Different types of investments involve varying degrees of risk, and there can be no assurance that any specific investment will be suitable or profitable for a client’s investment portfolio.
Past performance of the American Energy Independence Index is not indicative of future returns.


Leave a Reply
Want to join the discussion?Feel free to contribute!