
Will Gas Demand Boost Prices?


/
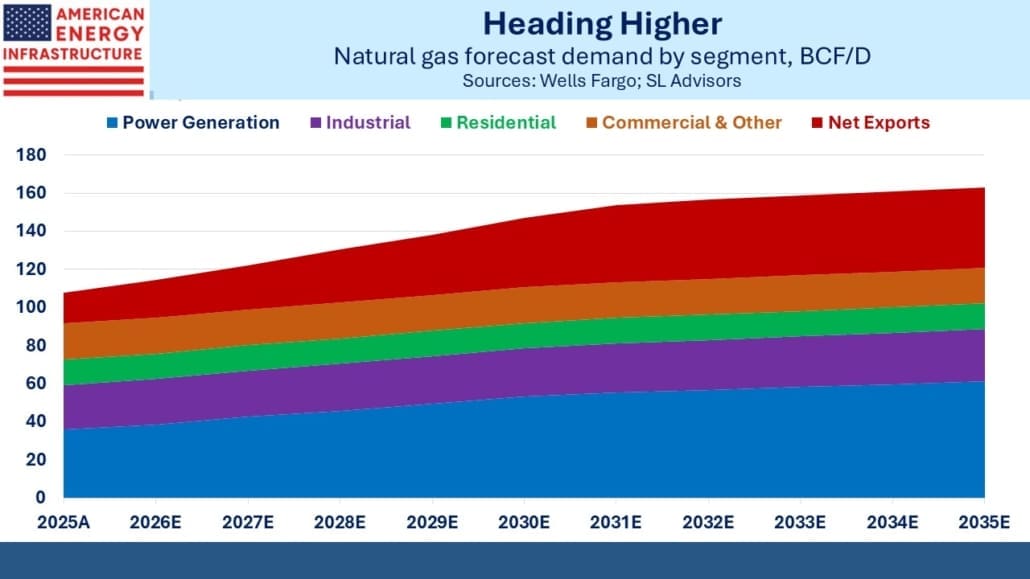
By 2035 the demand for US natural gas will reach 163 Billion Cubic Feet per Day (BCF/D) according to Wells Fargo, an increase of half from last year. The twin drivers of this will be power generation whose natural gas consumption will rise from 36 BCF/D to 61 BCF/D, and exports, mostly Liquefied Natural Gas (LNG), which will go from 16 BCF/D to 42 BCF/D.
An appealing feature of natural gas is that it’s hard to move – generally only via pipeline or LNG tanker. The supporting infrastructure requires long term contracts, since an LNG export terminal can only export LNG. And because construction takes years, there’s good visibility around the resulting cashflows.
For example, Cheniere has pre-sold 95% of its liquefaction through 2035. Most of the gas pipelines being built over the next couple of years are in pro-energy Texas where frivolous lawsuits from climate extremists are ineffective.
Power demand doesn’t offer quite the same long term visibility, but hyperscalers are signing 5-10 year contracts for gas to feed dedicated power plants for their data centers. In cases where this set-up bypasses the grid it’s known as Behind The Meter (BTM), to avoid growing public opposition to AI and its upward pressure on electricity prices.
Forecasts of growing gas demand are not controversial. The US Energy Information Administration has issued similar projections.
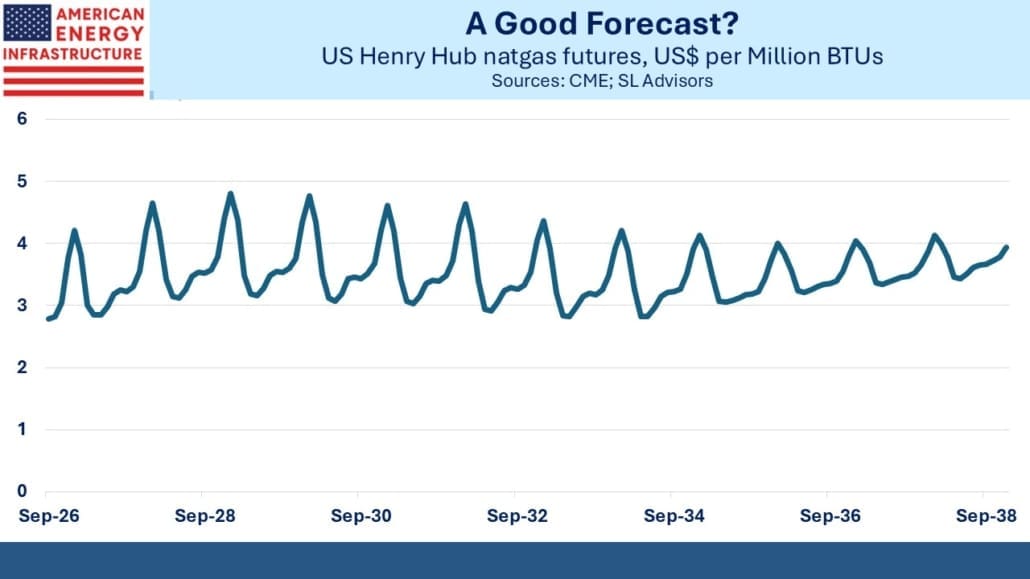
Hiding in plain sight is the natural gas futures curve, incongruously forecasting no appreciable change in prices over the next decade when demand will rise by 50%. This anomaly didn’t just appear – demand forecasts have been moving higher for a couple of years with no discernible impact on the futures curve.
Market prices drive a lot of business plans. Gas E&P companies are routinely valued by calculating the net asset value of their proved reserves based on futures prices. Companies that have contracted to buy LNG from US exporters like Cheniere or Venture Global begin their financial modeling with futures prices although certainly run multiple scenarios. The hyperscalers signing BTM power deals underpinned by natural gas presumably use the futures curve as well.
A lot of consumption in the years ahead is assuming, or hoping, that today’s prices of <$3 per Million BTUs (MMBTUs) will still prevail. And while prudent risk management suggests that business projections contemplate higher prices, no meaningful hedging has taken place.
We know this because over half the open interest in natural gas futures is concentrated in the next six months. The July 2028 contract has open interest of under 3,000 contracts, equivalent to around 28 BCF which is less than 1% of projected monthly demand.
Oil and gas producers are generally more active in hedging than are buyers of refined products such as utilities or airlines. This makes sense because gas producer Range Resources (RRC) for example is exposed to gas prices on over two thirds of its revenues (the rest is natural gas liquids and crude oil). Their hedging tends to focus on the next 12-24 months. By contrast, United Airlines can pass on higher jet fuel costs to passengers and modify their schedule, as they have this year.
This asymmetry between price risk tolerance for producers versus consumers probably puts downward pressure on futures, even though price changes for every molecule of hydrocarbons produced and consumed create gains and losses in equal measure.
Virtually all the projected consumption of gas over the next decade is exposed to higher prices, and while buyers can build a price cushion in their financial models, they can’t immunize against it.
This is a point made by Matthew Smith of Chronometer Partners in an interview with Patrick O’Shaughnessy on his Colossus podcast. Smith believes that the consensus demand projections are unattainable without sharply higher prices and perhaps some moderation of projected demand growth.
With natural gas providing over 40% of America’s electricity, households are among the biggest losers. He sees hyperscalers and LNG exporters causing a squeeze within a few years.
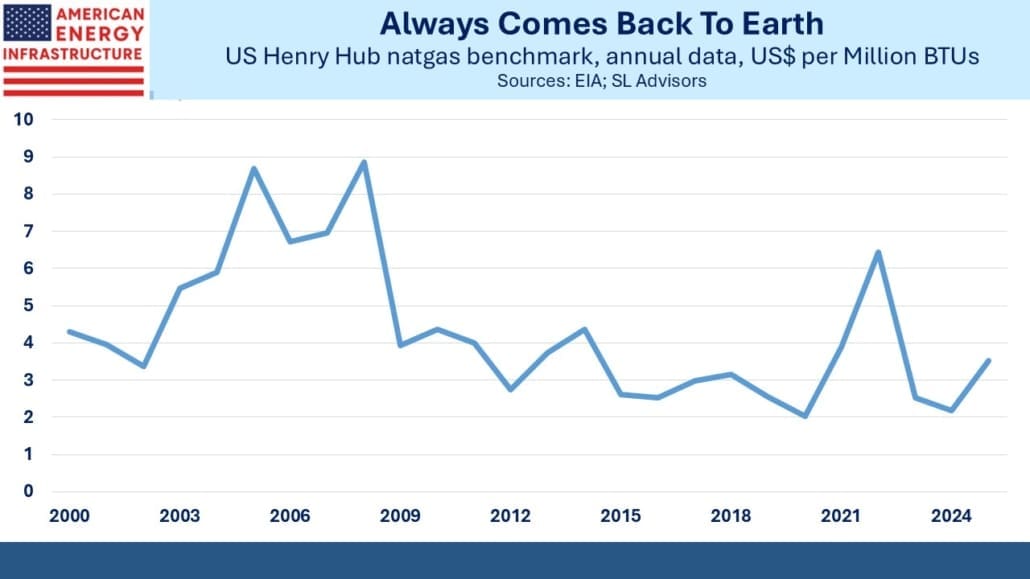
Smith’s view is not new. Bullish natural gas positions have been relieving traders of their capital for years as prices have remained stubbornly anchored around $3 for much of the past decade. Nonetheless, after annual consumption growth of 2-4 BCF/D over the past several years we’re entering a period of 7+ BCF/D annually through 2030. This might be the moment.
JPMorgan calculates that RRC is valued at 81% of the NAV of its total reserves and 64% of its proved developed reserves. Gas prices seem more likely to rise than fall given the demand outlook, boosting RRC’s stock price, although this may take a while. Our trader Larry, upon learning that Smith expects higher prices by 2028, said to remind him next year.
But over that timeframe and longer the outlook for natural gas producers, and the volume-driven infrastructure companies that support them, looks encouraging.
We have two have funds that seek to profit from this environment:

Important Disclosures
The information provided is for informational purposes only and investors should determine for themselves whether a particular service, security or product is suitable for their investment needs. The information contained herein is not complete, may not be current, is subject to change, and is subject to, and qualified in its entirety by, the more complete disclosures, risk factors and other terms that are contained in the disclosure, prospectus, and offering. Certain information herein has been obtained from third party sources and, although believed to be reliable, has not been independently verified and its accuracy or completeness cannot be guaranteed. No representation is made with respect to the accuracy, completeness or timeliness of this information. Nothing provided on this site constitutes tax advice. Individuals should seek the advice of their own tax advisor for specific information regarding tax consequences of investments. Investments in securities entail risk and are not suitable for all investors. This site is not a recommendation nor an offer to sell (or solicitation of an offer to buy) securities in the United States or in any other jurisdiction.
References to indexes and benchmarks are hypothetical illustrations of aggregate returns and do not reflect the performance of any actual investment. Investors cannot invest in an index and do not reflect the deduction of the advisor’s fees or other trading expenses. There can be no assurance that current investments will be profitable. Actual realized returns will depend on, among other factors, the value of assets and market conditions at the time of disposition, any related transaction costs, and the timing of the purchase. Indexes and benchmarks may not directly correlate or only partially relate to portfolios managed by SL Advisors as they have different underlying investments and may use different strategies or have different objectives than portfolios managed by SL Advisors (e.g. The Alerian index is a group MLP securities in the oil and gas industries. Portfolios may not include the same investments that are included in the Alerian Index. The S & P Index does not directly relate to investment strategies managed by SL Advisers.)
This site may contain forward-looking statements relating to the objectives, opportunities, and the future performance of the U.S. market generally. Forward-looking statements may be identified by the use of such words as; “believe,” “expect,” “anticipate,” “should,” “planned,” “estimated,” “potential” and other similar terms. Examples of forward-looking statements include, but are not limited to, estimates with respect to financial condition, results of operations, and success or lack of success of any particular investment strategy. All are subject to various factors, including, but not limited to general and local economic conditions, changing levels of competition within certain industries and markets, changes in interest rates, changes in legislation or regulation, and other economic, competitive, governmental, regulatory and technological factors affecting a portfolio’s operations that could cause actual results to differ materially from projected results. Such statements are forward-looking in nature and involves a number of known and unknown risks, uncertainties and other factors, and accordingly, actual results may differ materially from those reflected or contemplated in such forward-looking statements. Prospective investors are cautioned not to place undue reliance on any forward-looking statements or examples. None of SL Advisors LLC or any of its affiliates or principals nor any other individual or entity assumes any obligation to update any forward-looking statements as a result of new information, subsequent events or any other circumstances. All statements made herein speak only as of the date that they were made. r
Certain hyperlinks or referenced websites on the Site, if any, are for your convenience and forward you to third parties’ websites, which generally are recognized by their top level domain name. Any descriptions of, references to, or links to other products, publications or services does not constitute an endorsement, authorization, sponsorship by or affiliation with SL Advisors LLC with respect to any linked site or its sponsor, unless expressly stated by SL Advisors LLC. Any such information, products or sites have not necessarily been reviewed by SL Advisors LLC and are provided or maintained by third parties over whom SL Advisors LLC exercise no control. SL Advisors LLC expressly disclaim any responsibility for the content, the accuracy of the information, and/or quality of products or services provided by or advertised on these third-party sites.
All investment strategies have the potential for profit or loss. Different types of investments involve varying degrees of risk, and there can be no assurance that any specific investment will be suitable or profitable for a client’s investment portfolio.
Past performance of the American Energy Independence Index is not indicative of future returns.
Leave a Reply
Want to join the discussion?Feel free to contribute!