
Energy By The Numbers


/
The 75th edition of the Statistical Review of World Energy contains all the data a student of global energy could need. If you need to know Latvia’s solar power generation over the past couple of years (1.4 Terrawatt Hours and 2.0 respectively), this is the place to look. Last year the world produced 600 Exajoules of energy, +1.7% year-on-year with a 1.4% ten year CAGR.
Energy production (and consumption, since we overwhelmingly consume what we produce) has been rising as far back as reliable data exists. This has been punctuated only by brief pauses for recessions, such as the 2008-09 Great Financial Crisis or the 2020 Pandemic.

One of the big failings of the International Energy Agency (IEA) was to publish forecasts showing declining global energy consumption. This was to support their agenda to help the world eliminate Greenhouse Gas (GHGs) emissions by 2050. Global energy consumption is only going to fall once the population does – an increasingly likely scenario later this century given declining birthrates.
But the IEA’s wishful thinking was another loss of credibility for environmental extremists. Developing countries want OECD-like living standards, and their quest for increased energy consumption is the defining feature of the world’s energy needs.
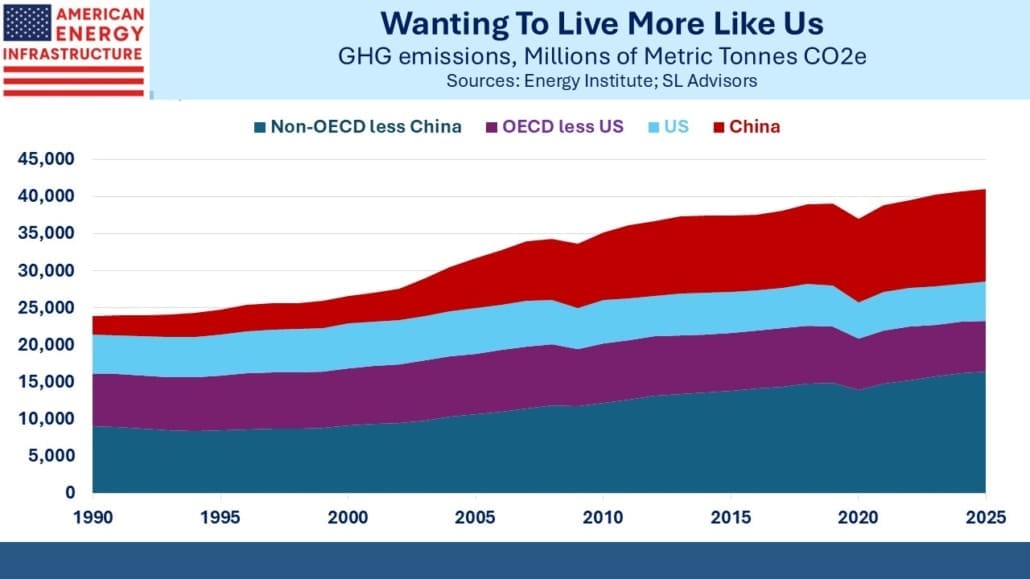
GHGs reached 41 Gigatonnes (GTs), a new record. Since 1990 all of the 17GTs increase has been from developing (non-OECD) countries, with China 58% of that. However, last year the US increase in GHGs was almost half the world’s total. China was roughly flat.
US GDP growth of 2.9% was double the EU’s 1.4% — Europe is not an example that we want to emulate here. So higher emissions reflect economic strength. But US coal consumption also jumped by 10%, reflecting White House policy choices. China’s coal consumption was flat but is still 9X the US. The unavoidable math is that China and other big developing countries are the source of increased emissions.
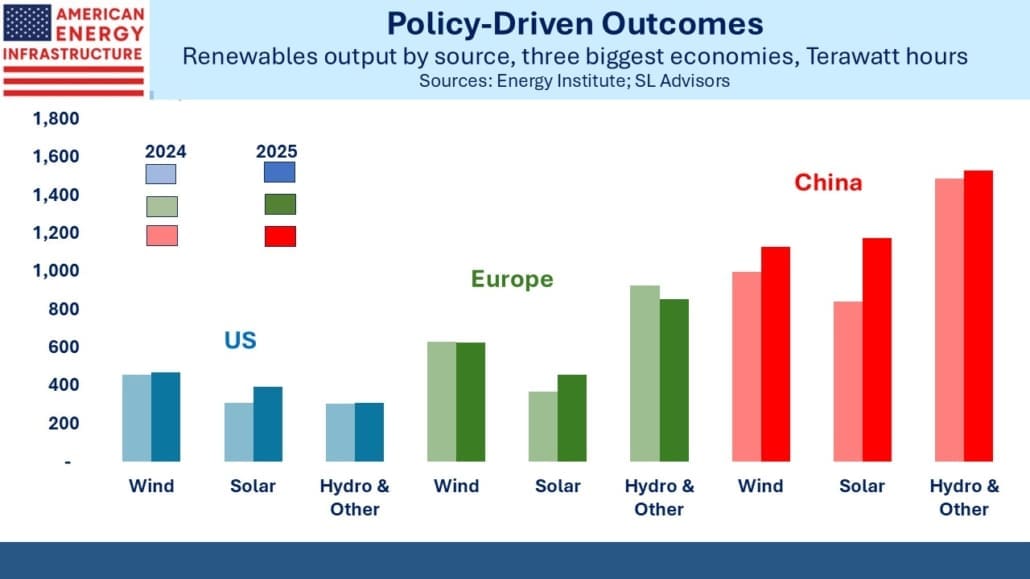
US renewables output grew strongly last year, led by solar which jumped 28%. Even wind output grew 3%, in spite of the President’s antipathy. If Trump was so moved, he could claim to be a global leader on renewables too.
Europe, the global leader on growth-stifling energy policies and high prices, saw a modest decline in windpower and overall almost no growth in renewables output. Apologists blamed the weather. Wind was unreliable and showed up in the wrong places. They blame climate change.
China saw growth across wind, solar and hydro.
Different policies are driving these outcomes. China is motivated by energy security – their EV fleet runs largely on coal. They favor domestic energy above all else. The growth in crude imports was all driven by non-transportation demand.
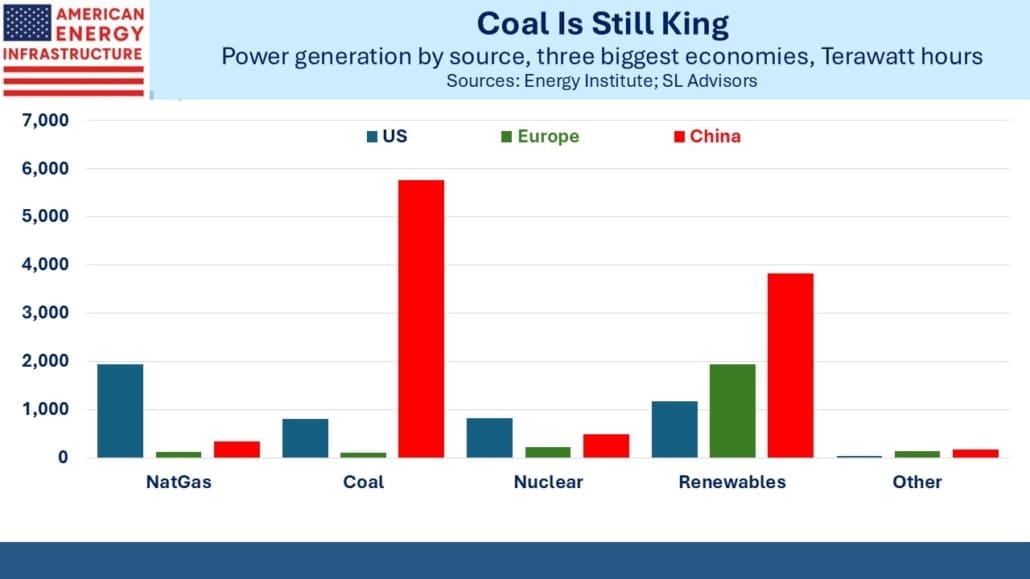
Europe wants lower emissions more than it wants GDP growth. US policy has flipped somewhat, but the net result is the most market driven of the three.
Interestingly, the growth in global renewables output of 861 Terrawatt hours (Twhs) exceeded the growth in total electricity demand of 855 Twhs, the first time it’s ever happened. Pakistan got 22% of its power from solar last year.

Nonetheless, the world runs on hydrocarbons, with 86.2% of the world’s total energy supply coming from coal, oil and gas. In 2024 it was 86.6%.

Refinery throughput was down last year in the former Soviet Union and the Middle East. This was before Ukrainian drones started attacking Russian energy infrastructure and Iran’s closure of the Strait of Hormuz impeded Middle East exports. The throughput figures for this year will show further losses, which is keeping refining margins high.
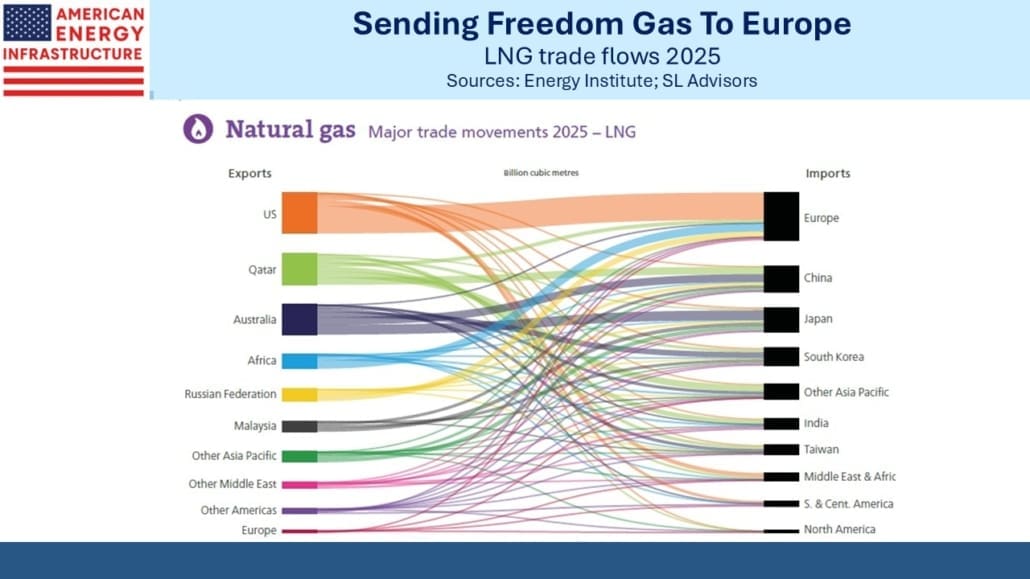
Natural gas remains a big US success story. It provides 22% of the world’s electricity but 41% of ours, versus 5% and 3% in Europe and China respectively. It’s cheap, and we’re the world’s #1 LNG exporter. The US is Europe’s biggest LNG supplier, and Qatar’s continued inability to honor its contracts enhances our competitive position every day.

The AI Revolution is visible in data center power demand, growing at a 14% CAGR over the past five years, during which it’s gone from 1.5% of total power consumption to 2.4%. As with many metrics in energy, the US is biggest while China’s growing faster. Cheap natural gas provides a critical advantage for America in this arena. Data centers consumed 6.5% of our power generation last year. The Department of Energy expects the share to reach 9-12% by 2030.
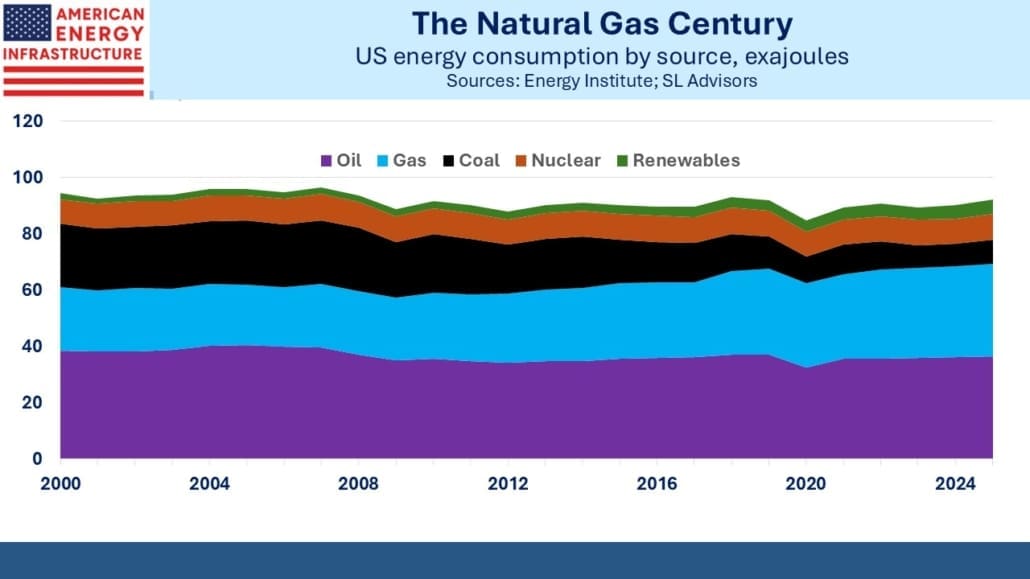
One of my favorite charts is the last one, showing that the US energy transition from coal to gas is the only one worth talking about. Gas consumption has increased on an energy equivalent basis more than three times as much as renewables. That doesn’t include gas exports, which are helping to displace coal in other countries too. Solar and wind have received disproportionate attention. America’s economic success is built on natural gas, and that’s not going to change anytime soon.
We have two have funds that seek to profit from this environment:

Important Disclosures
The information provided is for informational purposes only and investors should determine for themselves whether a particular service, security or product is suitable for their investment needs. The information contained herein is not complete, may not be current, is subject to change, and is subject to, and qualified in its entirety by, the more complete disclosures, risk factors and other terms that are contained in the disclosure, prospectus, and offering. Certain information herein has been obtained from third party sources and, although believed to be reliable, has not been independently verified and its accuracy or completeness cannot be guaranteed. No representation is made with respect to the accuracy, completeness or timeliness of this information. Nothing provided on this site constitutes tax advice. Individuals should seek the advice of their own tax advisor for specific information regarding tax consequences of investments. Investments in securities entail risk and are not suitable for all investors. This site is not a recommendation nor an offer to sell (or solicitation of an offer to buy) securities in the United States or in any other jurisdiction.
References to indexes and benchmarks are hypothetical illustrations of aggregate returns and do not reflect the performance of any actual investment. Investors cannot invest in an index and do not reflect the deduction of the advisor’s fees or other trading expenses. There can be no assurance that current investments will be profitable. Actual realized returns will depend on, among other factors, the value of assets and market conditions at the time of disposition, any related transaction costs, and the timing of the purchase. Indexes and benchmarks may not directly correlate or only partially relate to portfolios managed by SL Advisors as they have different underlying investments and may use different strategies or have different objectives than portfolios managed by SL Advisors (e.g. The Alerian index is a group MLP securities in the oil and gas industries. Portfolios may not include the same investments that are included in the Alerian Index. The S & P Index does not directly relate to investment strategies managed by SL Advisers.)
This site may contain forward-looking statements relating to the objectives, opportunities, and the future performance of the U.S. market generally. Forward-looking statements may be identified by the use of such words as; “believe,” “expect,” “anticipate,” “should,” “planned,” “estimated,” “potential” and other similar terms. Examples of forward-looking statements include, but are not limited to, estimates with respect to financial condition, results of operations, and success or lack of success of any particular investment strategy. All are subject to various factors, including, but not limited to general and local economic conditions, changing levels of competition within certain industries and markets, changes in interest rates, changes in legislation or regulation, and other economic, competitive, governmental, regulatory and technological factors affecting a portfolio’s operations that could cause actual results to differ materially from projected results. Such statements are forward-looking in nature and involves a number of known and unknown risks, uncertainties and other factors, and accordingly, actual results may differ materially from those reflected or contemplated in such forward-looking statements. Prospective investors are cautioned not to place undue reliance on any forward-looking statements or examples. None of SL Advisors LLC or any of its affiliates or principals nor any other individual or entity assumes any obligation to update any forward-looking statements as a result of new information, subsequent events or any other circumstances. All statements made herein speak only as of the date that they were made. r
Certain hyperlinks or referenced websites on the Site, if any, are for your convenience and forward you to third parties’ websites, which generally are recognized by their top level domain name. Any descriptions of, references to, or links to other products, publications or services does not constitute an endorsement, authorization, sponsorship by or affiliation with SL Advisors LLC with respect to any linked site or its sponsor, unless expressly stated by SL Advisors LLC. Any such information, products or sites have not necessarily been reviewed by SL Advisors LLC and are provided or maintained by third parties over whom SL Advisors LLC exercise no control. SL Advisors LLC expressly disclaim any responsibility for the content, the accuracy of the information, and/or quality of products or services provided by or advertised on these third-party sites.
All investment strategies have the potential for profit or loss. Different types of investments involve varying degrees of risk, and there can be no assurance that any specific investment will be suitable or profitable for a client’s investment portfolio.
Past performance of the American Energy Independence Index is not indicative of future returns.
Leave a Reply
Want to join the discussion?Feel free to contribute!