Revising The Gas Outlook Higher

/
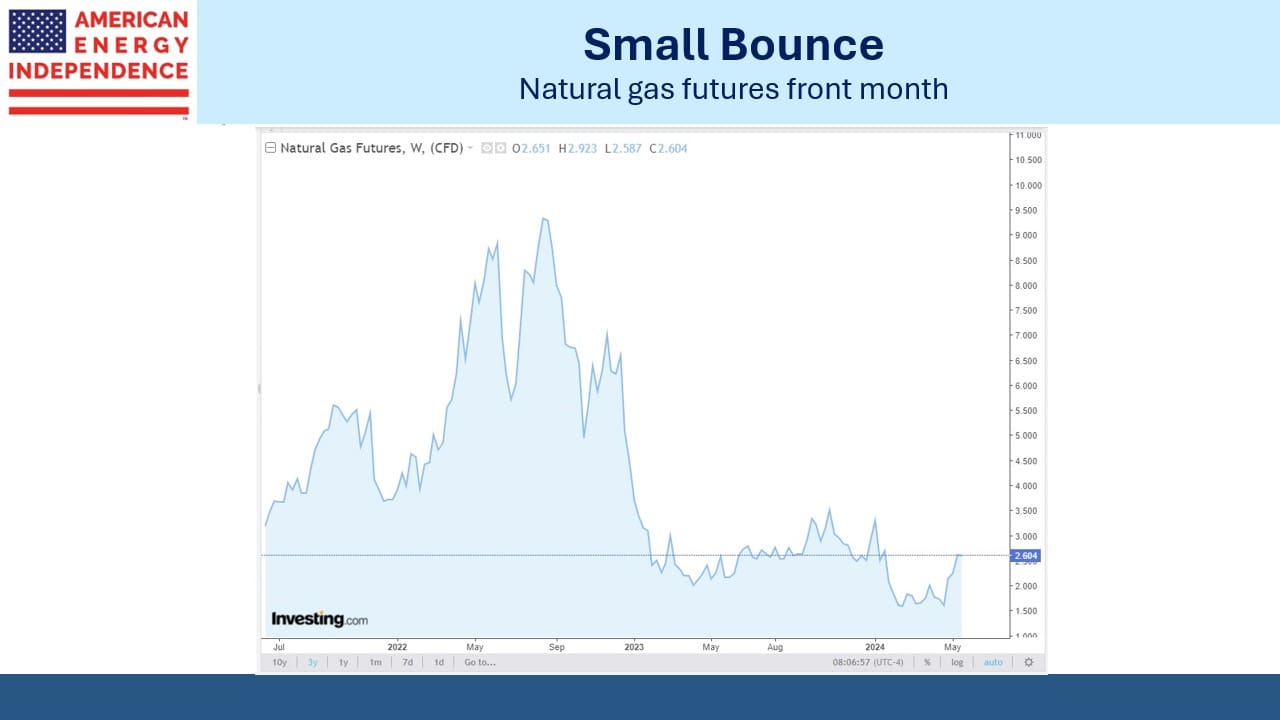
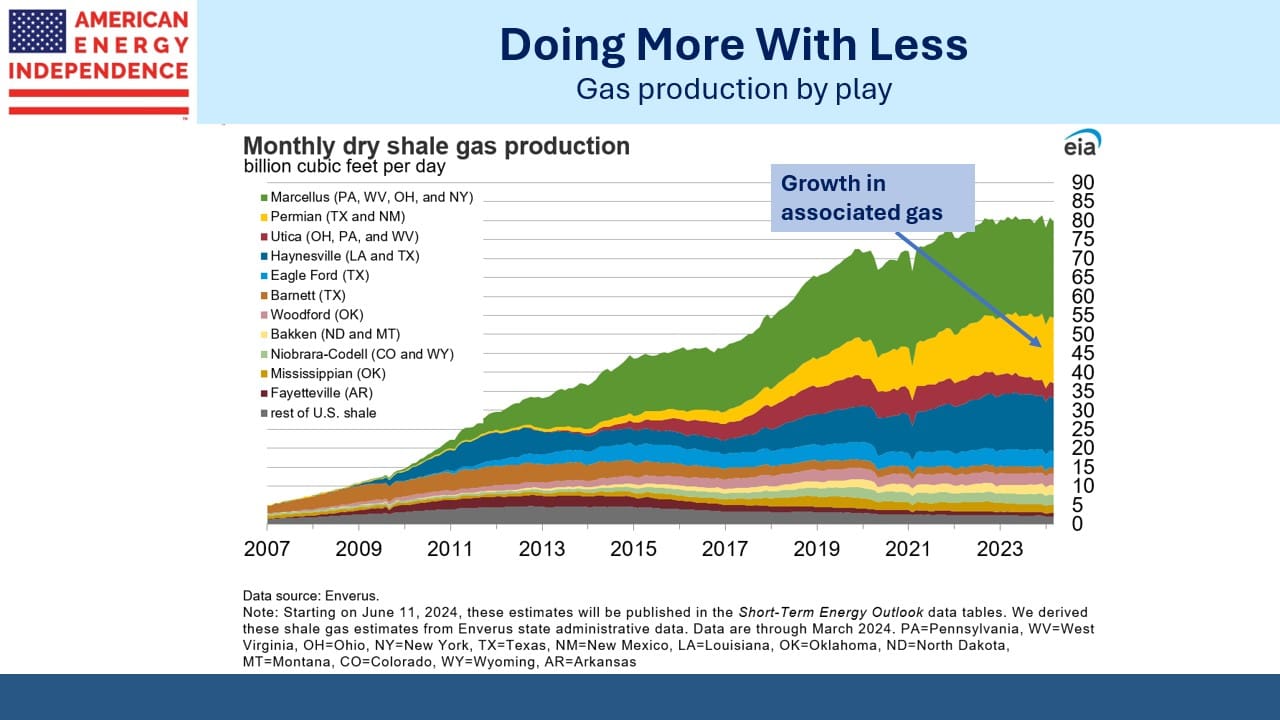
Natural gas prices have been recovering in the US following several months below $2 per Million BTUs (MMBTU). The techniques of horizontal drilling and hydraulic fracturing (“fracking”) have enjoyed steady improvement, allowing break-evens to fall. An additional factor has been associated gas from the Permian in west Texas. E&P companies want oil but they get gas anyway, and in many cases the production is becoming more “gassy”.
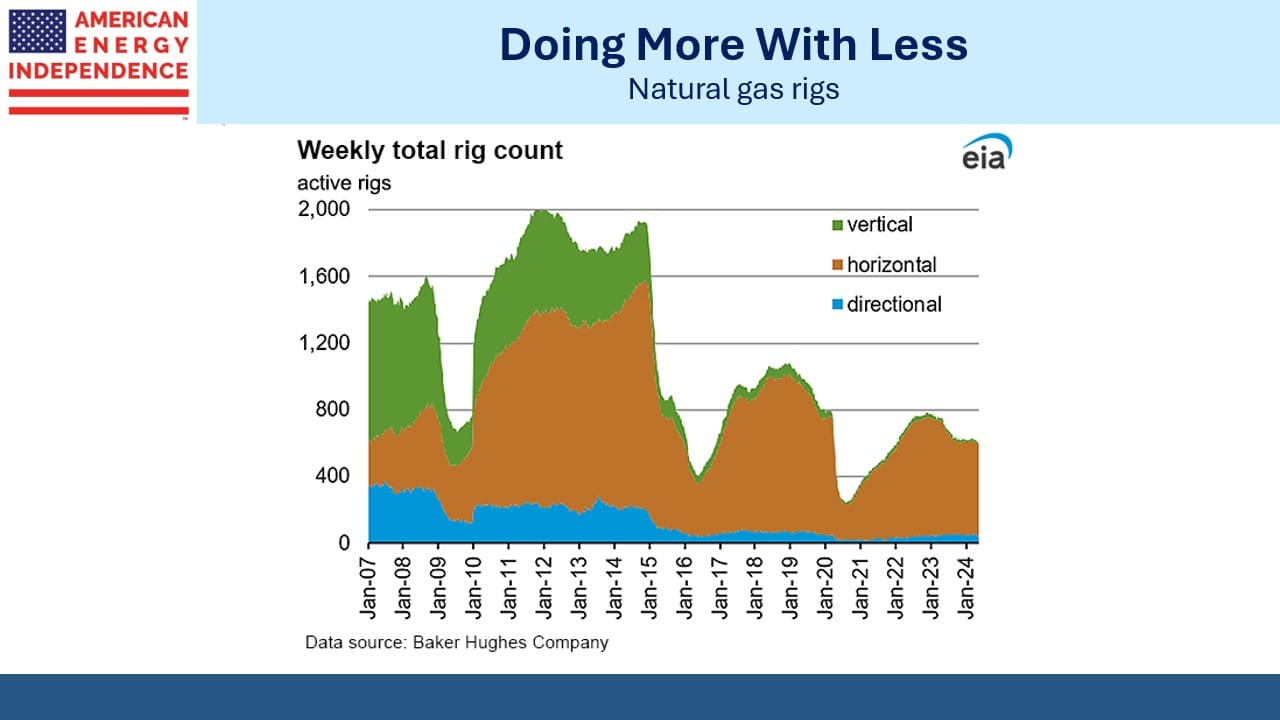
Natural gas rigs employed are 27% lower than a year ago. This reflects improved efficiency but also production cutbacks in plays that are all or mostly gas (“dry gas”). Late last year natural gas production surged, averaging 104.6 Billion Cubic feet per Day (BCF/D) in November. Full year 2023 production averaged 102.4 BCF/D, up from 97.5 BCF/D in 2022. This year it’s likely to fall slightly to 101.6 BCF/D, demonstrating the old saw that the cure for low prices is low prices. But it should rebound in 2025.
That’s because demand growth is coming. Public utility companies quickly turned the conversation to AI power demand on earnings calls. Forecasts of 5% annual revenue growth are not uncommon in this sector. It’s caused a surprising turnaround in utility stocks. Following –7.2% performance last year, the S&P Utilities ETF (XLU) is +12.7 YTD. The recovery coincided inconveniently with our warning that many of these companies face substantial future capex (see To Lose On The Energy Transition Buy Utilities).
It’s hard to overstate the level of new investment in data centers. JPMorgan estimates $300BN globally this year, up from $200BN in 2020. They see $500BN by 2027. The big spenders are Microsoft, Google, Amazon, Meta, Apple, IBM, and Oracle. Nvidia’s recent results provided real-time confirmation of the spending on AI chips.
AI power demand is on track to double from 2022-26.
JPMorgan estimates that the increase in power demand should require an additional 1.4 BCF/D of natural gas by 2027 and 6.2 BCF/D by 2030.
The Energy Information Administration (EIA) has consistently forecast declining natural gas consumption in the US power sector. Unlike many forecasters, the EIA is non-partisan so they don’t regard their publications as providing cheerleading support for renewables. The International Energy Agency does just that, devaluing their output.
The EIA’s outlook has been predicated on renewables gaining market share. Since 2010 solar and wind have gone from 2% to 15% of US power generation. Casual reporting often presents this as evidence that weather-dependent electricity is taking over. But natural gas has gone from 23% to 42% over the same period.
By the numbers, America’s biggest electricity story is the growth of natural gas which has displaced coal. Intermittent power is growing, but thankfully is not yet to the point at which we fear dunkelflaute, the German word for cloudy or windless days.
In January Texas, which relies substantially on windpower, set a winter record for natural gas provided electricity.
Feedstock for LNG export terminals is set to increase by 9.4 BCF/D through 2030 based on facilities already under construction. This will take total US LNG export capacity to 26 BCF/D, including NextDecade’s Rio Grande Stage 1 with 2.2 BCF/D (see What’s Next For NextDecade?).
However, JPMorgan assumes 86% utilization given the possibility of excess global LNG supply by then, resulting in 22.4 BCF/D of exports. roughly a quarter of current production.
The combination of AI power demand and LNG exports will require an additional 15 BCF/D of production by 2030, bringing us to around 120 BCF/D. Achieving that increased level of output will require activating wells with higher break evens. However, natural gas bulls will need to temper their enthusiasm because JPMorgan believes a price of around $3.50 per MMBTUs will be sufficient for the market to clear.
The EIA has sharply reduced their forecast natural gas price since early last year. They previously had it oscillating either side of $5 per MMBTUs but have adjusted that roughly $1 lower.
The arbitrage between global LNG prices and US looks likely to remain for the foreseeable future. The European TTF benchmark trades at $11 per MMBTUs and the Asian JKM at $12. Both these offer enough margin to cover the transportation cost from the US. We’re just capacity constrained.
The Golden Pass LNG project, co-owned by Exxon Mobil Corp. and QatarEnergy LNG, faces possible delays as the general contractor filed for bankruptcy. 3,000 workers were laid off. It’s scheduled to be operational in less than a year, and that timeline must presumably be in doubt.
US natural gas has a bright outlook. It’s a blue flame future.
We have three have funds that seek to profit from this environment:

Important Disclosures
The information provided is for informational purposes only and investors should determine for themselves whether a particular service, security or product is suitable for their investment needs. The information contained herein is not complete, may not be current, is subject to change, and is subject to, and qualified in its entirety by, the more complete disclosures, risk factors and other terms that are contained in the disclosure, prospectus, and offering. Certain information herein has been obtained from third party sources and, although believed to be reliable, has not been independently verified and its accuracy or completeness cannot be guaranteed. No representation is made with respect to the accuracy, completeness or timeliness of this information. Nothing provided on this site constitutes tax advice. Individuals should seek the advice of their own tax advisor for specific information regarding tax consequences of investments. Investments in securities entail risk and are not suitable for all investors. This site is not a recommendation nor an offer to sell (or solicitation of an offer to buy) securities in the United States or in any other jurisdiction.
References to indexes and benchmarks are hypothetical illustrations of aggregate returns and do not reflect the performance of any actual investment. Investors cannot invest in an index and do not reflect the deduction of the advisor’s fees or other trading expenses. There can be no assurance that current investments will be profitable. Actual realized returns will depend on, among other factors, the value of assets and market conditions at the time of disposition, any related transaction costs, and the timing of the purchase. Indexes and benchmarks may not directly correlate or only partially relate to portfolios managed by SL Advisors as they have different underlying investments and may use different strategies or have different objectives than portfolios managed by SL Advisors (e.g. The Alerian index is a group MLP securities in the oil and gas industries. Portfolios may not include the same investments that are included in the Alerian Index. The S & P Index does not directly relate to investment strategies managed by SL Advisers.)
This site may contain forward-looking statements relating to the objectives, opportunities, and the future performance of the U.S. market generally. Forward-looking statements may be identified by the use of such words as; “believe,” “expect,” “anticipate,” “should,” “planned,” “estimated,” “potential” and other similar terms. Examples of forward-looking statements include, but are not limited to, estimates with respect to financial condition, results of operations, and success or lack of success of any particular investment strategy. All are subject to various factors, including, but not limited to general and local economic conditions, changing levels of competition within certain industries and markets, changes in interest rates, changes in legislation or regulation, and other economic, competitive, governmental, regulatory and technological factors affecting a portfolio’s operations that could cause actual results to differ materially from projected results. Such statements are forward-looking in nature and involves a number of known and unknown risks, uncertainties and other factors, and accordingly, actual results may differ materially from those reflected or contemplated in such forward-looking statements. Prospective investors are cautioned not to place undue reliance on any forward-looking statements or examples. None of SL Advisors LLC or any of its affiliates or principals nor any other individual or entity assumes any obligation to update any forward-looking statements as a result of new information, subsequent events or any other circumstances. All statements made herein speak only as of the date that they were made. r
Certain hyperlinks or referenced websites on the Site, if any, are for your convenience and forward you to third parties’ websites, which generally are recognized by their top level domain name. Any descriptions of, references to, or links to other products, publications or services does not constitute an endorsement, authorization, sponsorship by or affiliation with SL Advisors LLC with respect to any linked site or its sponsor, unless expressly stated by SL Advisors LLC. Any such information, products or sites have not necessarily been reviewed by SL Advisors LLC and are provided or maintained by third parties over whom SL Advisors LLC exercise no control. SL Advisors LLC expressly disclaim any responsibility for the content, the accuracy of the information, and/or quality of products or services provided by or advertised on these third-party sites.
All investment strategies have the potential for profit or loss. Different types of investments involve varying degrees of risk, and there can be no assurance that any specific investment will be suitable or profitable for a client’s investment portfolio.
Past performance of the American Energy Independence Index is not indicative of future returns.


What is interesting is that currently LNG export capacity is set to increase to 26BCF/D based on current construction but JP Morgan estimates future export sales of only 22.4 BCF/D of LNG. This means that the Biden administration’s allegedly temporary halt in approving construction of LNG export facilities is not the damaging action that is feared.