Hedging with Energy

/
It’s always interesting to learn how financial advisers use our energy infrastructure investments in their portfolios. Often, it’s for income, because the 6-7% yields are well covered by cash flow, growing and supported by continued reluctance to boost growth capex. America has the pipeline network we need. New construction gets held up by court challenges from climate protesters, with the delays increasing costs. Equitrans with their Mountain Valley Pipeline project is an example. They announced a further delay because hiring is hard. Their recent 8K SEC filing noted, “multiple crews electing not to work on the project based on the history of court-related construction stops when there’s the risk of another court order stopping work.”
Canada’s federal government probably owns the record for cost over-runs, with a 4X increase since they acquired the TransMountain expansion from Kinder Morgan five years ago (see Governments And Their Energy Policies). Developments like these are dissuading growth projects, which is why pipeline sector dividends are growing. A dollar not spent on capex is a dollar coming back to shareholders, through a dividend hike or stock buyback. It’s hard not to love climate extremists.
Because of the prospect of rising payouts and buybacks, we think pipelines offer income with growth. Who says you can’t have both?
Some financial advisors like energy because it’s relatively uncorrelated with other sectors. We think this makes a lot of sense (watch Will Geopolitical Risk Effect the Energy Market?).
I was with one such investor last week who uses midstream energy as a hedge against more conventional equity exposure. He’s very happy with the results, and his business is growing strongly because of this and doubtless many other good calls for his clients.
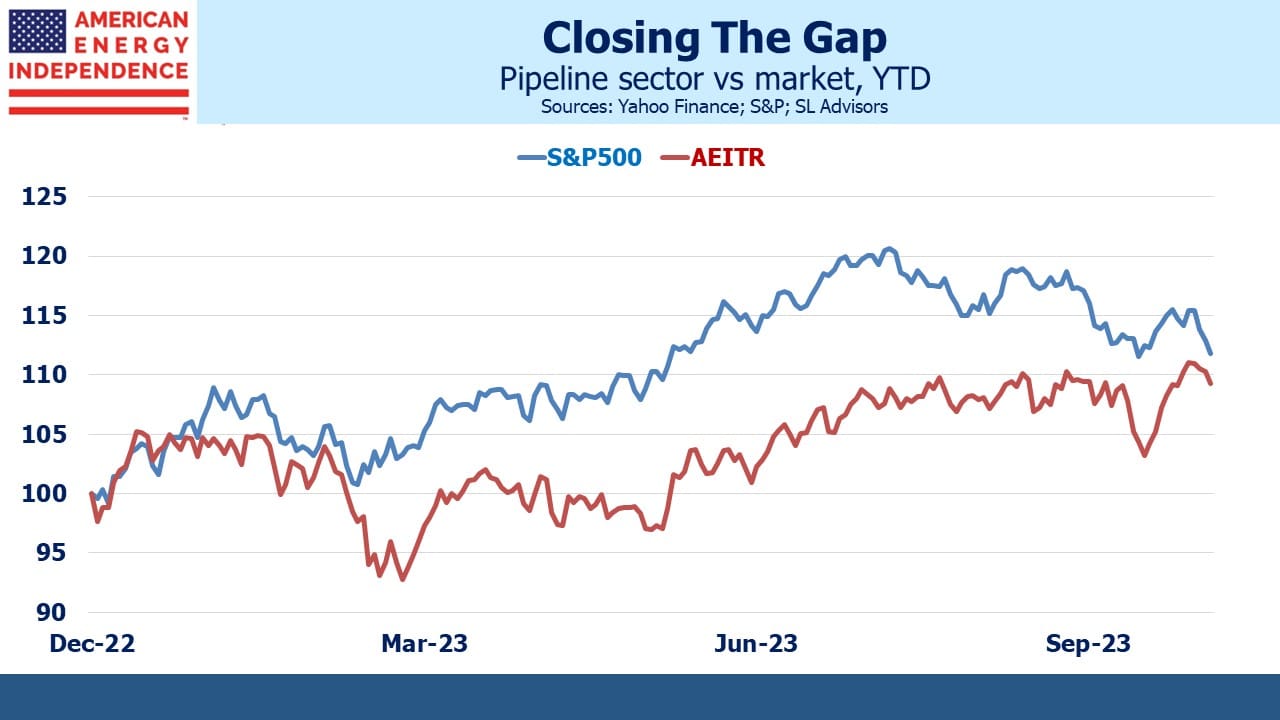
The American Energy Independence Index (AEITR) handily beat the S&P500 for the past two years. Pipeline companies are not popularly linked with AI so have lagged the market this year. However, the gap has begun to close as Israel has responded to the shocking terrorist attack by Hamas, ratcheting up tensions across the region.
By mid-July the S&P500 was 13% ahead of the AEITR. As of Friday the gap had shrunk to 2.6%. Dividends help – the S&P500’s dividend yield is a paltry 1.6%, less than a quarter of what pipelines pay. Enbridge (ENB) yields over 8.1%. Its C$3.55 dividend has grown annually for 28 years, a record management has pledged to continue. It represents an extreme case of the contrast between energy infrastructure and the overall market. ENB still looks like a good pairs trade with a short S&P500 position. Notwithstanding your blogger’s substantial overweight to the sector, I recently put that trade on too.
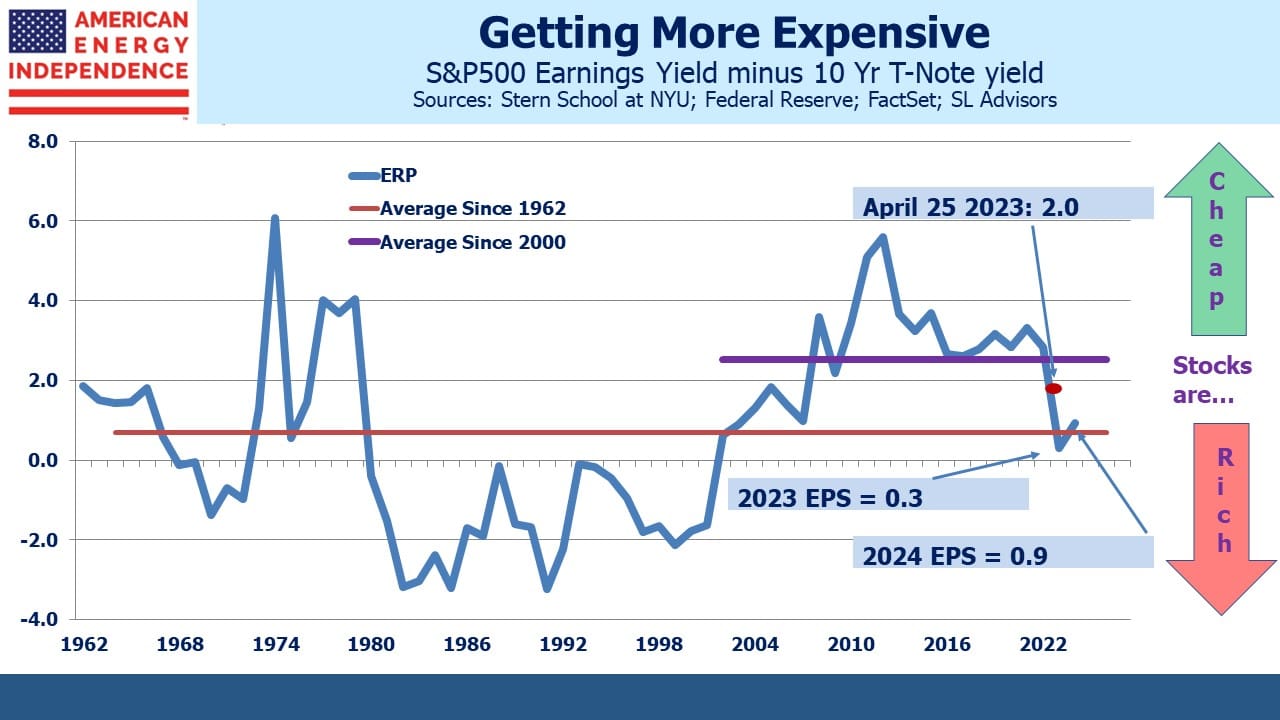
Stocks had a bad week. But they still don’t look that cheap. Six months ago (see Inflation vs Regional Bank Crisis) valuations were just average compared with the past couple of decades. Since then, the S&P500 has risen 4%, 2023 forecast earnings are flat and declining, and the ten year note has risen 1.5%.
Today’s Equity Risk Premium (ERP) of 0.3 is the lowest in two decades. Even using 2024E EPS, at 0.9 it’s still unattractive. Moreover, earnings forecasts have been declining in recent weeks, with few upward revisions likely other than for the defense sector.
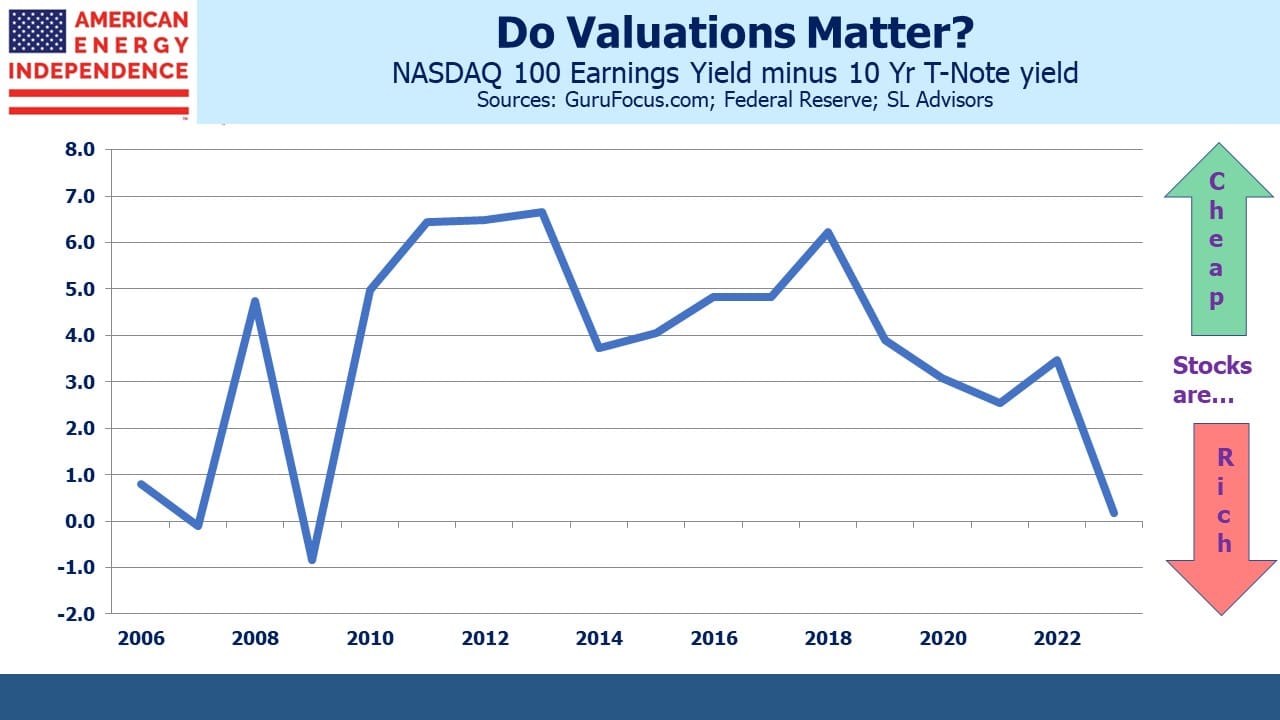
We’ve also included the ERP for the NASDAQ 100. This is an unconventional way to evaluate the tech sector, and your blogger long ago concluded that he felt more comfortable with value stocks. Over the years I have carefully avoided expensive investments with high growth rates, and such omissions have not always been to my advantage.
Nonetheless, it’s hard to resist publishing the Tech sector ERP chart. Rising bond yields are doubly bad here, because as well as offering a relatively stable return they mean a higher discount rate/lower NPV on those far bigger, far away profits.
Tech stocks lost three quarters of their value during the dot.com collapse. Even during the 2008 great financial crisis they were down by half. Today’s ERP for the sector is around the same level.
This blog doesn’t promise to get you into tech stocks at the low. But they don’t look cheap.
Electric vehicle (EV) sales are flattening out. Everyone I know who owns a Tesla loves it, but also has another car for long drives. But my circle of friends is not representative of America. A journalist on the NYTimes Climate desk recently reported on an EV trip he made in South Dakota that ended with his Volvo C40 being towed because it ran out of juice.
We still worry about our phone batteries going dead.
EVs seem like fun, but compared with much of the world, in the US we (1) drive farther, (2) drive bigger cars, and (3) enjoy relatively cheap gasoline. EV penetration looks as if it’ll be slower than many fans expect.
We have three have funds that seek to profit from this environment:

Important Disclosures
The information provided is for informational purposes only and investors should determine for themselves whether a particular service, security or product is suitable for their investment needs. The information contained herein is not complete, may not be current, is subject to change, and is subject to, and qualified in its entirety by, the more complete disclosures, risk factors and other terms that are contained in the disclosure, prospectus, and offering. Certain information herein has been obtained from third party sources and, although believed to be reliable, has not been independently verified and its accuracy or completeness cannot be guaranteed. No representation is made with respect to the accuracy, completeness or timeliness of this information. Nothing provided on this site constitutes tax advice. Individuals should seek the advice of their own tax advisor for specific information regarding tax consequences of investments. Investments in securities entail risk and are not suitable for all investors. This site is not a recommendation nor an offer to sell (or solicitation of an offer to buy) securities in the United States or in any other jurisdiction.
References to indexes and benchmarks are hypothetical illustrations of aggregate returns and do not reflect the performance of any actual investment. Investors cannot invest in an index and do not reflect the deduction of the advisor’s fees or other trading expenses. There can be no assurance that current investments will be profitable. Actual realized returns will depend on, among other factors, the value of assets and market conditions at the time of disposition, any related transaction costs, and the timing of the purchase. Indexes and benchmarks may not directly correlate or only partially relate to portfolios managed by SL Advisors as they have different underlying investments and may use different strategies or have different objectives than portfolios managed by SL Advisors (e.g. The Alerian index is a group MLP securities in the oil and gas industries. Portfolios may not include the same investments that are included in the Alerian Index. The S & P Index does not directly relate to investment strategies managed by SL Advisers.)
This site may contain forward-looking statements relating to the objectives, opportunities, and the future performance of the U.S. market generally. Forward-looking statements may be identified by the use of such words as; “believe,” “expect,” “anticipate,” “should,” “planned,” “estimated,” “potential” and other similar terms. Examples of forward-looking statements include, but are not limited to, estimates with respect to financial condition, results of operations, and success or lack of success of any particular investment strategy. All are subject to various factors, including, but not limited to general and local economic conditions, changing levels of competition within certain industries and markets, changes in interest rates, changes in legislation or regulation, and other economic, competitive, governmental, regulatory and technological factors affecting a portfolio’s operations that could cause actual results to differ materially from projected results. Such statements are forward-looking in nature and involves a number of known and unknown risks, uncertainties and other factors, and accordingly, actual results may differ materially from those reflected or contemplated in such forward-looking statements. Prospective investors are cautioned not to place undue reliance on any forward-looking statements or examples. None of SL Advisors LLC or any of its affiliates or principals nor any other individual or entity assumes any obligation to update any forward-looking statements as a result of new information, subsequent events or any other circumstances. All statements made herein speak only as of the date that they were made. r
Certain hyperlinks or referenced websites on the Site, if any, are for your convenience and forward you to third parties’ websites, which generally are recognized by their top level domain name. Any descriptions of, references to, or links to other products, publications or services does not constitute an endorsement, authorization, sponsorship by or affiliation with SL Advisors LLC with respect to any linked site or its sponsor, unless expressly stated by SL Advisors LLC. Any such information, products or sites have not necessarily been reviewed by SL Advisors LLC and are provided or maintained by third parties over whom SL Advisors LLC exercise no control. SL Advisors LLC expressly disclaim any responsibility for the content, the accuracy of the information, and/or quality of products or services provided by or advertised on these third-party sites.
All investment strategies have the potential for profit or loss. Different types of investments involve varying degrees of risk, and there can be no assurance that any specific investment will be suitable or profitable for a client’s investment portfolio.
Past performance of the American Energy Independence Index is not indicative of future returns.


Leave a Reply
Want to join the discussion?Feel free to contribute!