America’s Favorite Energy

/
When it comes to energy, the media has a decided liberal bias. With a few exceptions, journalists covering this sector breathlessly highlight the phenomenal growth of renewables and criticize those evil fossil fuel companies who supply 82% of the world’s primary energy. The solar/wind juggernaut is barreling along and if you don’t jump on you’ll be on the wrong side of history.
Bloomberg’s Naureen Malik, who’s not an obvious proselytizer for intermittent energy, recently noted that natural gas power plants represent a disproportionate share of outages during bad weather. Natural gas is America’s favorite fuel, providing 40% of US electricity generation last year and projected to rise to 41% this year. That’s three times the share of solar and wind.
If natural gas power plants sometimes fail during extreme weather, it reflects choices made about investing in hardening them. In some cases, spending on solar and wind has taken priority. It doesn’t reflect any inherent flaw in natural gas, which is why it’s America’s favorite fuel.
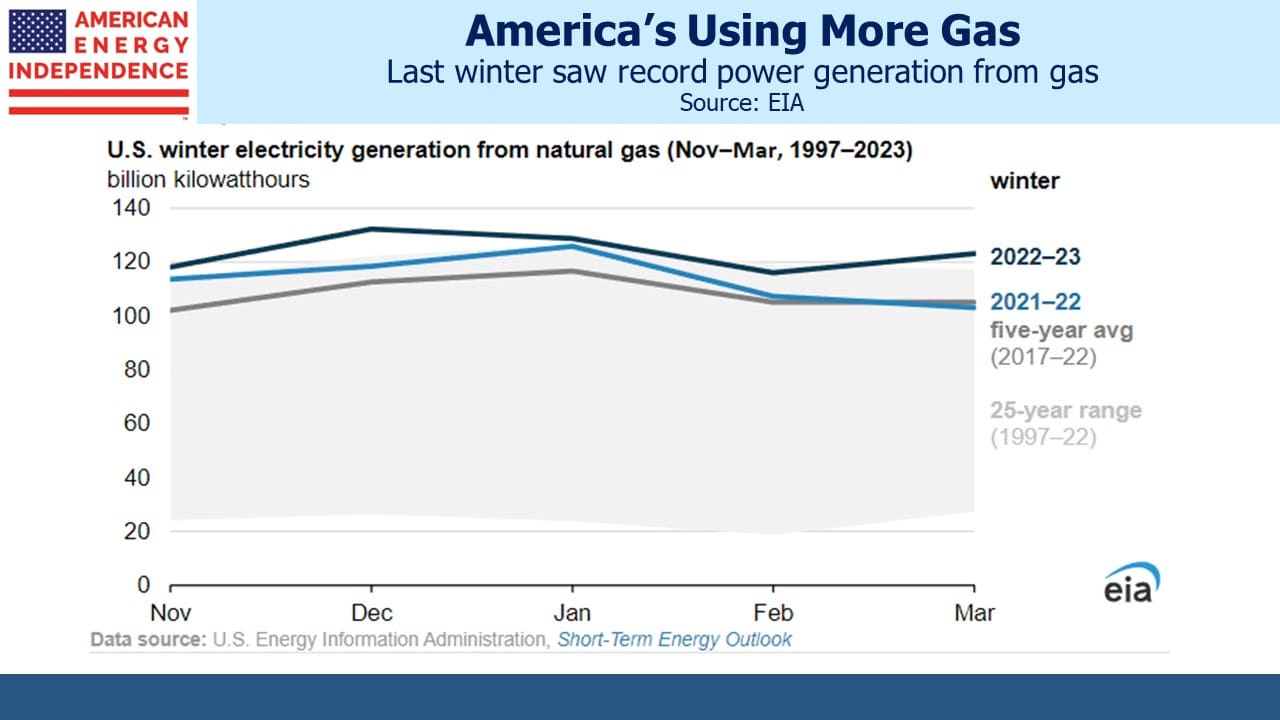
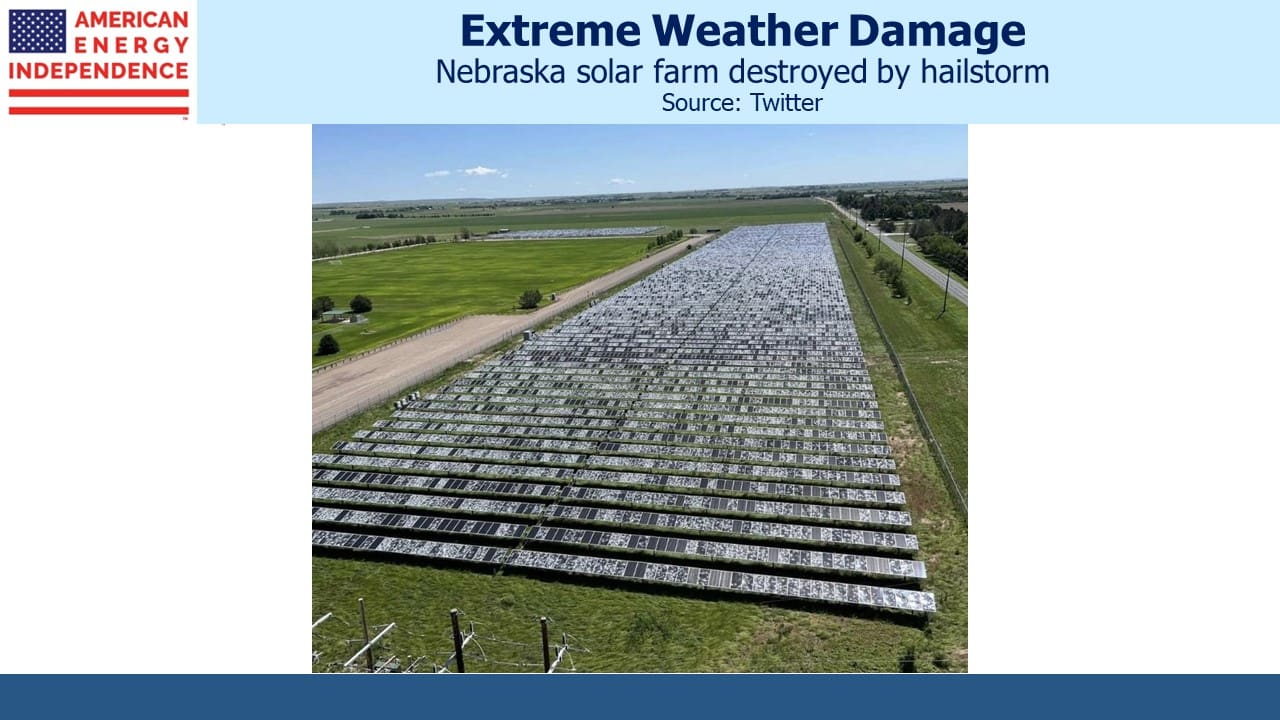
Last winter natural gas provided a record amount of power. What’s disproportionate is the media coverage of renewables relative to their impact. Solar panels aren’t just vulnerable to cloudy days, but also to hailstorms, as the photo from Nebraska shows.
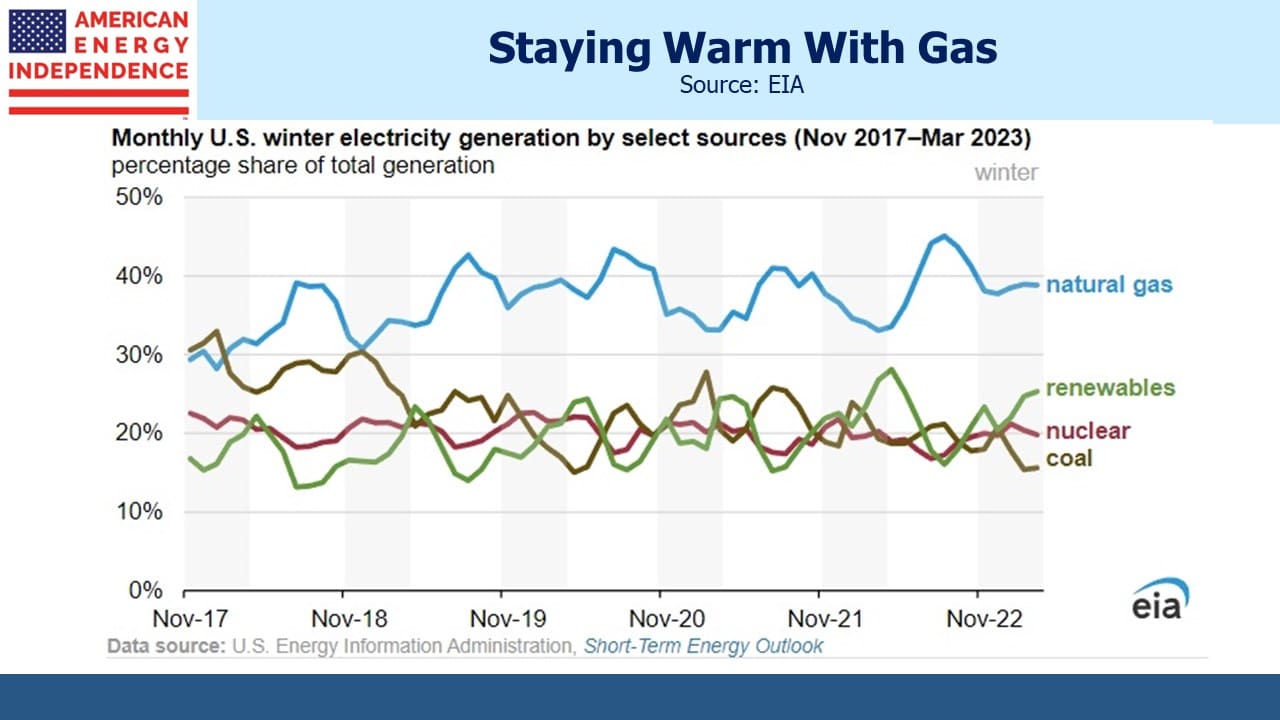
The chart showing share of electricity generation by source hardly suggests that utilities are drawn to the resilience of solar and wind. Bloomberg’s Malik might have presented a more balanced perspective by including such charts.
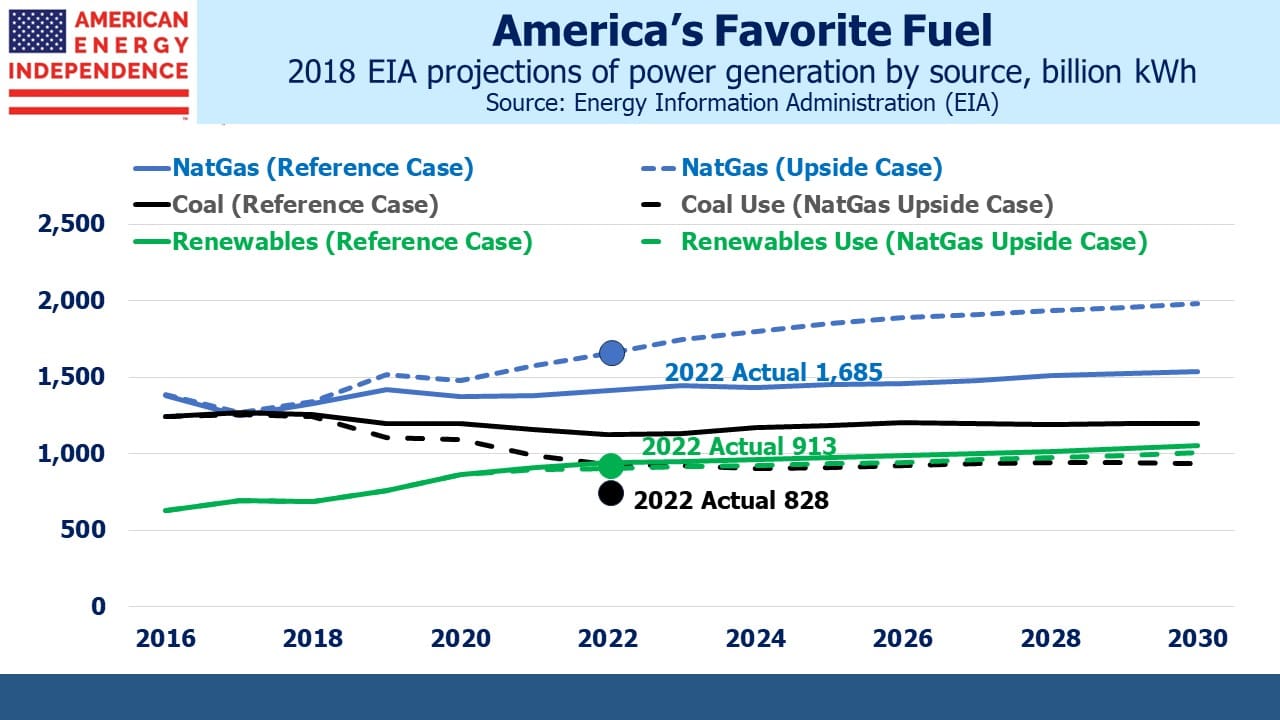
The EIA provides substantial data on current energy consumption as well as projected use. Their Annual Energy Outlook includes several scenarios as well as their Reference (or Base) Case. The most bullish natural gas scenario they model is the High Oil and Gas Resource and Technology Case. It’s labeled the Upside Case in the chart.
The steady growth in US natural gas consumption over the past five years hasn’t drawn much coverage, but since 2017 its use in power generation has grown at a 6% Compound Annual Growth Rate (CAGR), around the same as renewables. Because natural gas is our biggest source of electricity generation, the 418 billion kWh five year increase is almost double that from renewables (222 billion kWh). Coal use has declined at an 8% CAGR. This story doesn’t get told because it doesn’t align with the left-wing bias of most journalists. Too many energy news stories are little more than an op-ed.
The big story in US energy is the increasing use of natural gas, expanding at the most optimistic rate envisaged by the EIA five years ago. It’s also been our biggest source of reduced CO2 emissions, because coal use has simultaneously declined. The shale revolution generated mixed investment results, but it brought cheap energy that has boosted business here, can be exported to our friends and allies and provides energy security.
For several years the dark shadow of the energy transition dissuaded investors from committing capital to reliable energy. There’s a welcome turn in sentiment. Shell is trying to look more like US energy companies who resisted woke protesters to focus on maximizing returns. Blackrock’s Larry Fink has vowed not to use the term “ESG” since it’s become so maligned. Sweden recently adopted energy policies that dropped “only renewables” in favor of “clean”. This sensible shift allows for the inclusion of nuclear, and fuels like natural gas if the emissions are captured.
Midstream energy infrastructure has lagged the market this year, because it’s not a sector synonymous with AI. But relative performance in June was good with the American Energy Independence Index making up for some lost ground. The narrative around renewables and the energy transition is more subtle than the headlines, a realization that is spreading.
If you follow the energy sector you have to pick your journalists and outlets carefully.
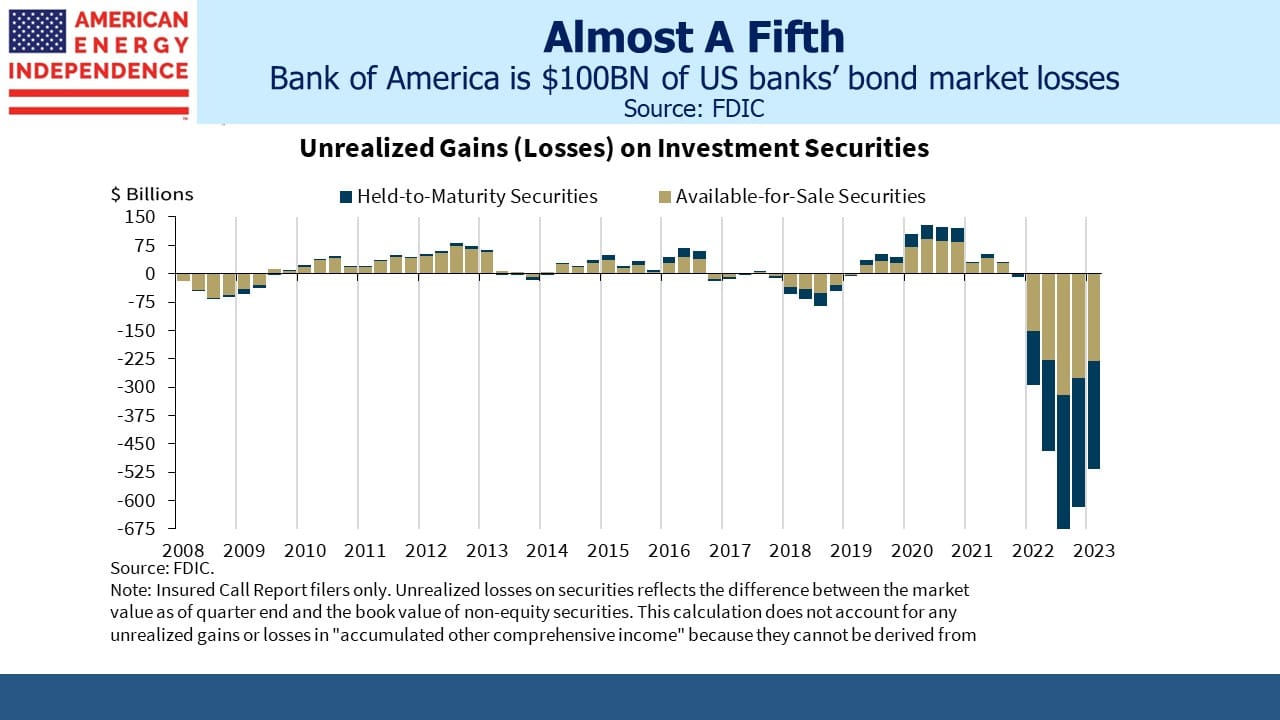
The futures market continues to chart a rate path less hawkish than the FOMC’s blue dots. But the gap is narrowing, in an unusual case of the market correcting towards the Fed. The carnage inflicted on bank securities’ portfolios was shown in Bank of America’s disclosure that they have $100BN in unrealized losses on their securities holdings. They’ve benefited as recipients of deposits fleeing smaller regional banks, but it is depressing their net interest margin because they’re stuck with a lot of low-yielding bonds acquired by competing with the Fed during QE. It shouldn’t have been hard to limit bond exposure. Central banks rendered the entire investment grade sector useless to the return-oriented investor. Yields are still too low. Bank of America flubbed risk management. JPMorgan did much better.
We have three funds that seek to profit from this environment:

Important Disclosures
The information provided is for informational purposes only and investors should determine for themselves whether a particular service, security or product is suitable for their investment needs. The information contained herein is not complete, may not be current, is subject to change, and is subject to, and qualified in its entirety by, the more complete disclosures, risk factors and other terms that are contained in the disclosure, prospectus, and offering. Certain information herein has been obtained from third party sources and, although believed to be reliable, has not been independently verified and its accuracy or completeness cannot be guaranteed. No representation is made with respect to the accuracy, completeness or timeliness of this information. Nothing provided on this site constitutes tax advice. Individuals should seek the advice of their own tax advisor for specific information regarding tax consequences of investments. Investments in securities entail risk and are not suitable for all investors. This site is not a recommendation nor an offer to sell (or solicitation of an offer to buy) securities in the United States or in any other jurisdiction.
References to indexes and benchmarks are hypothetical illustrations of aggregate returns and do not reflect the performance of any actual investment. Investors cannot invest in an index and do not reflect the deduction of the advisor’s fees or other trading expenses. There can be no assurance that current investments will be profitable. Actual realized returns will depend on, among other factors, the value of assets and market conditions at the time of disposition, any related transaction costs, and the timing of the purchase. Indexes and benchmarks may not directly correlate or only partially relate to portfolios managed by SL Advisors as they have different underlying investments and may use different strategies or have different objectives than portfolios managed by SL Advisors (e.g. The Alerian index is a group MLP securities in the oil and gas industries. Portfolios may not include the same investments that are included in the Alerian Index. The S & P Index does not directly relate to investment strategies managed by SL Advisers.)
This site may contain forward-looking statements relating to the objectives, opportunities, and the future performance of the U.S. market generally. Forward-looking statements may be identified by the use of such words as; “believe,” “expect,” “anticipate,” “should,” “planned,” “estimated,” “potential” and other similar terms. Examples of forward-looking statements include, but are not limited to, estimates with respect to financial condition, results of operations, and success or lack of success of any particular investment strategy. All are subject to various factors, including, but not limited to general and local economic conditions, changing levels of competition within certain industries and markets, changes in interest rates, changes in legislation or regulation, and other economic, competitive, governmental, regulatory and technological factors affecting a portfolio’s operations that could cause actual results to differ materially from projected results. Such statements are forward-looking in nature and involves a number of known and unknown risks, uncertainties and other factors, and accordingly, actual results may differ materially from those reflected or contemplated in such forward-looking statements. Prospective investors are cautioned not to place undue reliance on any forward-looking statements or examples. None of SL Advisors LLC or any of its affiliates or principals nor any other individual or entity assumes any obligation to update any forward-looking statements as a result of new information, subsequent events or any other circumstances. All statements made herein speak only as of the date that they were made. r
Certain hyperlinks or referenced websites on the Site, if any, are for your convenience and forward you to third parties’ websites, which generally are recognized by their top level domain name. Any descriptions of, references to, or links to other products, publications or services does not constitute an endorsement, authorization, sponsorship by or affiliation with SL Advisors LLC with respect to any linked site or its sponsor, unless expressly stated by SL Advisors LLC. Any such information, products or sites have not necessarily been reviewed by SL Advisors LLC and are provided or maintained by third parties over whom SL Advisors LLC exercise no control. SL Advisors LLC expressly disclaim any responsibility for the content, the accuracy of the information, and/or quality of products or services provided by or advertised on these third-party sites.
All investment strategies have the potential for profit or loss. Different types of investments involve varying degrees of risk, and there can be no assurance that any specific investment will be suitable or profitable for a client’s investment portfolio.
Past performance of the American Energy Independence Index is not indicative of future returns.


The lack of credible commentary about the natural gas sector has retained the bargain prices of, and irrationally high yields on, the equities of midstream infrastructure assets used in natural gas operations. I like that condition.