The Losers From Quantitative Easing

/
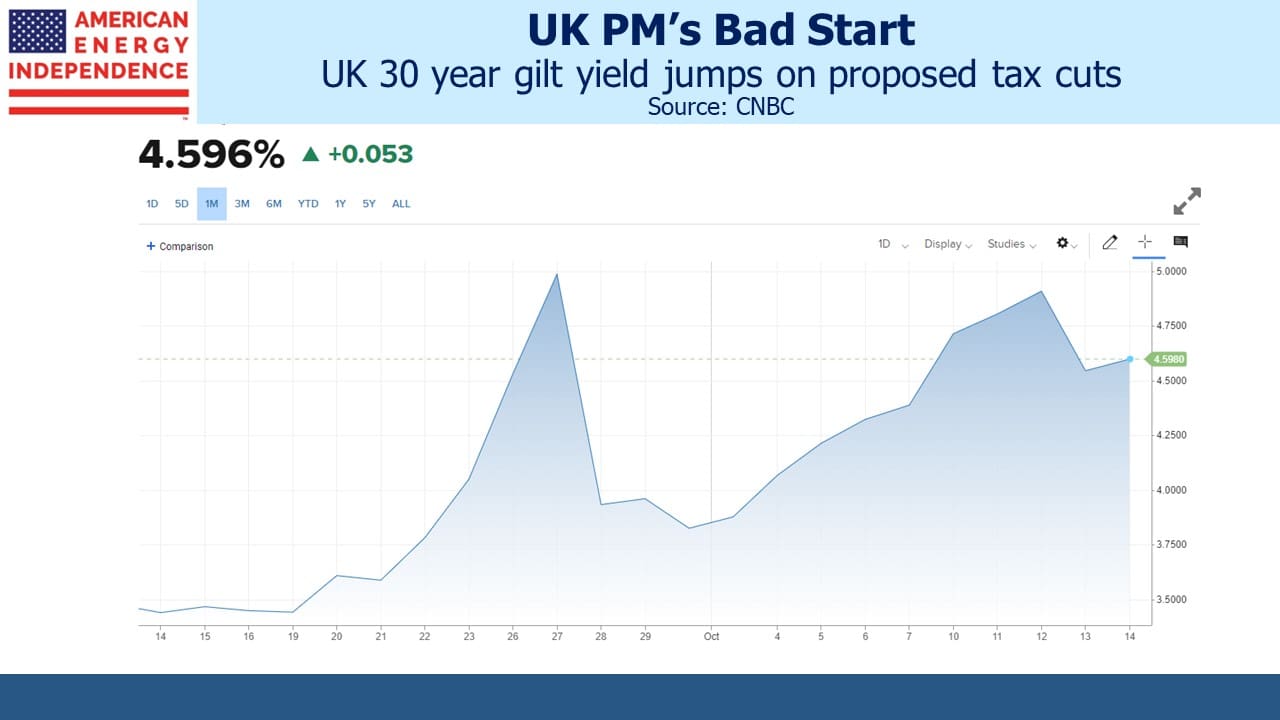
UK Prime Minister (PM) Liz Truss has reached “in office but not in power” in record time. On September 6th she met with Queen Elizabeth II and formally became PM. Two days later the Queen died, commencing a period of mourning that ended with the monarch’s funeral on September 19th. Practically speaking, that’s when Liz Truss’s hold on power began. Four days later her government shocked markets by announcing £45BN ($50BN) in tax cuts funded with borrowing.
Sterling collapsed and by September 28th the Bank of England had abandoned its balance sheet reduction (Quantitative Tightening, or QT) in order to urgently restore financial stability. In the UK bond market pension funds were dumping thirty-year gilts, driving the yield from 3.5% to (briefly) 5%. Conservative party MPs are already discussing ways to dump their new PM.
By Friday self-preservation and market turmoil had forced her to abandon most of the plan, firing her Chancellor of the Exchequer Kwasi Kwarteng for good measure. Truss will henceforth be dodging political regicide following her disastrous start. As the Economist devastatingly observed, her shelf life is about the same as a lettuce.
UK residents are pondering how governmental ineptitude on an epic scale has raised interest rates and made foreign trips more expensive. The rest of us are wondering if it could happen here.
Pension funds and leverage are a poor combination. The solemn trust imposed on those that manage people’s retirement savings requires ensuring market volatility never interferes. Therefore, Liability Driven Investing (LDI), the proximate cause of the turmoil, is worthy of examination. Anytime you see Value at Risk (VaR) included in marketing literature aimed at pension funds, as is the case with LDI, there’s a problem lurking.
Defined Benefit (DB) pension funds are obliged to meet certain obligations in the future, often linked to salary at retirement. Defined Contribution (DC) plans (like 401Ks) are becoming increasingly common, because employers prefer shifting the investment risk to plan participants. The UK has around 5 million people covered by DB plans with assets of £1.8TN ($2TN). For comparison, the US has $16.8TN in DB plans but $13.1TN is in Federal, state or local plans, many of which are underfunded with unclear ultimate outcomes for retirees.
DB pension funds compare their assets with the Net Present Value (NPV) of their obligations to figure out if they have a surplus or deficit. Pensions are among the longest liabilities around, and their NPV is acutely sensitive to changes in the discount rate.
Because US public pension funds follow Governmental Accounting Standards Board (GASB) rather than GAAP, they calculate the NPV of their liabilities oddly, in that they use the rate of return they think they’ll earn on their assets. It creates the perverse incentive to add risky investments since they’ll generally have a higher return, which in turn depresses the NPV of their obligations (see Through the Looking Glass into Public Pension Accounting). The average assumed return on US public pension assets, and therefore the discount rate on their liabilities, is just under 7%. Even though this has been falling, it’s still wildly optimistic.
The UK government issues guidance for DB plan discount rates – currently much lower than the US at around 2.5% depending on the specifics of the plan.
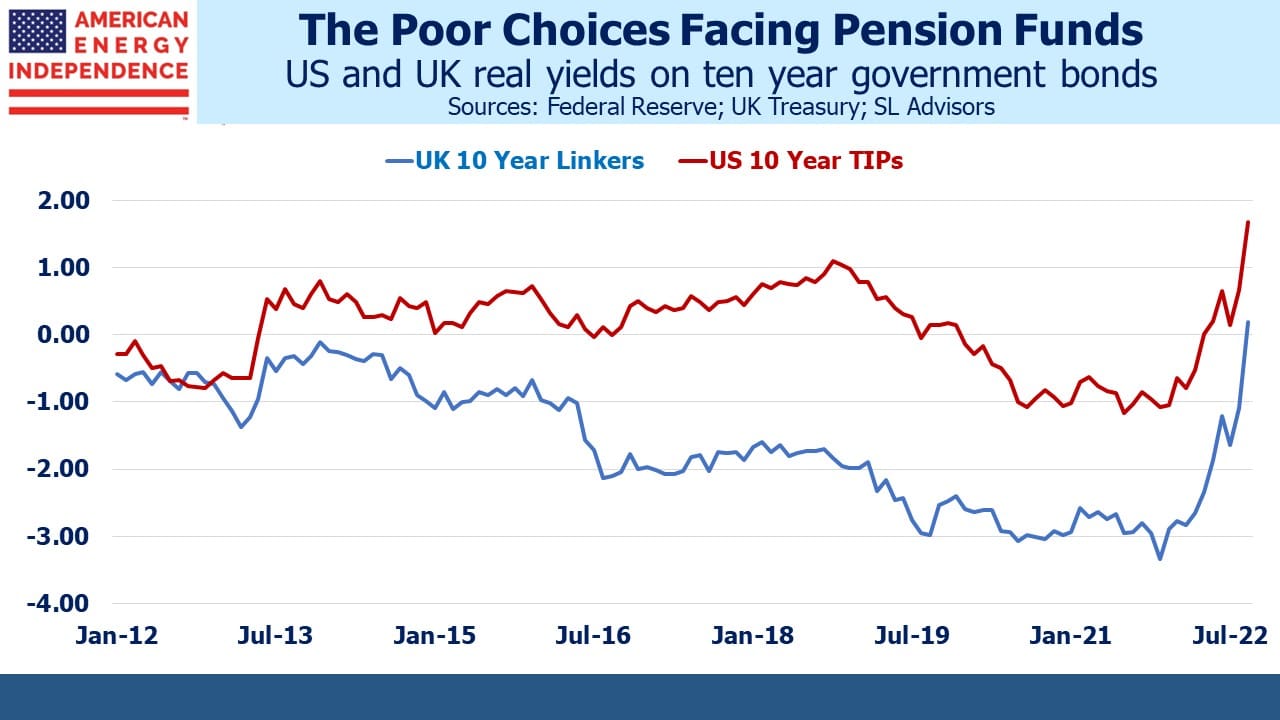
Treasury Inflation Protected Securities (TIPs) offer a return linked to inflation and are appealing to pension funds with their long liabilities. In the UK index-linked gilts are called “linkers.”
Real yields have been falling for years, and on US government debt have at times been negative. The UK is a more extreme version, presumably reflecting a relatively greater appetite of UK pension funds to immunize inflation risk compared to their US counterparts. The dearth of choices available to UK pension funds is apparent in the 1.5% coupon with which the now plunging 30 year gilts were issued just last year.
Investing at negative real yields guarantees reduced purchasing power. Falling long term rates have hurt UK pension funds by increasing the NPV of their liabilities. In theory equities, which represent a perpetual claim on company profits, ought to compensate. A 1% drop in a thirty year discount rate increases the NPV of a payment due in thirty years by 30% (ie the duration of a 30-year zero coupon bond equals its maturity). Unfortunately, you can’t rely on stocks going up by 30% at the same time.
UK pension plans sought advice on managing their exposure to falling rates, and it was helpfully provided by firms such as Russell Investments in the form of derivatives. Simply put, LDI is a derivatives contract that generates a profit for the pension fund when long term rates fall, the point being that falling rates will lead to a lower discount rate and therefore a bigger NPV of their pension obligations. LDI behaves like an investment in long term bonds, but without the need to spend cash to buy the bonds.
Derivatives contracts, like futures, require counterparties to post margin to one another depending on which side of the contract is in the money. The LDI models on which advice is based are naturally complex and proprietary. Pension funds probably relied on the assumption that losses on their LDI trades would be offset by a reduced NPV of their liabilities, and they could use pension contributions to provide additional margin if required. VaR analysis from their consultants would have provided reassurance.
Two things went wrong. One is that UK linker real yields fell to deeply unattractive levels, causing pension funds to explore risky alternatives. The second is that the new PM’s ill-considered fiscal expansion caught the market off-guard, driving yields up sharply. This in turn shredded VaR assumptions, requiring untimely sales of securities by pensions to cover margin calls on LDI losses. Derivatives create leverage. On one level this is another story of too much risk.
However, the underlying problem is low/negative real yields, and these are caused in large part by Quantitative Easing (QE). Society generally likes low borrowing costs, but every borrower has a lender and pension funds are clearly QE-losers. Central banks have been quicker to grow their balance sheets with QE than to shrink them with QT.
Ironically, the Bank of England provided updated guidance on QT on September 22, the day before Kwasi Kwarteng dropped his fiscal bomb. Six days later they were buying again to mop up the mess.
Buying bonds is now part of the central bank toolkit, and in the US it’s virtually certain that the next recession will be upon us before the Fed has shed its excess $TNs. Although real yields have moved up recently, there’s little reason to think their long term decline has ended. The problems of DB pensions haven’t been solved. But the UK does seem like a unique case of poor investment choices and an impetuous new PM.
Meanwhile the Fed is singularly focused on inflation which increases the odds they’ll make another mistake, upon which they’ll switch back to employment. QE will begin again, becoming a permanent form of debt monetization. 2% long term inflation is a poor bet. This FOMC shuns multi-tasking and fixates on one metric at a time. That will be Jay Powell’s legacy.

Important Disclosures
The information provided is for informational purposes only and investors should determine for themselves whether a particular service, security or product is suitable for their investment needs. The information contained herein is not complete, may not be current, is subject to change, and is subject to, and qualified in its entirety by, the more complete disclosures, risk factors and other terms that are contained in the disclosure, prospectus, and offering. Certain information herein has been obtained from third party sources and, although believed to be reliable, has not been independently verified and its accuracy or completeness cannot be guaranteed. No representation is made with respect to the accuracy, completeness or timeliness of this information. Nothing provided on this site constitutes tax advice. Individuals should seek the advice of their own tax advisor for specific information regarding tax consequences of investments. Investments in securities entail risk and are not suitable for all investors. This site is not a recommendation nor an offer to sell (or solicitation of an offer to buy) securities in the United States or in any other jurisdiction.
References to indexes and benchmarks are hypothetical illustrations of aggregate returns and do not reflect the performance of any actual investment. Investors cannot invest in an index and do not reflect the deduction of the advisor’s fees or other trading expenses. There can be no assurance that current investments will be profitable. Actual realized returns will depend on, among other factors, the value of assets and market conditions at the time of disposition, any related transaction costs, and the timing of the purchase. Indexes and benchmarks may not directly correlate or only partially relate to portfolios managed by SL Advisors as they have different underlying investments and may use different strategies or have different objectives than portfolios managed by SL Advisors (e.g. The Alerian index is a group MLP securities in the oil and gas industries. Portfolios may not include the same investments that are included in the Alerian Index. The S & P Index does not directly relate to investment strategies managed by SL Advisers.)
This site may contain forward-looking statements relating to the objectives, opportunities, and the future performance of the U.S. market generally. Forward-looking statements may be identified by the use of such words as; “believe,” “expect,” “anticipate,” “should,” “planned,” “estimated,” “potential” and other similar terms. Examples of forward-looking statements include, but are not limited to, estimates with respect to financial condition, results of operations, and success or lack of success of any particular investment strategy. All are subject to various factors, including, but not limited to general and local economic conditions, changing levels of competition within certain industries and markets, changes in interest rates, changes in legislation or regulation, and other economic, competitive, governmental, regulatory and technological factors affecting a portfolio’s operations that could cause actual results to differ materially from projected results. Such statements are forward-looking in nature and involves a number of known and unknown risks, uncertainties and other factors, and accordingly, actual results may differ materially from those reflected or contemplated in such forward-looking statements. Prospective investors are cautioned not to place undue reliance on any forward-looking statements or examples. None of SL Advisors LLC or any of its affiliates or principals nor any other individual or entity assumes any obligation to update any forward-looking statements as a result of new information, subsequent events or any other circumstances. All statements made herein speak only as of the date that they were made. r
Certain hyperlinks or referenced websites on the Site, if any, are for your convenience and forward you to third parties’ websites, which generally are recognized by their top level domain name. Any descriptions of, references to, or links to other products, publications or services does not constitute an endorsement, authorization, sponsorship by or affiliation with SL Advisors LLC with respect to any linked site or its sponsor, unless expressly stated by SL Advisors LLC. Any such information, products or sites have not necessarily been reviewed by SL Advisors LLC and are provided or maintained by third parties over whom SL Advisors LLC exercise no control. SL Advisors LLC expressly disclaim any responsibility for the content, the accuracy of the information, and/or quality of products or services provided by or advertised on these third-party sites.
All investment strategies have the potential for profit or loss. Different types of investments involve varying degrees of risk, and there can be no assurance that any specific investment will be suitable or profitable for a client’s investment portfolio.
Past performance of the American Energy Independence Index is not indicative of future returns.


Leave a Reply
Want to join the discussion?Feel free to contribute!